


文章目录
这篇笔记不仅仅限于网关,只是本人开发网关时,涉及性能测试时,进行性能测试场景分析和设计时,想到的一些东西
性能测试目的
除了定量描述系统的性能,更重要的一点是定位系统的瓶颈。
按照DevOps原则,性能测试是一项协同的工作,做测试之前,首先需要熟悉系统业务和架构,根据具体场景和性能测试需求,进行场景分析和测试场景设计,并指定测试计划。
设计出来测试计划之后,对计划评审。
评审之后,再去根据测试计划去执行。
要基于以下几个原则:
- 脱离实际场景的测试结果意义不大
- 脱离测试需求的性能测试就是耍流氓
- 保证系统测试期间,没有其他干扰。
最后就可以进行测试结果分析,出分析报告。
性能测试理论
1. 性能测试指标
吞吐率
吞吐量指的是单位时间内系统响应的数据量,比如系统的吞吐率为10KB/s。响应数据每秒能够达到10KB。
响应时间(RT)
响应时间是指系统对请求的平均响应时间
TPS(QPS)
每秒事务处理数
并发数
同一个时间点,系统能够承受的用户数量。
时间点它其实并不是一个点,请求也不是严格意义上同时涌入服务器的,即使测试工具可以做到这一点也毫无意义。因为真实的场景是,来自不同用户的请求在较短的时间内,大量涌入服务器。
在较短时间内,由于大量用户使用导致大量请求涌入系统,那么假设在1s内,那么系统可以承受有多少用户在这1s内一起请求呢?这就是我理解的并发数。
次要参数
- DAU(Daily Active User),日活跃用户数量。
- MAU(Month Active User):月活跃用户数量,指网站等去重后的月活跃用户数量。
2. 经验数值
系统的TPS很高,但是请求失败率很高?这种情况下的TPS是没有意义的。所以指标的极限比如最大TPS,最大并发数是在其他条件的约束下才有实际的意义。
这些经验数值通常是性能测试的约束条件。
举个具体的例子:在CPU及内存占用不超过80%,请求失败率不超过99%的条件A系统能够承受的极限并发数是多少?这个里面CPU及内存占用率,请求失败率就是极限并发数的约束。也就是极限并发数在参数不超标的情况下,给出的数值才有意义。
| 约束指标 | 参数 |
|---|---|
| CPU | 80% |
| 内存 | 80% |
| 带宽 | 80% |
| 磁盘带宽 | 80% |
| 请求失败率 | 99.99% (100%对于重要事务,比如银行交易) |
| 请求响应时间(平均) | 3s |
| 请求响应时间(最大) | 6s |
这些约束条件不超过的情况下,给出如下性能测试指标,基本就能定量描述网关的性能。
| 性能指标 | 解释 |
|---|---|
| TPS | 每秒事务数 |
| 并发数 | 同一个时间点,系统能够承受的用户数量。 |
| 吞吐率 | 系统每秒输入/输出数据数量。对于非文件服务类型的系统不太重要 |
待续~~~
测试的种类
What is performance testing?
If we should explain our definition of performance testing in one sentence it would be:
“Performance testing is artificially creating or simulating load and measuring how your environment handles it.”
This means it does not necessary have to be how a system performs under high load, it can also be how it performs under base load or expected load. It doesn’t even have to be structured, automated or created in a tool like SoapUI; simply refreshing your web browser over and over again very fast is a load test.
What kinds of performance testing are there?
There are various definitions of performance testing:
• Baseline Testing
Technically speaking, this can be defined as pure performance testing. Baseline testing examines how a system performs under expected or normal load and creates a baseline with which other types of tests can be compared.
Goal: Find metrics for system performance under normal load.
• Load Testing
Load testing includes increasing the load and see how the system behaves under higher load. During load testing, you can monitor response times, throughput, server conditions, and more. The goal of load testing is not to break the target environment though.
Goal: Find metrics for system performance under high load.
• Stress Testing
The goal of stress test is exactly that, to find the load volume where the system actually breaks or is close to breaking.
Goal: Find the system breaking point.
• Soak Testing
To find system instabilities that occur over time, you need to run tests for a long period. That is what soak testing is for; run load tests or even baseline tests over a long period of time and see how the target environment handles system resources and if it works properly. The most common defect found by soak testing is memory leaks. The most common scenario for soak testing is turning on a number of tests when you leave your office on a Friday and let it run over the weekend.
Goal: Make sure no unwanted behavior emerges over a long period of time.
• Scalability Testing
The purpose of scalability testing is to check whether your system scales appropriately to the changing load. For example, a larger number of incoming requests should cause proportial increase in the response time. The unproportional increase indicates scalability issues.
Goal: Find metrics and check if the system performance changes appropriately to the load.
补充自:https://www.soapui.org/docs/load-testing/concept/
性能测试工具
load runner
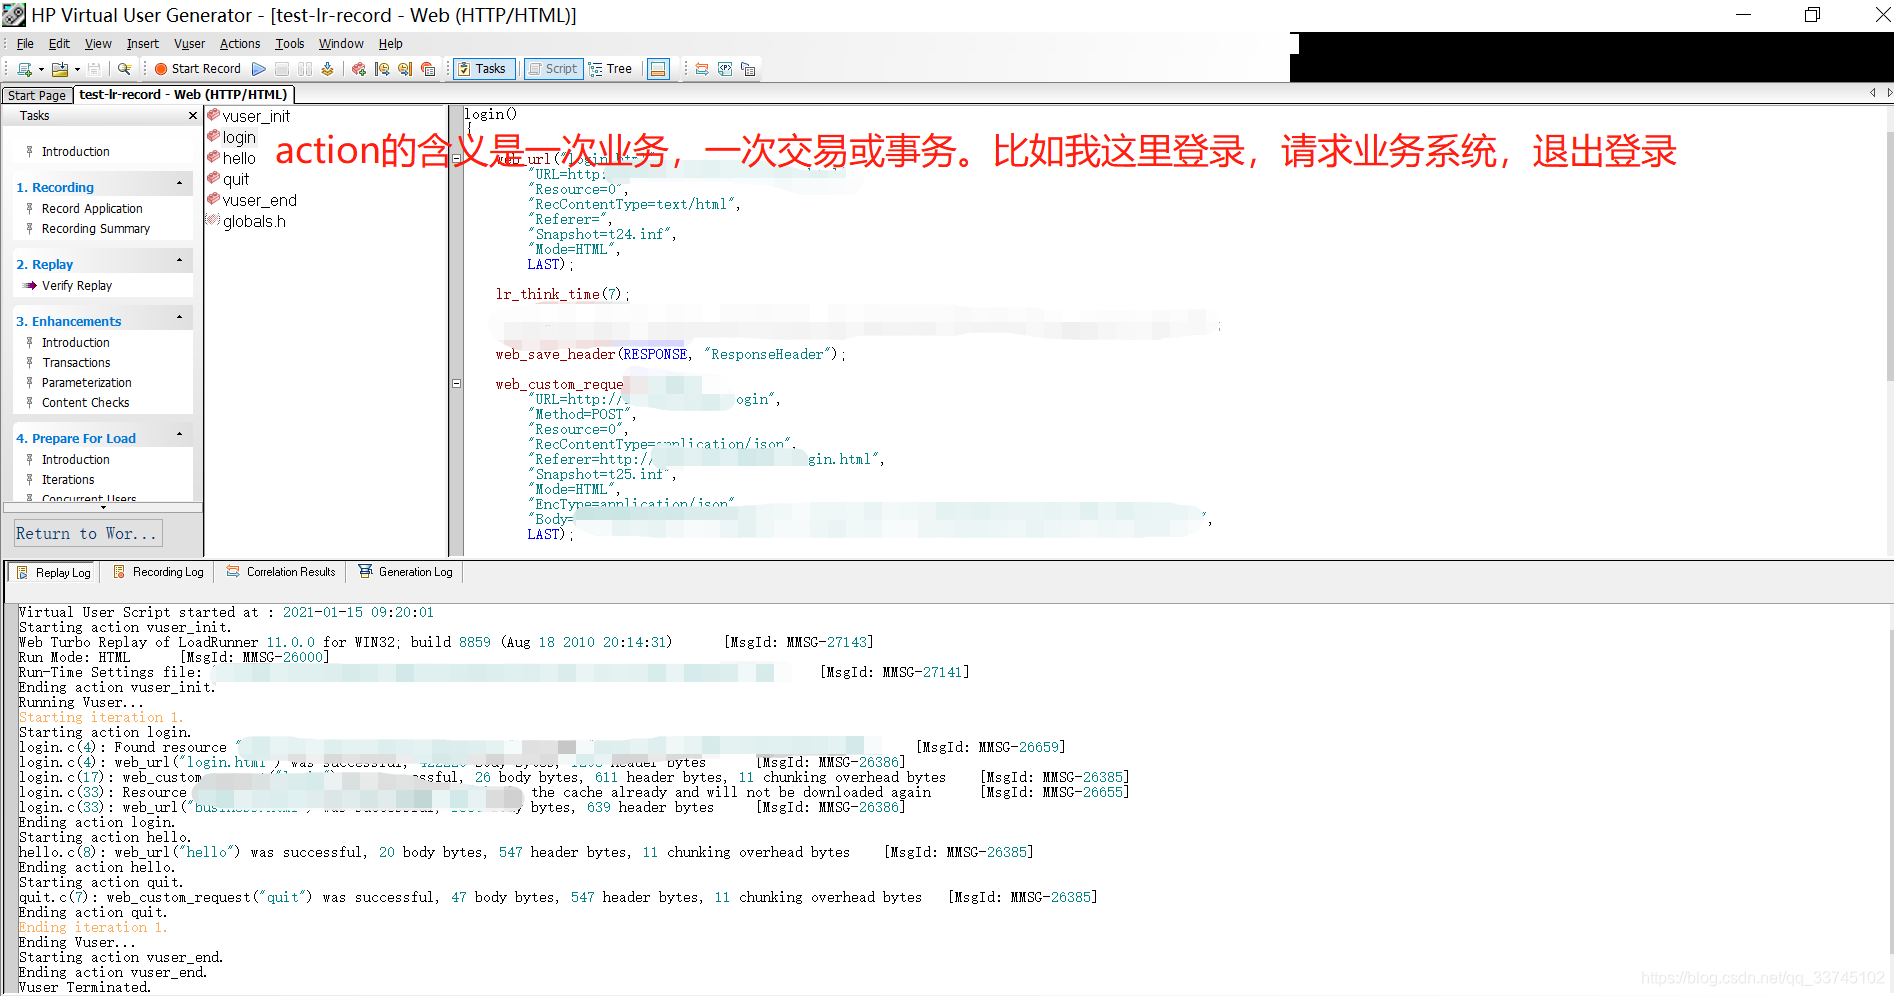
以下简称LR, 收费,HP公司,现在属于micro focus,最大的特点就是可以录制生成脚本,这里的录制就是LR会监听发往某个域名下或IP的HTTP请求。
比如你指定监听发往http://192.168.0.10:80/hello下的请求,当你在页面点击按钮,浏览器向后端发送HTTP请求的时候,这个请求LR就会拦截查看请求体,请求头等内容再发往后端。
比如这个是我一个请求对应的生成脚本:
web_custom_request("login",
		"URL=http://127.0.0.1/login",
		"Method=POST",
		"Resource=0",
		"RecContentType=application/json",
		"Referer=http://127.0.0.1/login/login.html",
		"Snapshot=t25.inf",
		"Mode=HTML",
		"EncType=application/json",
		"Body={\"username\":\"hello\",\"password\":\"efd9d1b8bfb00e8e3647991f7375d1d8\"}",
		LAST);
Cookie自动生成
如果录制的应用需要登录的话,LR会自动从Set-Cookie抽取Cookie,在之后的请求头携带Cookie.也就是说,你不用手动去处理Cookie !
LR的主体
分成三个主要部分
- 虚拟用户生成器–Virtual User Generator(编写测试脚本的,里面有编辑器,可以使用c,java,js等写测试脚本)
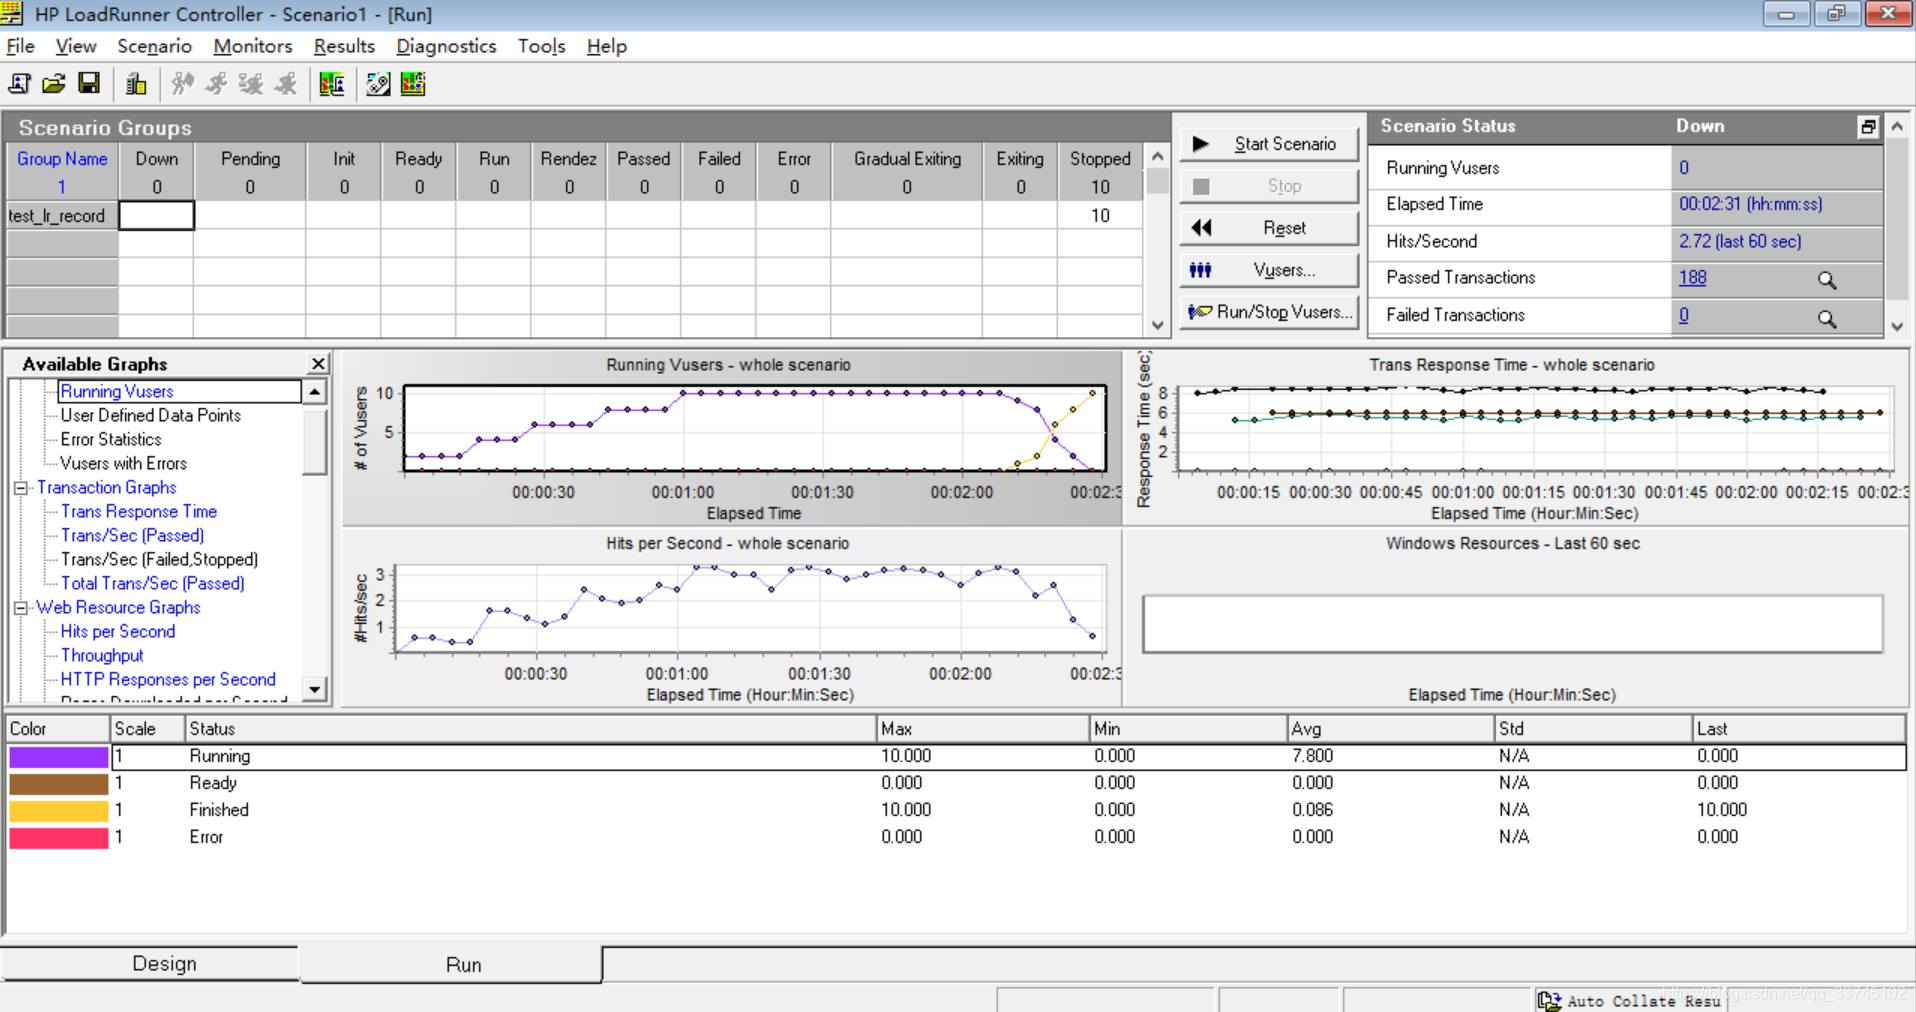
- 控制器(点击压测按钮,可以出数据的地方)
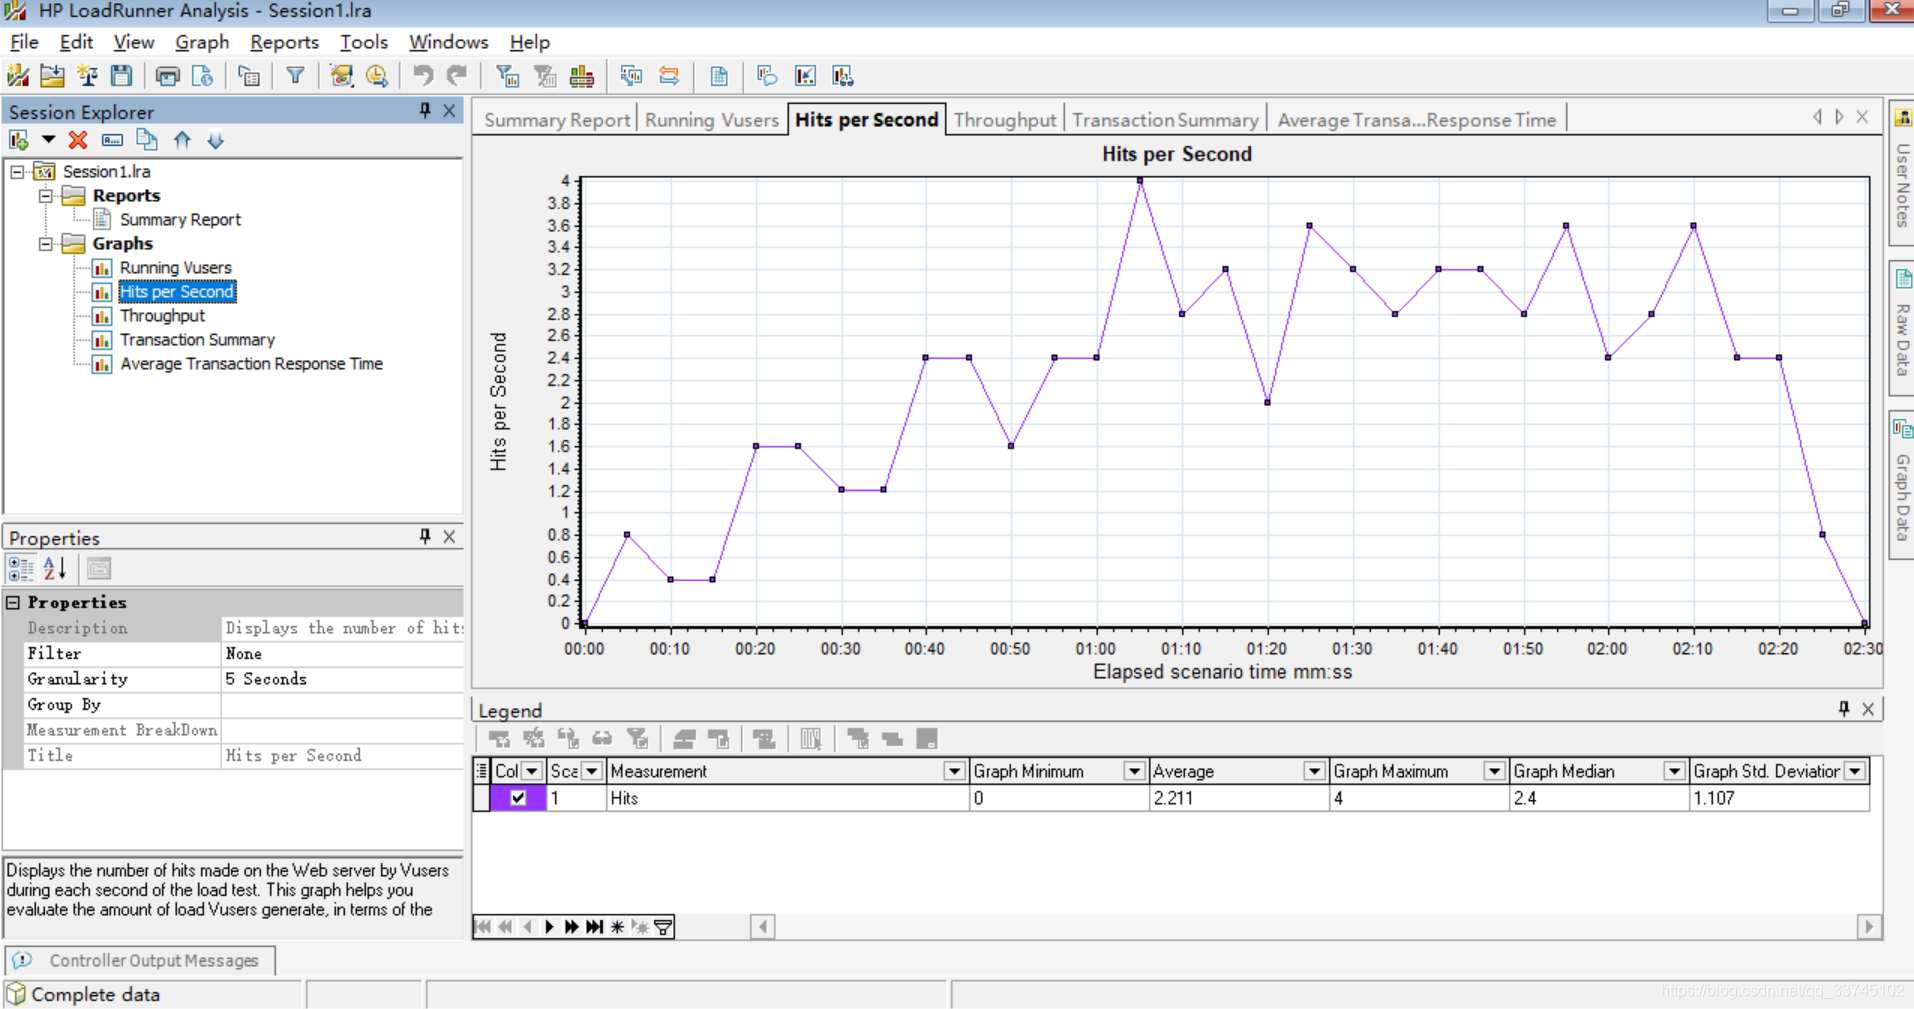
- 分析器(根据控制器出的数据,把数据变成统计图表)
我用的LR 11界面比较古老,分别截个图:
LR的三大部分
VUG
控制器
这个是压测时,出现的动态数据。压测完,点击Results->Analysis Results,就可以看统计图表了。
分析器
分析器这里可以看统计图表,有看不到的图可以右键添加图,比如响应时间,HTTP状态码统计之类的。


 被折叠的 条评论
为什么被折叠?
被折叠的 条评论
为什么被折叠?
 到【灌水乐园】发言


