


官方网址:https://echarts.apache.org/examples/zh/index.html
折线图常用配置项
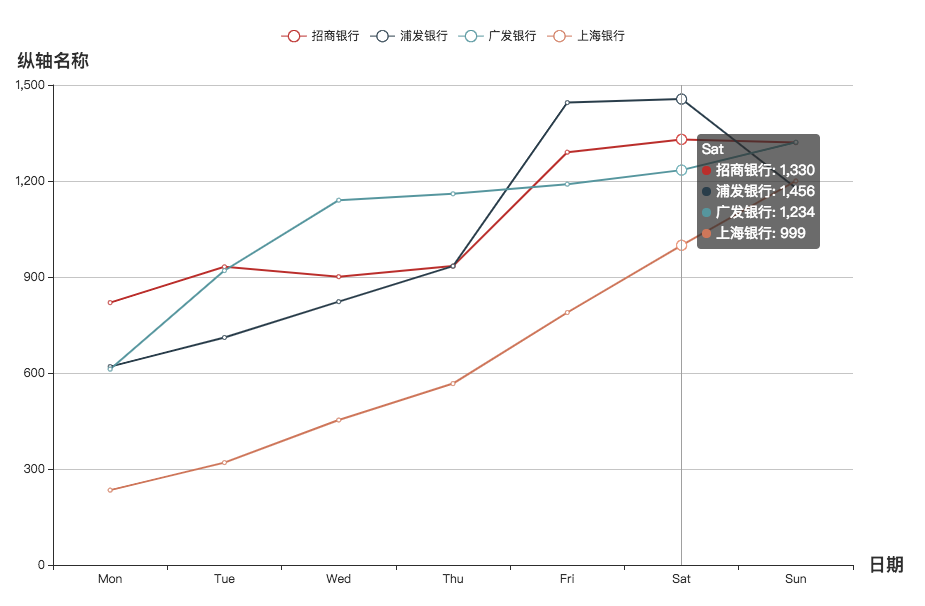
效果图:
1. 首先引入echarts工具
// vue文件中引入echarts工具
let echarts = require('echarts/lib/echarts')
require('echarts/lib/chart/line')
// 以下的组件按需引入
require('echarts/lib/component/tooltip')   // tooltip组件
require('echarts/lib/component/title')   //  title组件
require('echarts/lib/component/legend')  // legend组件
2. option配置
// option将要设置以下字段感觉就足够使用了
option: {
    legend: {},
    xAxis: {},
    yAxis: {},
    label: {},
    tooltip: {},
    series: []
}- legend字段,是为了配置下图的表现的;注意data字段的数组需要对应每条折线的名称,鼠标hover到最顶部的legend标志,可以标志对应的折线图,点击legend标志会隐藏对应的折线图
legend: {
    data: ['招商银行', '浦发银行', '广发银行', '上海银行'],
    x:'right',      //可设定图例在左、右、居中
    y:'center',     //可设定图例在上、下、居中
    padding:[0,50,0,0],   //可设定图例[距上方距离,距右方距离,距下方距离,距左方距离]
    left:'50px', 具体像素值或百分比
    right:'50px',
    top:'50px',
    bottom:'50px'
},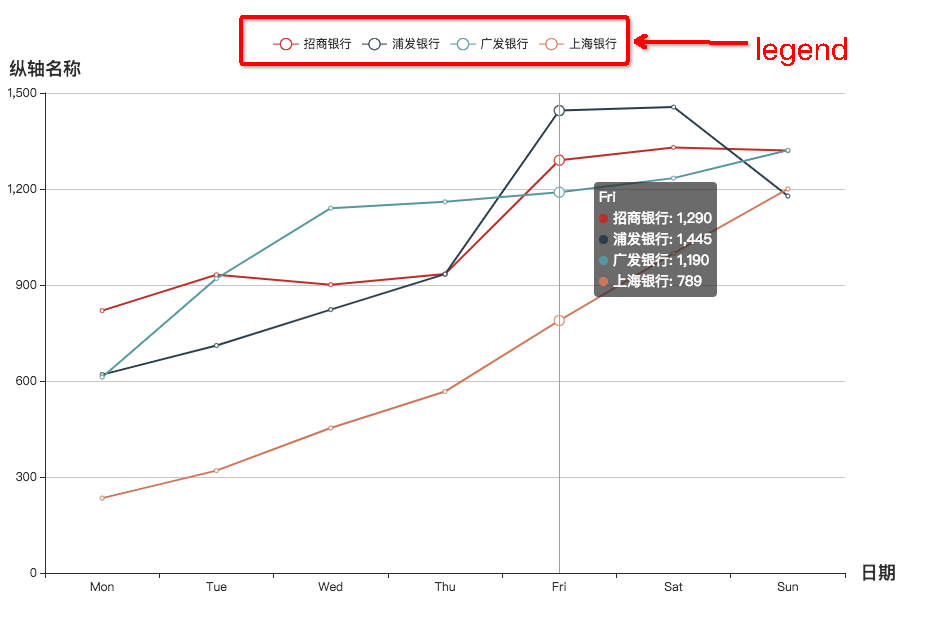
- grid,设置Echarts样式大小
grid:{
    top:'48',
    left:'400',
    right:'50',
    bottom:'50',
    height: '50%',
    width: '60%'
}- xAxis,配置x轴数据、样式、名称
xAxis: {
  type: 'category',   // 类目轴,适用于离散的类目数据。还有其他的type
  data: ['Mon', 'Tue', 'Wed', 'Thu', 'Fri', 'Sat', 'Sun'],   // x轴数据
  name: '日期',   // x轴名称
  nameTextStyle: { // x轴名称样式
    fontWeight: 600,
    fontSize: 18
  },
  axisPointer: {
    type: 'shadow'
  },
  axisLabel : {
    interval:0, //可以设置为0强制显示所有标签,如果设置为1,表示隔一个标签显示一个标签
    rotate:40 //X标签倾斜的角度,在类目轴的类目标签显示不全时可以通过旋转防止标签重叠
  }
},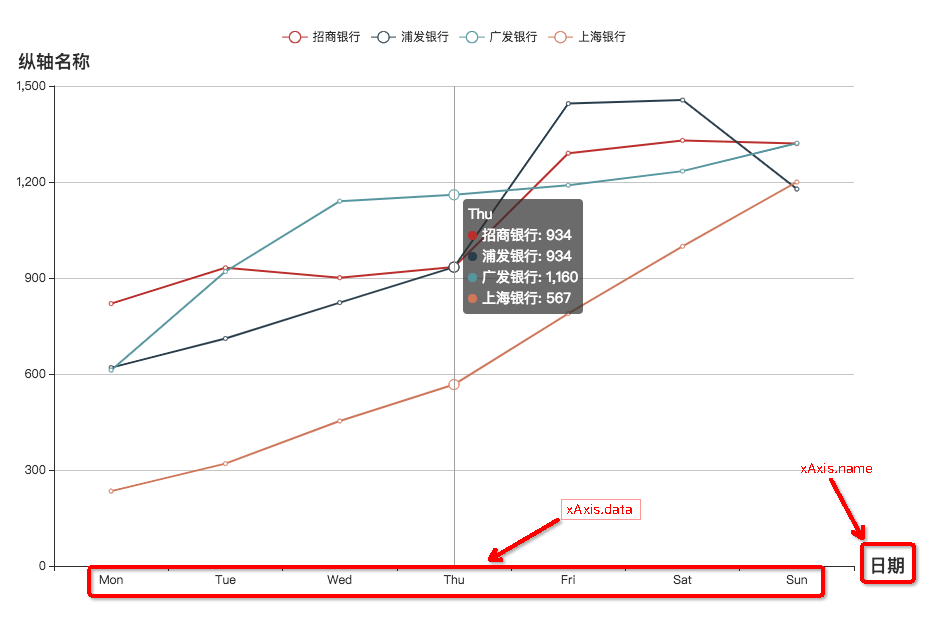
- yAxis,配置y轴名称,样式
yAxis: {
  type: 'value',
  name: '纵轴名称',  // y轴名称
  nameTextStyle: {  // y轴名称样式
    fontWeight: 600,
    fontSize: 18
  }
}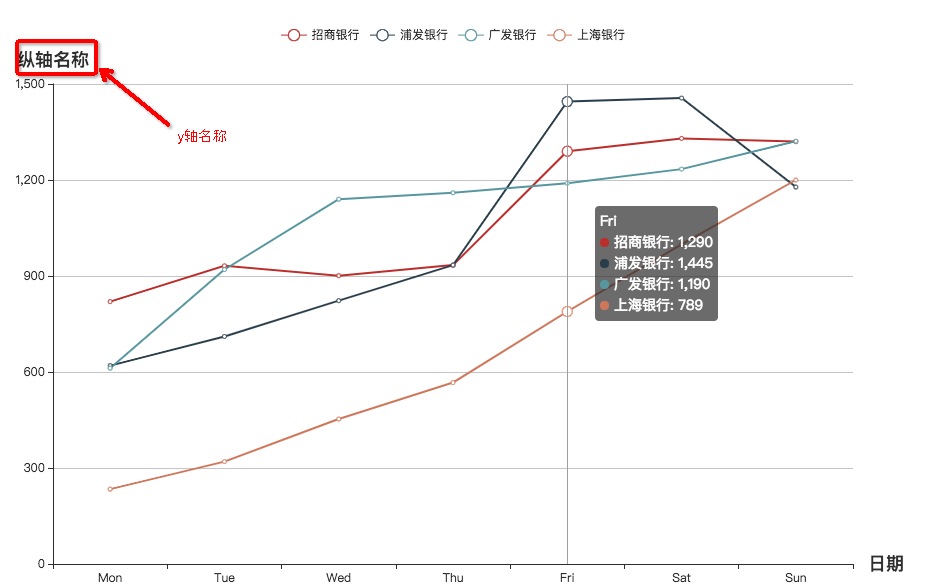
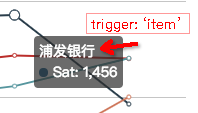
- tooltip,鼠标放到折线图上展示的数据展示样式
tooltip: {
  trigger: 'axis'   // axis   item   none三个值
},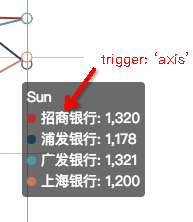
- toolbox 这个功能可以切换到数据视图,如果发现折线不显示可以在这里看看数据是否正确,非常好用。而且还提供折线图转柱状图和柱状图转折线图
toolbox: {
    feature: {
        dataView: {show: true, readOnly: false},
        magicType: {show: true, type: ['line', 'bar']},
        restore: {show: true},
        saveAsImage: {show: true}
    }
} 

- series,y轴数据,每条折线的名称
series: [
  {
    name: '招商银行',
    type: 'line',
    data: [820, 932, 901, 934, 1290, 1330, 1320]
  },
  {
    name: '浦发银行',
    type: 'line',
    data: [620, 711, 823, 934, 1445, 1456, 1178]
  },
  {
    name: '广发银行',
    data: [612, 920, 1140, 1160, 1190, 1234, 1321],
    type: 'line'
  },
  {
    name: '上海银行',
    type: 'line',
    data: [234, 320, 453, 567, 789, 999, 1200]
  }
]
3. html标签代码,注意要先写好div的宽度和高度,否则这折线图展示不出来
// 折线图显示在这个div中,
<div id="myChart"></div>
4. 渲染折线图
let myChart = echarts.init(document.getElementById('myChart'))
myChart.setOption(this.option)
折线图柱形图混合
效果图:

<div id="chart1"></div>var echartsOption1 = {
title: {
text: '销量及KPE',
textStyle: {
fontSize: 15
}
},
tooltip: {
trigger: 'axis',
axisPointer: {
type: 'cross',
crossStyle: {
color: '#999'
}
}
},
toolbox: { // 这个功能可以切换到数据视图,如果发现折线不显示可以在这里看看数据是否正确,非常好用
feature: {
dataView: {show: true, readOnly: false},
magicType: {show: true, type: ['line', 'bar']},
restore: {show: true},
saveAsImage: {show: true}
}
},
grid: {
height: '80%',
width: '80%' //左右边距,设置为100,显示不全12月
},
legend: {
data: ['蒸发量', '降水量', '平均温度']
},
xAxis: [
{
type: 'category',
// data: (function (){
// var res = [];
// res = this.newProleadList.filter(item => item.vehicleMode == 'audi')
// return res;
//}),
['1月', '2月', '3月', '4月', '5月', '6月', '7月', '8月', '9月', '10月', '11月', '12月'],
axisPointer: {
type: 'shadow'
}
}
],
yAxis: [
{
type: 'value',
name: '水量',
min: 0,
max: 250,
interval: 50,
axisLabel: {
formatter: '{value} ml'
}
},
{
type: 'value',
name: '温度',
min: 0,
max: 25,
interval: 5,
axisLabel: {
formatter: '{value} °C'
}
}
],
series: [
{
name: '蒸发量',
type: 'bar',
data: [2.0, 4.9, 7.0, 23.2, 25.6, 76.7, 135.6, 162.2, 32.6, 20.0, 6.4, 3.3]
},
{
name: '降水量',
type: 'bar',
data: [2.6, 5.9, 9.0, 26.4, 28.7, 70.7, 175.6, 182.2, 48.7, 18.8, 6.0, 2.3]
},
{
name: '平均温度',
type: 'line',
yAxisIndex: 1,
data: [2.0, 2.2, 3.3, 4.5, 6.3, 10.2, 20.3, 23.4, 23.0, 16.5, 12.0, 6.2]
}
]
}
var myChart = echarts.init(document.getElementById('chart1'))
myChart.setOption(echartsOption1)无数据默认显示暂无数据
let option = {
	graphic: {
		type: 'text',     // 类型:文本
		left: 'center',
		top: 'middle',
		silent: true,     // 不响应事件
		invisible: this.lineData.length > 0,   // 有数据就隐藏
		style: {
			fill: '#38adb9',
			fontWeight: 'bold',
			text: '暂无数据',
			fontFamily: 'Microsoft YaHei',
			fontSize: '25px'
		}
	},
	...
}
ElementUI + Vue 用for循环渲染Echarts
<el-row>
    <el-col :span="12" v-for="(item,index) in this.newProleadList" :key="index">
        <div class="chartBox roseChart"></div>
    </el-col>
</el-row>
this.$nextTick(() => {
this.draw()
})draw(){
var roseCharts = document.getElementsByClassName('roseChart')
for(var i = 0;i < roseCharts.length;i++ ){
let arr1 = []
let kpeArr = []
let fzgArr = []
this.newProleadList[i].data.forEach(item =>{
arr1.push(item.vehicleMode)
kpeArr.push(item.kpe)
fzgArr.push(item.fzg)
})
let xAxisObj = {}
xAxisObj.type = 'category'
xAxisObj.data = arr1
xAxisObj.axisPointer = {type: 'shadow'}
var myChart = echarts.init(roseCharts[i])
myChart.setOption({
title: {
text: this.newProleadList[i].brandName+'品牌',
textStyle: {
fontSize: 11
}
},
tooltip: {
trigger: 'axis',
axisPointer: {
type: 'cross',
crossStyle: {
color: '#999'
}
}
},
legend: {
data: ['销量规划', 'KPE']
},
xAxis: xAxisObj,
yAxis: [
{
type: 'value',
minInterval: 0,
axisLabel: {
formatter: '{value}'
}
},
{
type: 'value',
minInterval: 0,
axisLabel: {
formatter: '{value} %'
}
}
],
series: [
{
name: '销量规划',
type: 'bar',
data: fzgArr,
itemStyle: {
color: '#82d1ec'
},
label: {
show: true
}
},
{
name: 'KPE',
type: 'line',
yAxisIndex: 1,
data: kpeArr,
itemStyle: {
color: '#aaaa7f'
},
label: {
show: true
}
}
],
})
}
}


 4537
4537


 被折叠的 条评论
为什么被折叠?
被折叠的 条评论
为什么被折叠?
 到【灌水乐园】发言


