


需求:
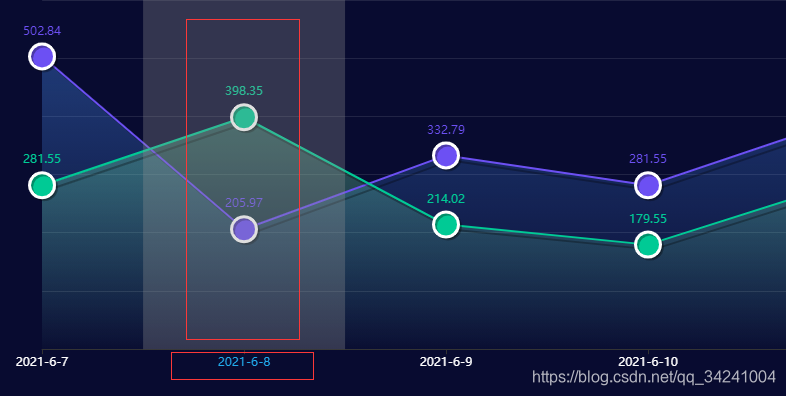
如图所示,点击echart图表的x轴线或者x轴坐标,获取x轴的数据,高亮显示x轴坐标。
关键代码:
	//设置x轴坐标可以点击
	xAxis: [{
		triggerEvent: true,
	    axisLabel: {
	    	color: function (value, index) {
	   			return value == time ? '#21aced' : '#fff';
	    	},
	    	clickable: true,
	    },
	}],

      let time = ""
      //点击x轴线
      myChart.getZr().on('click', params => {
        const pointInPixel = [params.offsetX, params.offsetY]
        if (myChart.containPixel('grid', pointInPixel)) {
          const xIndex = myChart.convertFromPixel({ seriesIndex: 0 }, [params.offsetX, params.offsetY])[0]
          time = option.xAxis[0].data[xIndex]
          myChart.resize();
          console.log(time)
        }
      })

      //点击x轴坐标
      myChart.on('click', 'xAxis.category', function (params, node) {
        time = params.value
        myChart.resize();
        console.log(time)
      });
完整示例:
可以到https://www.makeapie.com/editor.html测试
option = {
    backgroundColor: '#080b30',
    title: {
        text: '哎呦,不错哦',
        textStyle: {
            align: 'center',
            color: '#fff',
            fontSize: 20,
        },
        top: '5%',
        left: 'center',
    },
    tooltip: {
          trigger: 'axis',
      axisPointer: {
        type: 'shadow'
      },
      confine: true
    },
    grid: {
        top: '15%',
        left: '5%',
        right: '5%',
        bottom: '15%',
        // containLabel: true
    },
    xAxis: [{
        type: 'category',
        triggerEvent: true,//
        axisLine: {
            show: true
        },
        splitArea: {
            // show: true,
            color: '#f00',
            lineStyle: {
                color: '#f00'
            },
        },
        axisLabel: {
            color: function (value, index) {
                return value == time ? '#21aced' : '#fff';
            },
            clickable: true,//
        },
        splitLine: {
            show: false
        },
        boundaryGap: false,
        data: ['2021-6-7', '2021-6-8', '2021-6-9', '2021-6-10', '2021-6-11', '2021-6-12'],

    }],

    yAxis: [{
        type: 'value',
        min: 0,
        // max: 140,
        splitNumber: 4,
        splitLine: {
            show: true,
            lineStyle: {
                color: 'rgba(255,255,255,0.1)'
            }
        },
        axisLine: {
            show: false,
        },
        axisLabel: {
            show: false,
            margin: 20,
            textStyle: {
                color: '#d1e6eb',

            },
        },
        axisTick: {
            show: false,
        },
    }],
    series: [{
            name: '注册总量',
            type: 'line',
            // smooth: true, //是否平滑
            showAllSymbol: true,
            // symbol: 'image://./static/images/guang-circle.png',
            symbol: 'circle',
            symbolSize: 25,
            lineStyle: {
                normal: {
                    color: "#6c50f3",
                    shadowColor: 'rgba(0, 0, 0, .3)',
                    shadowBlur: 0,
                    shadowOffsetY: 5,
                    shadowOffsetX: 5,
                },
            },
            label: {
                show: true,
                position: 'top',
                textStyle: {
                    color: '#6c50f3',
                }
            },
            itemStyle: {
                color: "#6c50f3",
                borderColor: "#fff",
                borderWidth: 3,
                shadowColor: 'rgba(0, 0, 0, .3)',
                shadowBlur: 0,
                shadowOffsetY: 2,
                shadowOffsetX: 2,
            },
            tooltip: {
                show: false
            },
            areaStyle: {
                normal: {
                    color: new echarts.graphic.LinearGradient(0, 0, 0, 1, [{
                            offset: 0,
                            color: 'rgba(74,145,247,0.5)'
                        },
                        {
                            offset: 1,
                            color: 'rgba(74,145,247,0.01)'
                        }
                    ], false),
                }
            },
            data: [502.84, 205.97, 332.79, 281.55, 398.35, 214.02, ]
        },
        {
            name: '注册总量',
            type: 'line',
            // smooth: true, //是否平滑
            showAllSymbol: true,
            // symbol: 'image://./static/images/guang-circle.png',
            symbol: 'circle',
            symbolSize: 25,
            lineStyle: {
                normal: {
                    color: "#00ca95",
                    shadowColor: 'rgba(0, 0, 0, .3)',
                    shadowBlur: 0,
                    shadowOffsetY: 5,
                    shadowOffsetX: 5,
                },
            },
            label: {
                show: true,
                position: 'top',
                textStyle: {
                    color: '#00ca95',
                }
            },

            itemStyle: {
                color: "#00ca95",
                borderColor: "#fff",
                borderWidth: 3,
                shadowColor: 'rgba(0, 0, 0, .3)',
                shadowBlur: 0,
                shadowOffsetY: 2,
                shadowOffsetX: 2,
            },
            tooltip: {
                show: false
            },
            areaStyle: {
                normal: {
                    color: new echarts.graphic.LinearGradient(0, 0, 0, 1, [{
                            offset: 0,
                            color: 'rgba(121,249,177,0.5)'
                        },
                        {
                            offset: 1,
                            color: 'rgba(121,249,177,0.01)'
                        }
                    ], false),
                }
            },
            data: [281.55, 398.35, 214.02, 179.55, 289.57, 356.14, ],
        },
    ]
};

      let time = ""

      //点击x轴线
      myChart.getZr().on('click', params => {
        const pointInPixel = [params.offsetX, params.offsetY]
        if (myChart.containPixel('grid', pointInPixel)) {
          const xIndex = myChart.convertFromPixel({ seriesIndex: 0 }, [params.offsetX, params.offsetY])[0]
          time = option.xAxis[0].data[xIndex]
          myChart.resize();
          console.log(time)
        }
      })

      //点击x轴坐标
      myChart.on('click', 'xAxis.category', function (params, node) {
        time = params.value
        myChart.resize();
        console.log(time)
      });


 702
702

 被折叠的 条评论
为什么被折叠?
被折叠的 条评论
为什么被折叠?
 到【灌水乐园】发言


