


微服务的优点是服务模块化,高内聚,低耦合。随着服务数量的增多,服务的监控也变得异常困难。springcloud引入提供了admin组件,人性化UI管理界面可以对所有服务的运行状态进行监控,并提供告警等功能。
一.springboot-admin简介
-
显示健康状况
-
显示详细信息,例如
-
JVM和内存指标
-
数据源指标
-
缓存指标
-
关注并下载日志文件
-
查看jvm系统和环境属性
-
查看Spring Boot配置属性
-
轻松的日志级管理
-
与JMX-beans交互
-
查看线程转储
-
查看http跟踪
-
查看http-endpoints
-
查看计划任务
-
查看和删除活动会话(使用spring-session)
-
下载heapdump
-
状态变更通知(通过电子邮件,Slack,Hipchat,…)
-
状态更改的事件日志(非持久性)
等
二.搭建
由于admin 2.2.0版本已经支持中文界面,所以这里介绍该版本的搭建使用。所有的服务都是注册到eureka,监控也是通过注册中心来监控服务的。
服务端
1.pom
springboot版本2.2.2.RELEASE,监控服务都是基于注册中心的
<dependencies>
		<dependency>
			<groupId>org.springframework.boot</groupId>
			<artifactId>spring-boot-starter</artifactId>
		</dependency>
		<dependency>
			<groupId>org.springframework.boot</groupId>
			<artifactId>spring-boot-starter-mail</artifactId>
		</dependency>
		<dependency>
			<groupId>de.codecentric</groupId>
			<artifactId>spring-boot-admin-starter-server</artifactId>
		</dependency>
		<dependency>
			<groupId>org.springframework.boot</groupId>
			<artifactId>spring-boot-starter-web</artifactId>
		</dependency>

		<dependency>
			<groupId>org.springframework.boot</groupId>
			<artifactId>spring-boot-starter-actuator</artifactId>
			<version>2.2.0.RELEASE</version>
		</dependency>
		<dependency>
			<groupId>org.springframework.cloud</groupId>
			<artifactId>spring-cloud-starter-netflix-eureka-client</artifactId>
			<version>2.2.0.RELEASE</version>
		</dependency>
	</dependencies>
2.bootstrap.yml
配置了邮箱之后,服务下线就会立即告警
server:
  port: 9001
spring:
  application:
    name: admin-server #服务名称
  profiles:
      active: @spring.active@
  mail:
    host: smtp.xxx.com #邮件服务器地址
    port: xxx
    username: xxx
    password: xxx
    properties:
      mail:
        smtp:
          auth: true
          starttls:
            enable: true
            required: true
          socketFactory:
            class: javax.net.ssl.SSLSocketFactory
  boot:
    admin:
      notify:
        mail:
          from: xx #发送人邮箱账号
          to: #接收人邮箱账号
management:
  endpoints:
    web:
      exposure:
        include: "*"
  endpoint:
    health:
      show-details: ALWAYS
3.启动类
@SpringBootApplication
@EnableAdminServer
@EnableEurekaClient
public class SpringAdminApplication {

	public static void main(String[] args) {
		SpringApplication.run(SpringAdminApplication.class, args);
	}

}
客户端
1.pom
<dependency>
            <groupId>de.codecentric</groupId>
            <artifactId>spring-boot-admin-starter-client</artifactId>
            <version>2.2.0</version>
        </dependency>
2.application.yml
暴露了访问端点,配置了服务的日志位置,监控时读取
management:
  endpoints:
    web:
      exposure:
        include: "*"
  endpoint:
    metrics:
      enabled: true
    health:
      show-details: ALWAYS

logging:
  file: /usr/local/logs/${spring.application.name}/info/info.log
3.启动类
@SpringBootApplication
@EnableEurekaClient
public class TestApp{
    public static void main(String[] args) {
        SpringApplication.run(TestApp.class, args);
    }
}
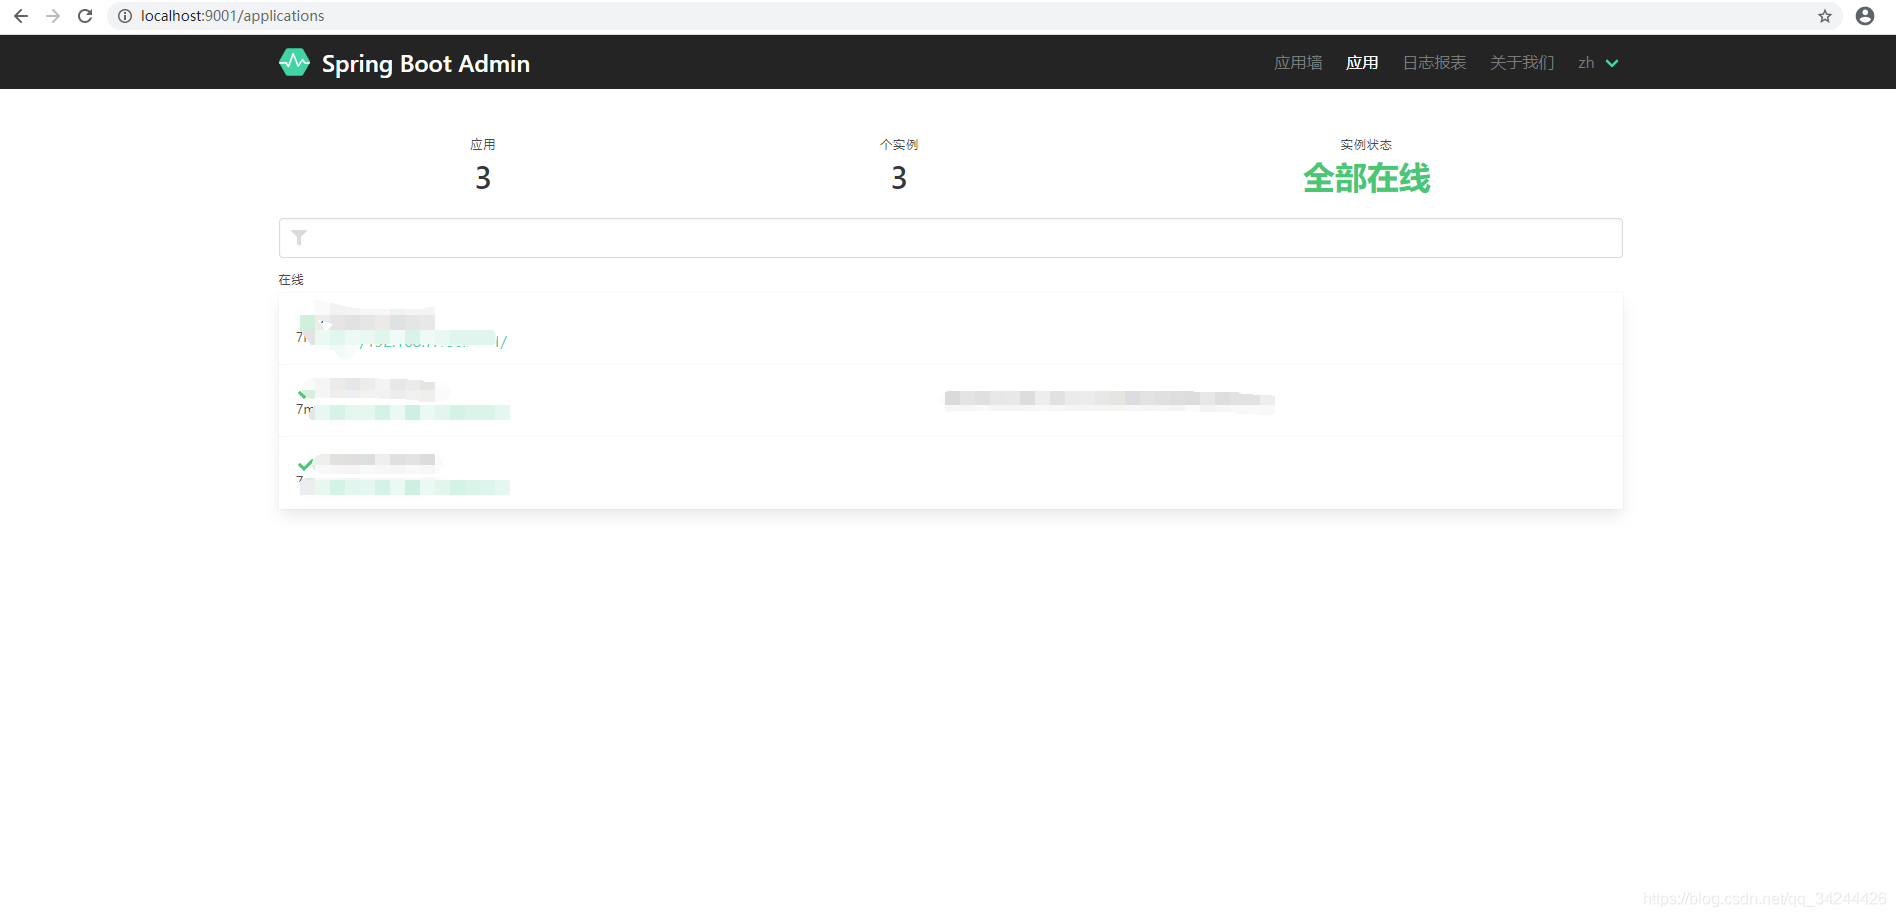
访问admin-server的ip地址端口,即可出现监控界面
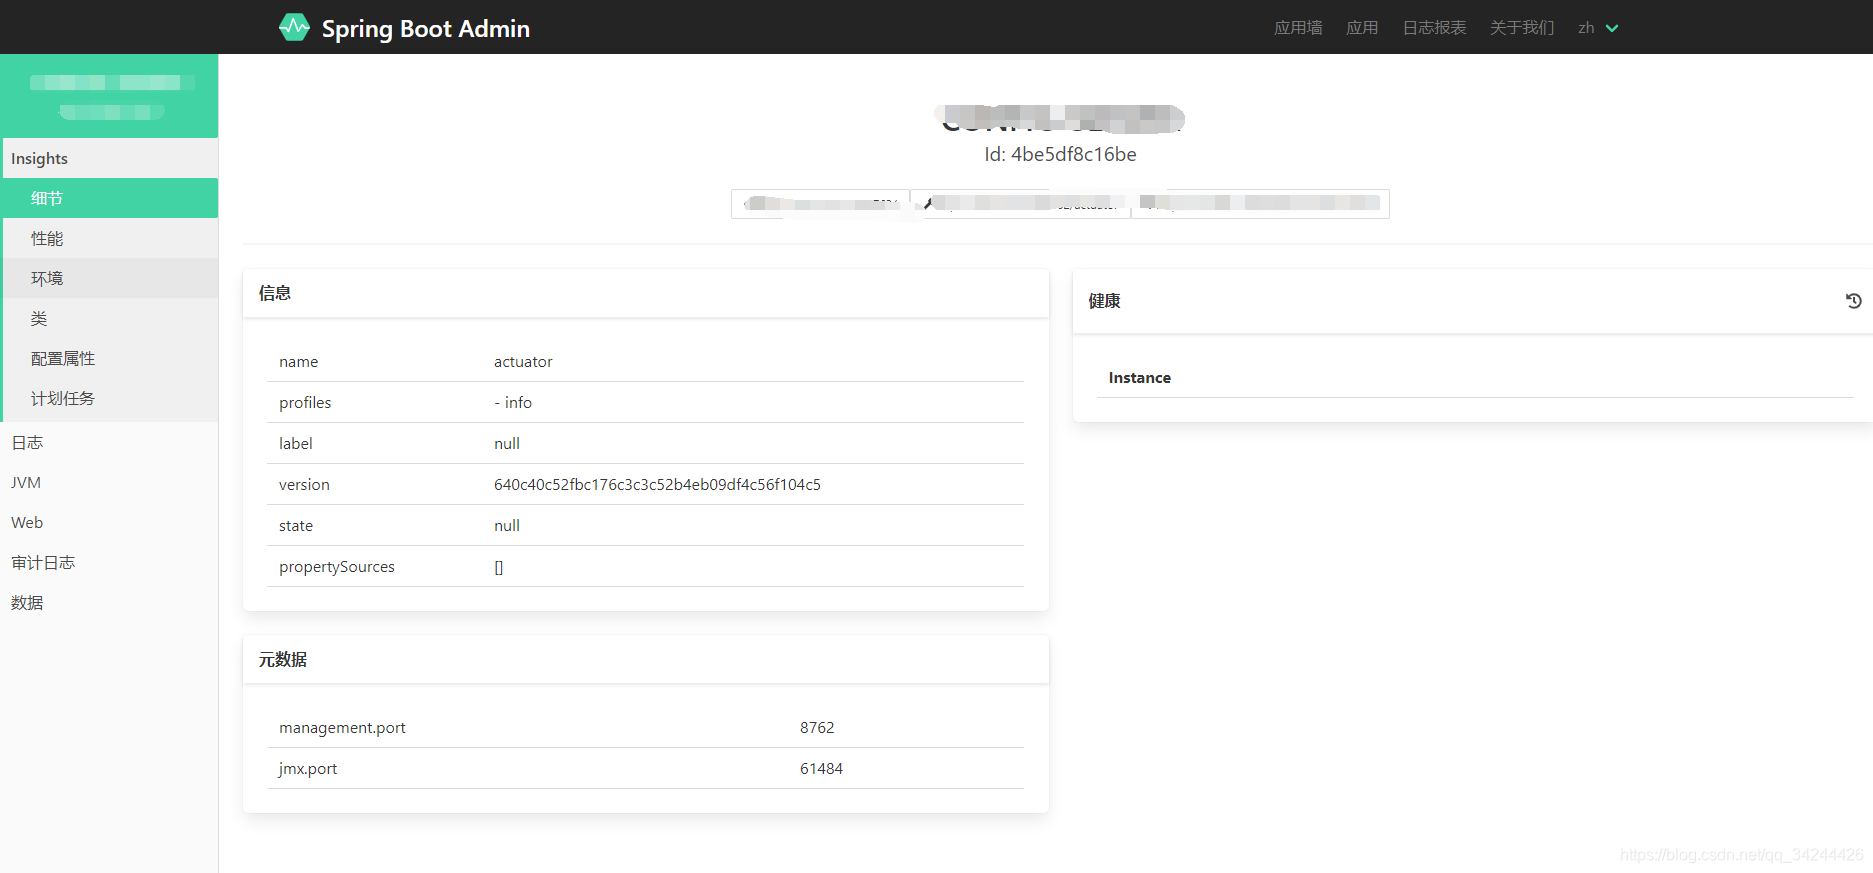
点击某个服务就可以查看具体信息,中文界面方便理解。可以查看内存,环境配置,日志,或修改日志级别,http请求等等
注意事项:
无法监控到admin client的数据,可能的原因有:
权限模块添加了依赖
<dependency>
            <groupId>org.springframework.cloud</groupId>
            <artifactId>spring-cloud-starter-oauth2</artifactId>
        </dependency>
        <dependency>
            <groupId>org.springframework.cloud</groupId>
            <artifactId>spring-cloud-starter-security</artifactId>
        </dependency>
这个两个依赖都是默认关闭访问端点的,需要手动配置开启。
@Configuration
public static class SecurityPermitAllConfig extends WebSecurityConfigurerAdapter {
    @Override
    protected void configure(HttpSecurity http) throws Exception {
        http.authorizeRequests().anyRequest().permitAll()
            .and().csrf().disable();
    }
}
或者开启部分端点
    @Override
    protected void configure(HttpSecurity http) throws Exception {

        http
                .csrf().disable() //关闭CSRF
                .exceptionHandling()
                .authenticationEntryPoint((request, response, authException) -> response.sendError(HttpServletResponse.SC_UNAUTHORIZED))
                .and()
                .authorizeRequests()
                .antMatchers("/instances", "/instances/*", "/actuator/**").permitAll()
                .antMatchers("/**").authenticated()
                .and()
                .httpBasic();
    }
整个流程写的比较简单,适合有基础的人,在这里也是做一个笔记


 221
221


 被折叠的 条评论
为什么被折叠?
被折叠的 条评论
为什么被折叠?
 到【灌水乐园】发言


