


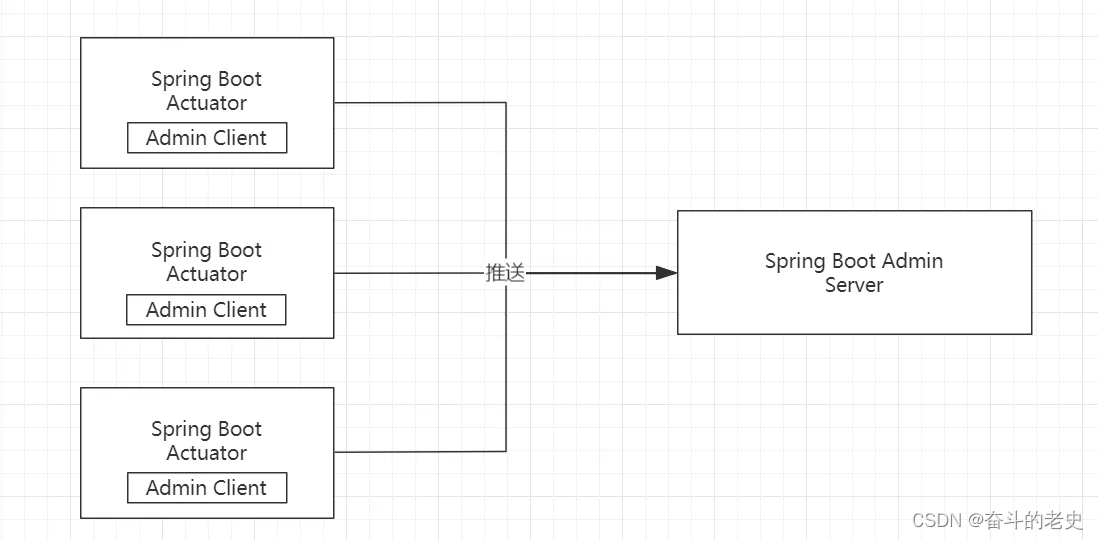
Spring-Boot-Admin介绍
Github: https://github.com/codecentric/spring-boot-admin
文档: https://codecentric.github.io/spring-boot-admin/2.3.1/
Spring Boot Admin provides the following features for registered applications:
Show health status
Show details, like
JVM & memory metrics
micrometer.io metrics
Datasource metrics
Cache metrics
Show build-info number
Follow and download logfile
View jvm system- & environment-properties
View Spring Boot Configuration Properties
Support for Spring Cloud’s postable /env- &/refresh-endpoint
Easy loglevel management
Interact with JMX-beans
View thread dump
View http-traces
View auditevents
View http-endpoints
View scheduled tasks
View and delete active sessions (using spring-session)
View Flyway / Liquibase database migrations
Download heapdump
Notification on status change (via e-mail, Slack, Hipchat, …)
Event journal of status changes (non persistent)
开发步骤
服务器端
第一步,新建项目,增加依赖spring-boot-admin-starter-server
pom.xml
<dependency>
    <groupId>de.codecentric</groupId>
    <artifactId>spring-boot-admin-starter-server</artifactId>
    <version>2.3.1</version>
</dependency>
<dependency>
    <groupId>org.springframework.boot</groupId>
    <artifactId>spring-boot-starter-web</artifactId>
</dependency>
第二步,在@Configuration类或者主类上增加@EnableAdminServer启动服务器
package com.itlaoqi.springbootadminserver;

import de.codecentric.boot.admin.server.config.EnableAdminServer;
import org.springframework.boot.SpringApplication;
import org.springframework.boot.autoconfigure.SpringBootApplication;

@SpringBootApplication
@EnableAdminServer
public class SpringbootAdminServerApplication {

    public static void main(String[] args) {
        SpringApplication.run(SpringbootAdminServerApplication.class, args);
    }

}
第三步,在application.properties设置端口
server.port=9000
客户端接入
第一步,在Spring Boot应用上增加spring-boot-admin-starter-client依赖
<dependency>
    <groupId>de.codecentric</groupId>
    <artifactId>spring-boot-admin-starter-client</artifactId>
    <version>2.3.1</version>
</dependency>
第二步,开启指标监控,并接入admin-server
spring:
  boot:
    admin:
      client:
        url: http://192.168.31.106:9000 #服务器地址
        instance:
          prefer-ip: true #基于IP进行注册
server:
  port: 8000
  servlet:
    context-path: /
management:
  endpoints:
    enabled-by-default: true #开启所有监控端点
    web:
      exposure:
        include: '*'
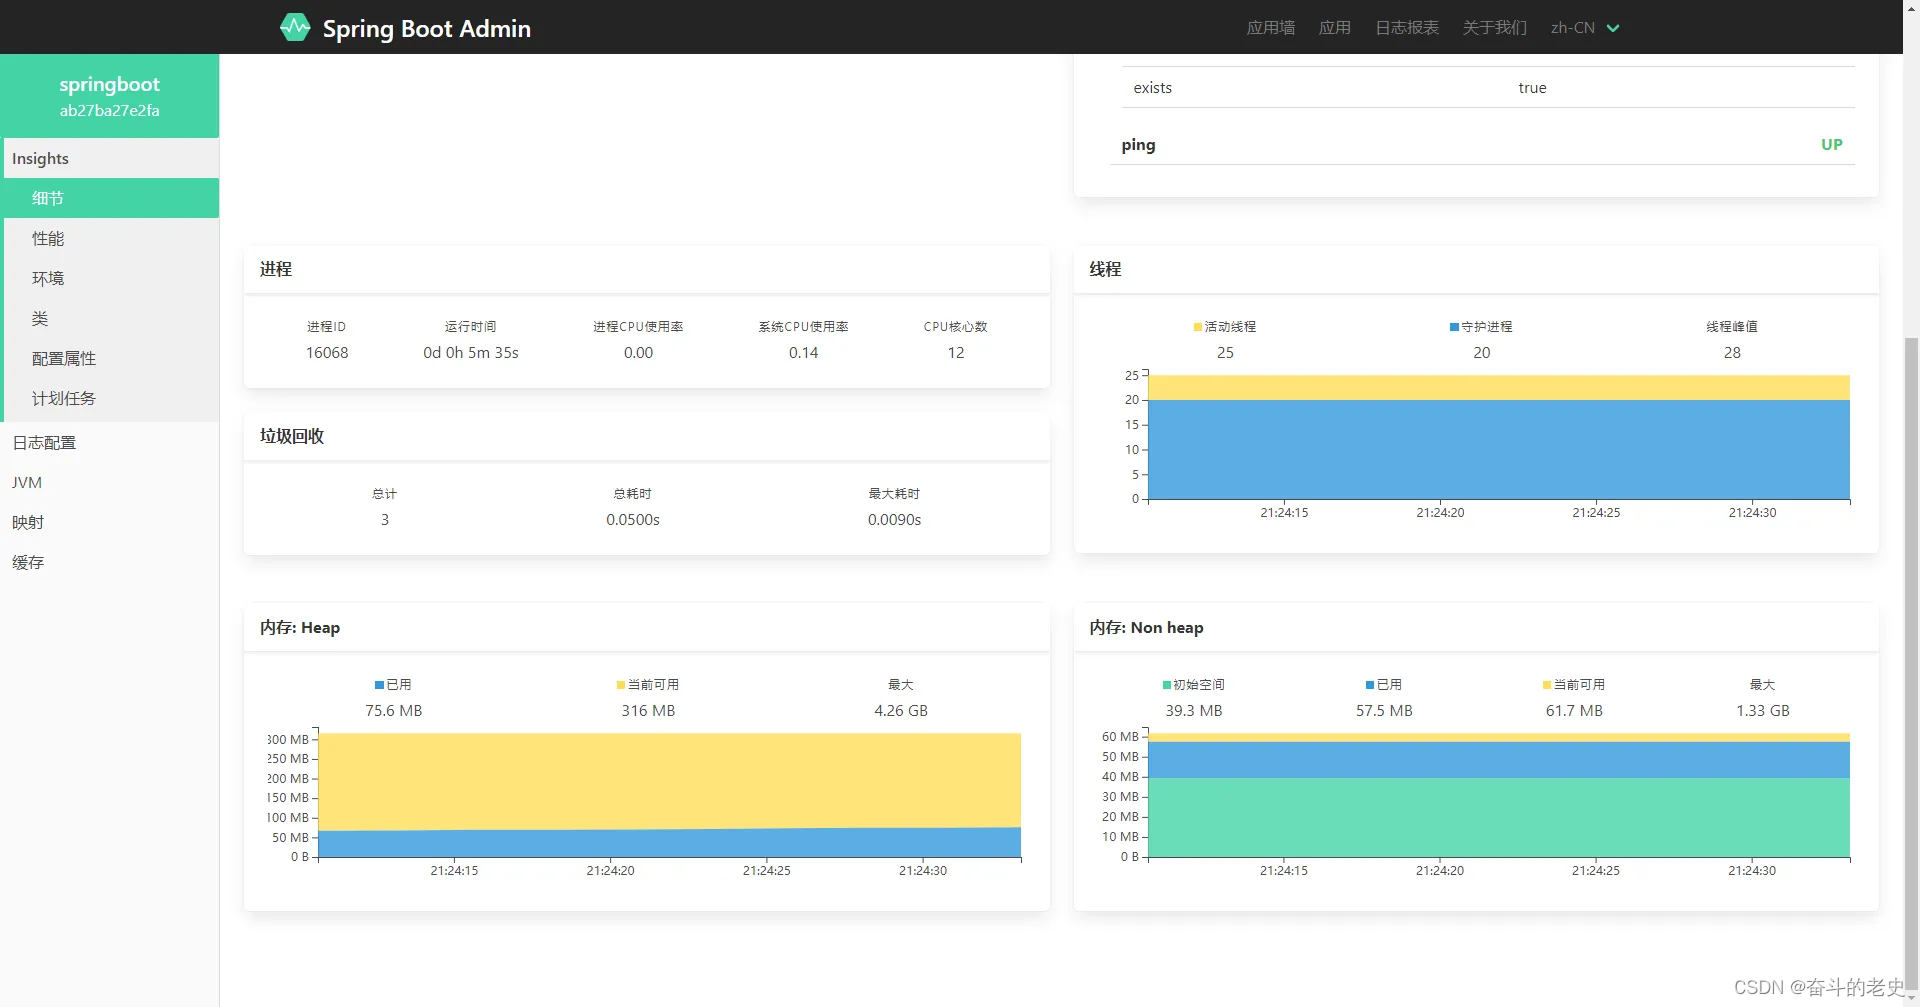
第三步,访问http://localhost:9000查看Admin-Server监控


 1536
1536

 被折叠的 条评论
为什么被折叠?
被折叠的 条评论
为什么被折叠?
 到【灌水乐园】发言


