


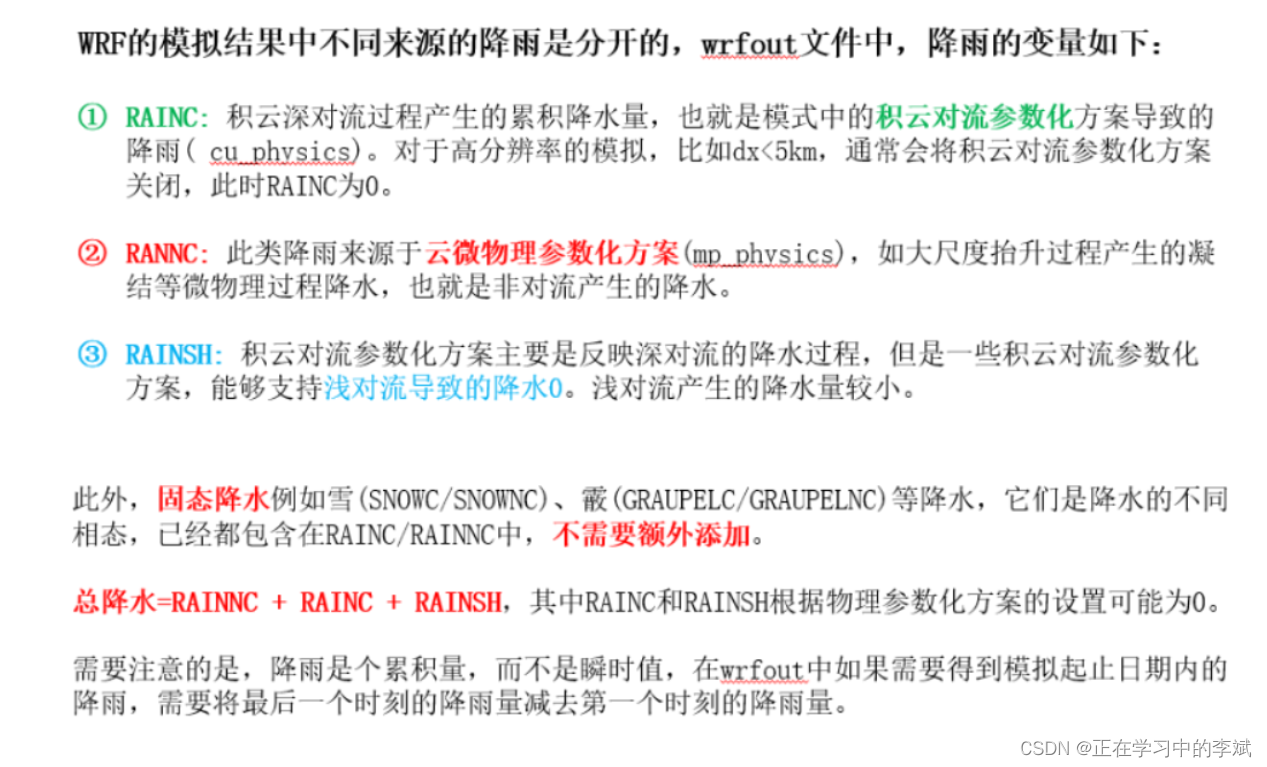
1. 背景介绍
2. 导库
import numpy as np
import xarray as xr
import matplotlib.pyplot as plt
from matplotlib.cm import get_cmap
import cartopy.crs as ccrs
import cartopy.feature as cfeat
import cartopy.io.shapereader as shpreader
import shapefile
from cartopy.mpl.gridliner import LONGITUDE_FORMATTER, LATITUDE_FORMATTER
import matplotlib.ticker as mticker
from netCDF4 import Dataset
from wrf import to_np, getvar, interplevel, ALL_TIMES, latlon_coords, get_cartopy
import warnings
warnings.filterwarnings('ignore')
3. 准备工作: 兰伯特刻度线补丁子程序
from copy import copy
import numpy as np
import shapely.geometry as sgeom
import cartopy.crs as ccrs

def find_side(ls, side):
    """
    Given a shapely LineString which is assumed to be rectangular, return the
    line corresponding to a given side of the rectangle.

    """
    minx, miny, maxx, maxy = ls.bounds
    points = {'left': [(minx, miny), (minx, maxy)],
              'right': [(maxx, miny), (maxx, maxy)],
              'bottom': [(minx, miny), (maxx, miny)],
              'top': [(minx, maxy), (maxx, maxy)],}
    return sgeom.LineString(points[side])

def lambert_xticks(ax, ticks):
    """Draw ticks on the bottom x-axis of a Lambert Conformal projection."""
    te = lambda xy: xy[0]
    lc = lambda t, n, b: np.vstack((np.zeros(n) + t, np.linspace(b[2], b[3], n))).T
    xticks, xticklabels = _lambert_ticks(ax, ticks, 'bottom', lc, te)
    ax.xaxis.tick_bottom()
    ax.set_xticks(xticks)
    ax.set_xticklabels([ax.xaxis.get_major_formatter()(xtick) for xtick in xticklabels])

def lambert_yticks(ax, ticks):
    """Draw ticks on the left y-axis of a Lamber Conformal projection."""
    te = lambda xy: xy[1]
    lc = lambda t, n, b: np.vstack((np.linspace(b[0], b[1], n), np.zeros(n) + t)).T
    yticks, yticklabels = _lambert_ticks(ax, ticks, 'left', lc, te)
    ax.yaxis.tick_left()
    ax.set_yticks(yticks)
    ax.set_yticklabels([ax.yaxis.get_major_formatter()(ytick) for ytick in yticklabels])

def _lambert_ticks(ax, ticks, tick_location, line_constructor, tick_extractor):
    """Get the tick locations and labels for an axis of a Lambert Conformal projection."""
    outline_patch = sgeom.LineString(ax.outline_patch.get_path().vertices.tolist())
    axis = find_side(outline_patch, tick_location)
    n_steps = 30
    extent = ax.get_extent(ccrs.PlateCarree())
    _ticks = []
    for t in ticks:
        xy = line_constructor(t, n_steps, extent)
        proj_xyz = ax.projection.transform_points(ccrs.Geodetic(), xy[:, 0], xy[:, 1])
        xyt = proj_xyz[..., :2]
        ls = sgeom.LineString(xyt.tolist())
        locs = axis.intersection(ls)
        if not locs:
            tick = [None]
        else:
            tick = tick_extractor(locs.xy)
        _ticks.append(tick[0])
    # Remove ticks that aren't visible:
    ticklabels = copy(ticks)
    while True:
        try:
            index = _ticks.index(None)
        except ValueError:
            break
        _ticks.pop(index)
        ticklabels.pop(index)
    return _ticks, ticklabels
4. 读取变量
wrfout_dir = "./data/wrfout_d02_2017-08-22_12"
wrfout      = Dataset(wrfout_dir, mode="r")


# 读取变量
times  = getvar(wrfout, "times", meta=False, timeidx=ALL_TIMES)
rainnc  = getvar(wrfout, "RAINNC", timeidx=ALL_TIMES) # mp_physics
rainc   = getvar(wrfout, "RAINC", timeidx=ALL_TIMES)  # cu_physics
rainsh  = getvar(wrfout, "RAINSH", timeidx=ALL_TIMES) # shcu_physics
rain_tot = rainnc + rainc + rainsh  # 总降水

it1 = 12 # 2017-08-23T00:00:00
it2 = 36 # 2017-08-24T00:00:00
rain_acc = rain_tot[it2] - rain_tot[it1]
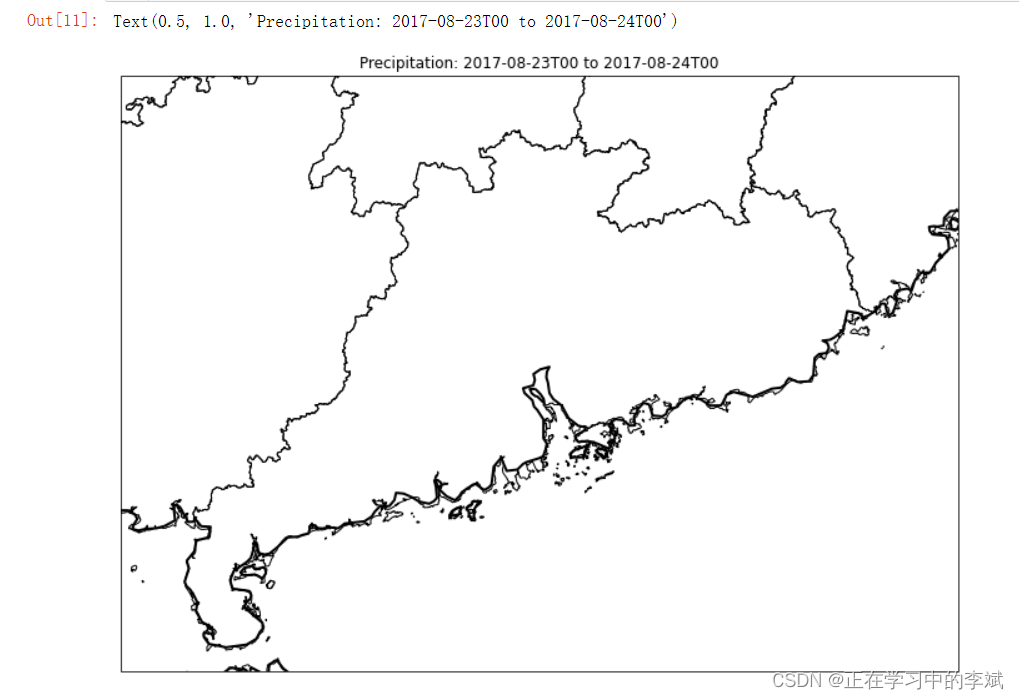
5. 基础图形绘制
lats, lons = latlon_coords(rainnc)
wrf_proj = get_cartopy(rainnc)
fig = plt.figure(figsize=(12,10))
lon_max = 118 #int(np.max(lons))
lon_min = 109 #int(np.min(lons))
lat_max = 26  #int(np.max(lats))
lat_min = 20  #int(np.min(lats))
ax  = plt.axes(projection=wrf_proj)
ax.set_extent([lon_min, lon_max, lat_min, lat_max])

#增加省级行政线和海岸线
province  = shpreader.Reader('./data/china_shp/province.shp').geometries()
ax.add_geometries(province, ccrs.PlateCarree(), facecolor='none', edgecolor='black', zorder=10)
ax.coastlines('50m', linewidth=2.0, edgecolor="black",zorder=10)

plt.title('Precipitation: ' + str(times[it1])[:13] + ' to ' + str(times[it2])[:13])
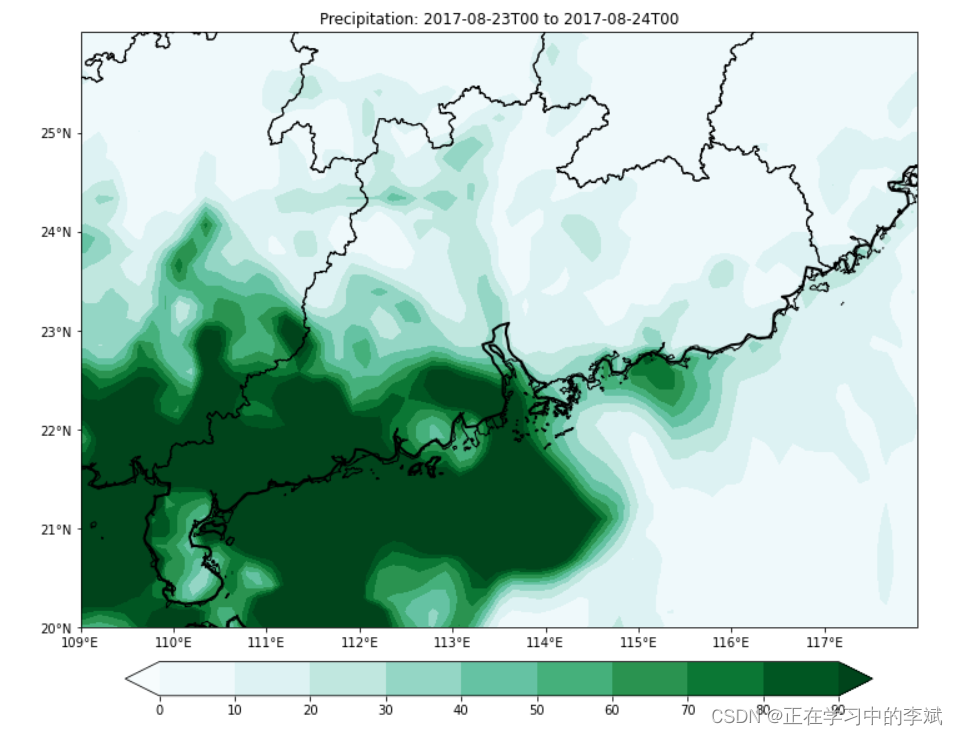
6. 降雨填色图绘制
lats, lons = latlon_coords(rainnc)
wrf_proj = get_cartopy(rainnc)
fig = plt.figure(figsize=(12,10))
lon_max = 118 #int(np.max(lons))
lon_min = 109 #int(np.min(lons))
lat_max = 26  #int(np.max(lats))
lat_min = 20  #int(np.min(lats))
ax  = plt.axes(projection=wrf_proj)
ax.set_extent([lon_min, lon_max, lat_min, lat_max])


#增加省级行政线和海岸线
province  = shpreader.Reader('./data/china_shp/province.shp').geometries()
ax.add_geometries(province, ccrs.PlateCarree(), facecolor='none', edgecolor='black', zorder=10)
ax.coastlines('50m', linewidth=2.0, edgecolor="black",zorder=10)


plt.title('Precipitation: ' + str(times[it1])[:13] + ' to ' + str(times[it2])[:13])


levels = np.arange(0, 100, 10)
cts = plt.contourf(lons, lats, rain_acc,
                   levels=levels,
                   transform=ccrs.PlateCarree(),
                   cmap=get_cmap("BuGn"), # rianbow, BuGn
                   zorder=1, #图层顺序
                   extend='both') # extend 色带两端是否带箭头
plt.colorbar(cts, ax=ax, orientation="horizontal", pad=.05, fraction=0.05)

# must call draw in order to get the axis boundary used to add ticks:
fig.canvas.draw()
#网格线和经纬度
# Define gridline locations and draw the lines using cartopy's built-in gridliner:
xticks = list(np.arange(lon_min, lon_max, 1.)) #后续函数需要列表
yticks = list(np.arange(lat_min, lat_max, 1.))
#ax.gridlines(xlocs=xticks, ylocs=yticks)

# Label the end-points of the gridlines using the custom tick makers:
ax.xaxis.set_major_formatter(LONGITUDE_FORMATTER)
ax.yaxis.set_major_formatter(LATITUDE_FORMATTER)
# xticks and yticks only is list
lambert_xticks(ax, xticks)
lambert_yticks(ax, yticks)


plt.savefig('wrf_rain.png')
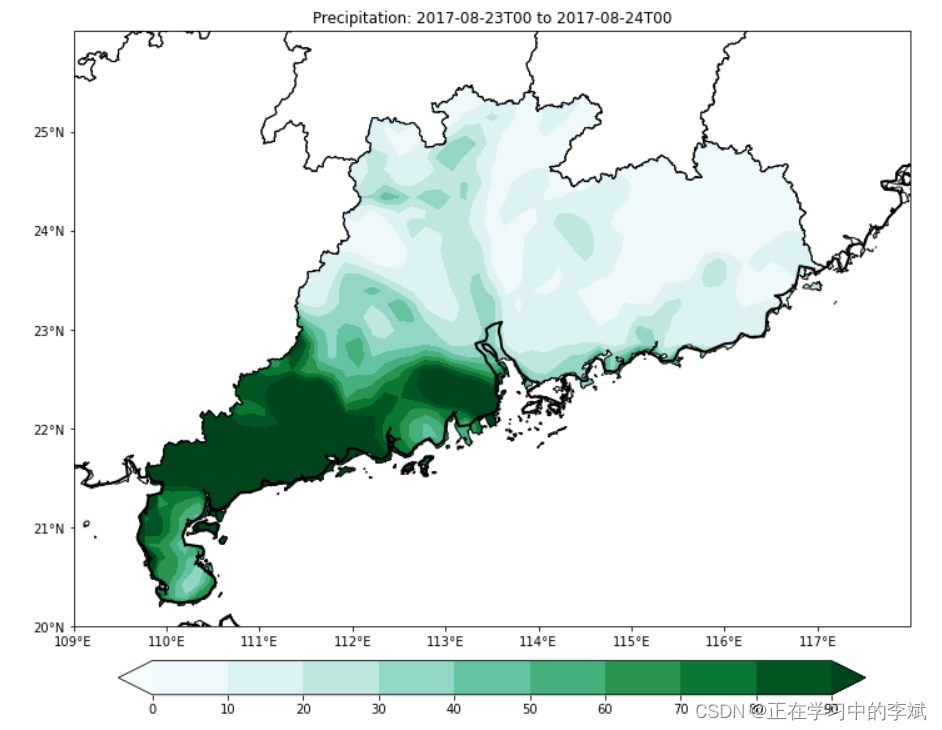
7. mask区域选取
(1)确定要绘制的区域,将该区域的point所围成的polygon多边形转换为matplotlib中的path。可以从shp文件中获取感兴趣的区域,例如某个省份。
(2)判断有哪些点落在这个path里。此处利用Path里的contains_point方法,得到一个在或不在区域内的bool型array。
(3)利用上一步的array,将区域外的降水量(或者其他变量)的值转化为np.nan。结合np.nanmean方法可以排除np.nan值,从而直接计算降水量(或者其他变量)的简单面积均值。
shpfile = './data/china_shp/province.shp'
sf = shapefile.Reader(shpfile)
##############################################################################
#   This module enable you to maskout the unneccessary data outside          #
#            the interest region on a matplotlib-plotted output.             #
#   You can use this script for free                                         #
##############################################################################
#     INPUT:                                                                 #
#           'fig'      :  the map                                            #
#           'ax'       :  the Axes instance                                  #
#           'shpfile'  :  the border file                                    #
#                             outside the region the data is to be maskout   #
#           'clabel': clabel instance  (optional)                            #
#           'vcplot': vector map       (optional)                            #
#     OUTPUT:                                                                #
#           'clip'            :the masked-out map.                           #
##############################################################################

import shapefile
import cartopy.crs as ccrs
from matplotlib.path import Path
from matplotlib.patches import PathPatch
from shapely.geometry import Point as ShapelyPoint
from shapely.geometry import Polygon as ShapelyPolygon
from collections import Iterable

def shp2clip(fig, ax, shpfile, target_region, proj=None, clabel=None,vcplot=None):
    sf = shapefile.Reader(shpfile)
    vertices = []
    codes = []
    for shape_rec in sf.shapeRecords():
        if shape_rec.record[1] in target_region:
           pts = shape_rec.shape.points
           prt = list(shape_rec.shape.parts) + [len(pts)]
           for i in range(len(prt) - 1):
               for j in range(prt[i], prt[i+1]):
                   if proj:
                       vertices.append(proj.transform_point(pts[j][0], pts[j][1], ccrs.Geodetic()))
                   else:
                       vertices.append((pts[j][0], pts[j][1]))
               codes += [Path.MOVETO]
               codes += [Path.LINETO] * (prt[i+1] - prt[i] -2)
               codes += [Path.CLOSEPOLY]
           clip = Path(vertices, codes)
           clip = PathPatch(clip, transform=ax.transData)

    if vcplot:
        if isinstance(fig,Iterable):
            for ivec in fig:
                ivec.set_clip_path(clip)
        else:
            fig.set_clip_path(clip)
    else:
        for contour in fig.collections:
            contour.set_clip_path(clip)

    if  clabel:
        clip_map_shapely = ShapelyPolygon(vertices)
        for text_object in clabel:
            if not clip_map_shapely.contains(ShapelyPoint(text_object.get_position())):
                text_object.set_visible(False)

    return clip

lats, lons = latlon_coords(rainnc)
wrf_proj = get_cartopy(rainnc)
fig = plt.figure(figsize=(12,10))
lon_max = 118 #int(np.max(lons))
lon_min = 109 #int(np.min(lons))
lat_max = 26  #int(np.max(lats))
lat_min = 20  #int(np.min(lats))
ax  = plt.axes(projection=wrf_proj)
ax.set_extent([lon_min, lon_max, lat_min, lat_max])


#增加省级行政线和海岸线
province  = shpreader.Reader('./data/china_shp/province.shp').geometries()
ax.add_geometries(province, ccrs.PlateCarree(), facecolor='none', edgecolor='black', zorder=10)
ax.coastlines('50m', linewidth=2.0, edgecolor="black",zorder=10)


plt.title('Precipitation: ' + str(times[it1])[:13] + ' to ' + str(times[it2])[:13])


levels = np.arange(0, 100, 10)
cts = plt.contourf(lons, lats, rain_acc,
                   levels=levels,
                   transform=ccrs.PlateCarree(),
                   cmap=get_cmap("BuGn"), # rianbow, BuGn
                   zorder=1, #图层顺序
                   extend='both')
plt.colorbar(cts, ax=ax, orientation="horizontal", pad=.05, fraction=0.05)

shp2clip(cts, ax, shpfile='./data/china_shp/province.shp', target_region=['广东省'], proj=wrf_proj, clabel=None, vcplot=None)

# must call draw in order to get the axis boundary used to add ticks:
fig.canvas.draw()
#网格线和经纬度
# Define gridline locations and draw the lines using cartopy's built-in gridliner:
xticks = list(np.arange(lon_min, lon_max, 1.)) #后续函数需要列表
yticks = list(np.arange(lat_min, lat_max, 1.))
#ax.gridlines(xlocs=xticks, ylocs=yticks)

# Label the end-points of the gridlines using the custom tick makers:
ax.xaxis.set_major_formatter(LONGITUDE_FORMATTER)
ax.yaxis.set_major_formatter(LATITUDE_FORMATTER)
# xticks and yticks only is list
lambert_xticks(ax, xticks)
lambert_yticks(ax, yticks)


plt.savefig('wrf_rain.png')


 699
699


 被折叠的 条评论
为什么被折叠?
被折叠的 条评论
为什么被折叠?
 到【灌水乐园】发言


