


 本文介绍如何使用Prometheus监控达梦数据库(Dem),包括配置Dem监控数据指标、修改Prometheus配置文件、重启Prometheus及连接校验过程,并指导如何在Grafana中绘制监控仪表盘。
20240725_已提供达梦数据库的go语言开发的exporter以及表盘,点击跳转
一、概括
- 本篇不涉及达梦数据库搭建以及Dem的搭建,操作环境需提前准备
- prometheus以及grafana的搭建,请跳转到前文查看
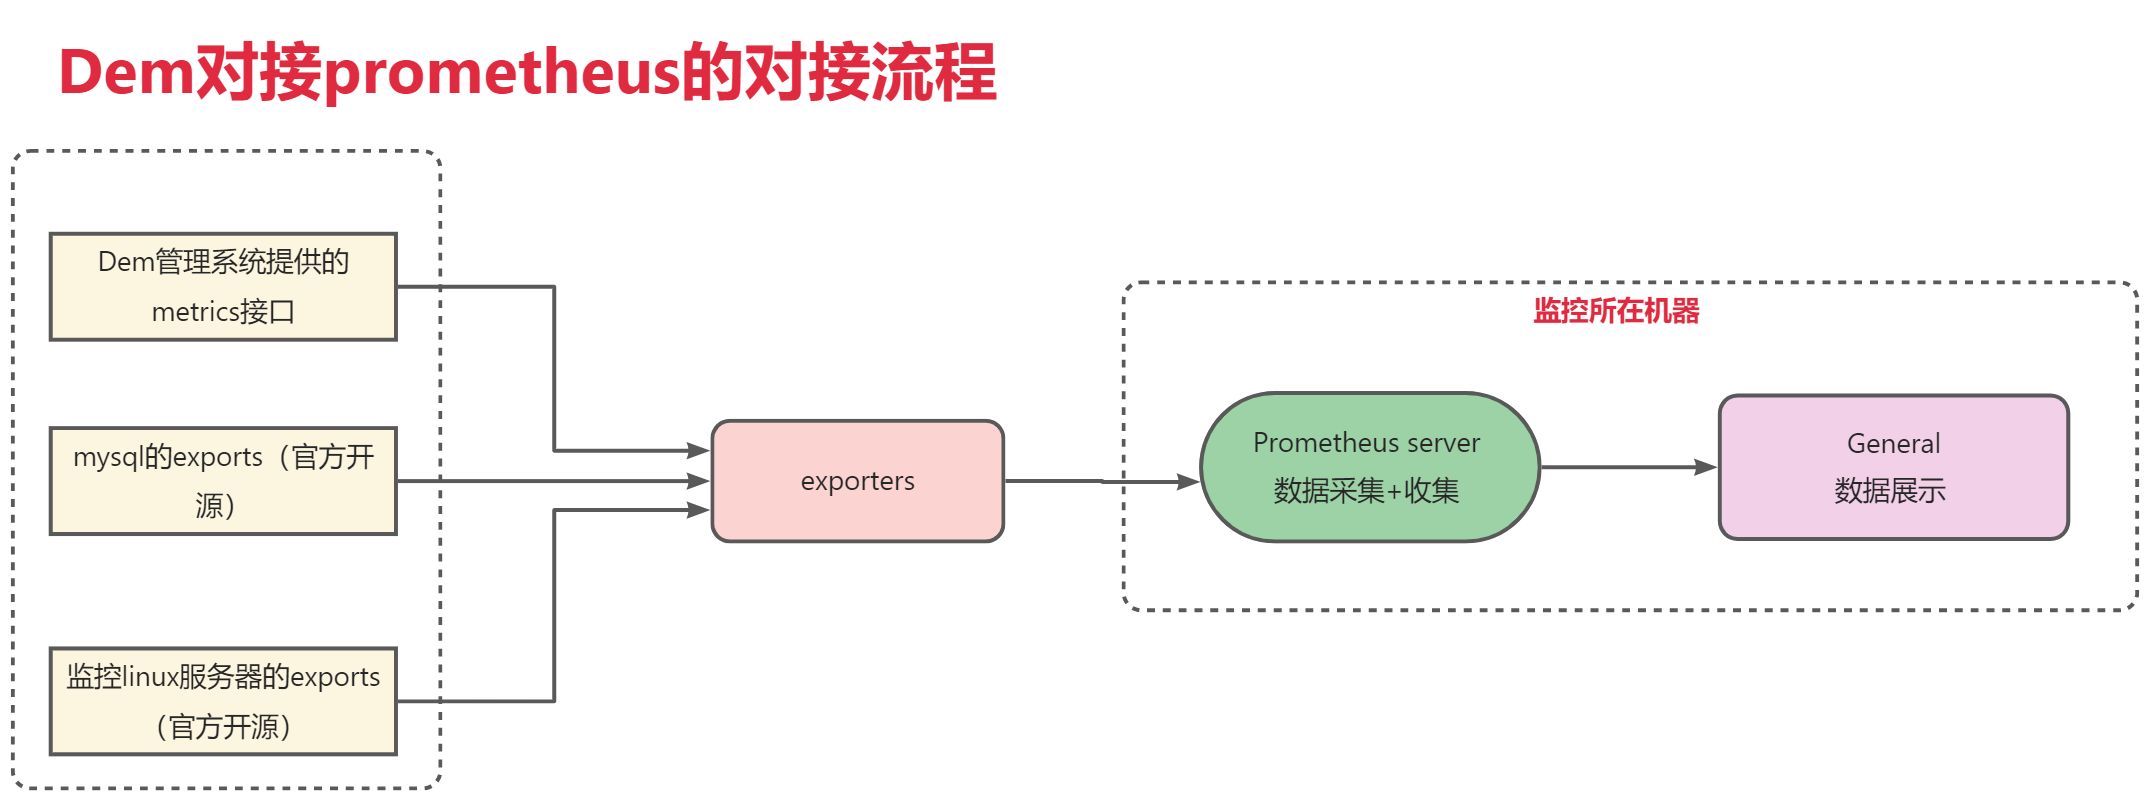
- 整体的对接流程如图所示
二、Dem对接prometheus
前提
需确保当前Dem,已有集群纳入监管
配置Dem的监控机器数据指标
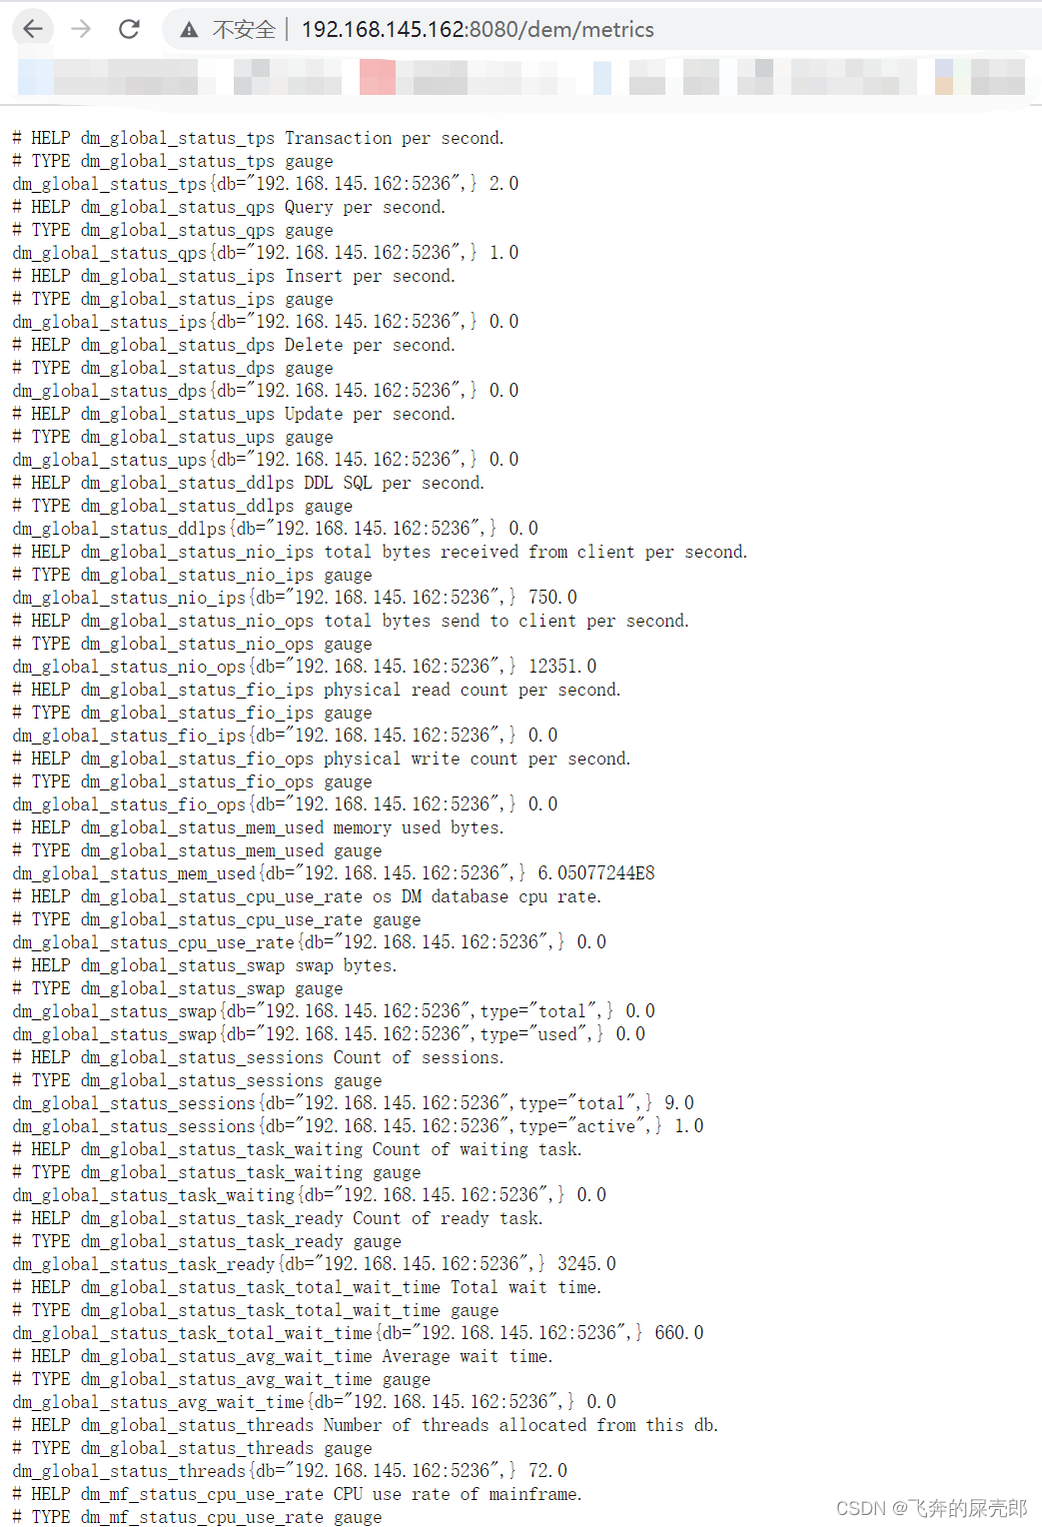
prometheus监控数据访问URL为:http://<dem_ip>:<dem_port>/dem/metrics。 消息返回格式符合prometheus的监控数据格式,
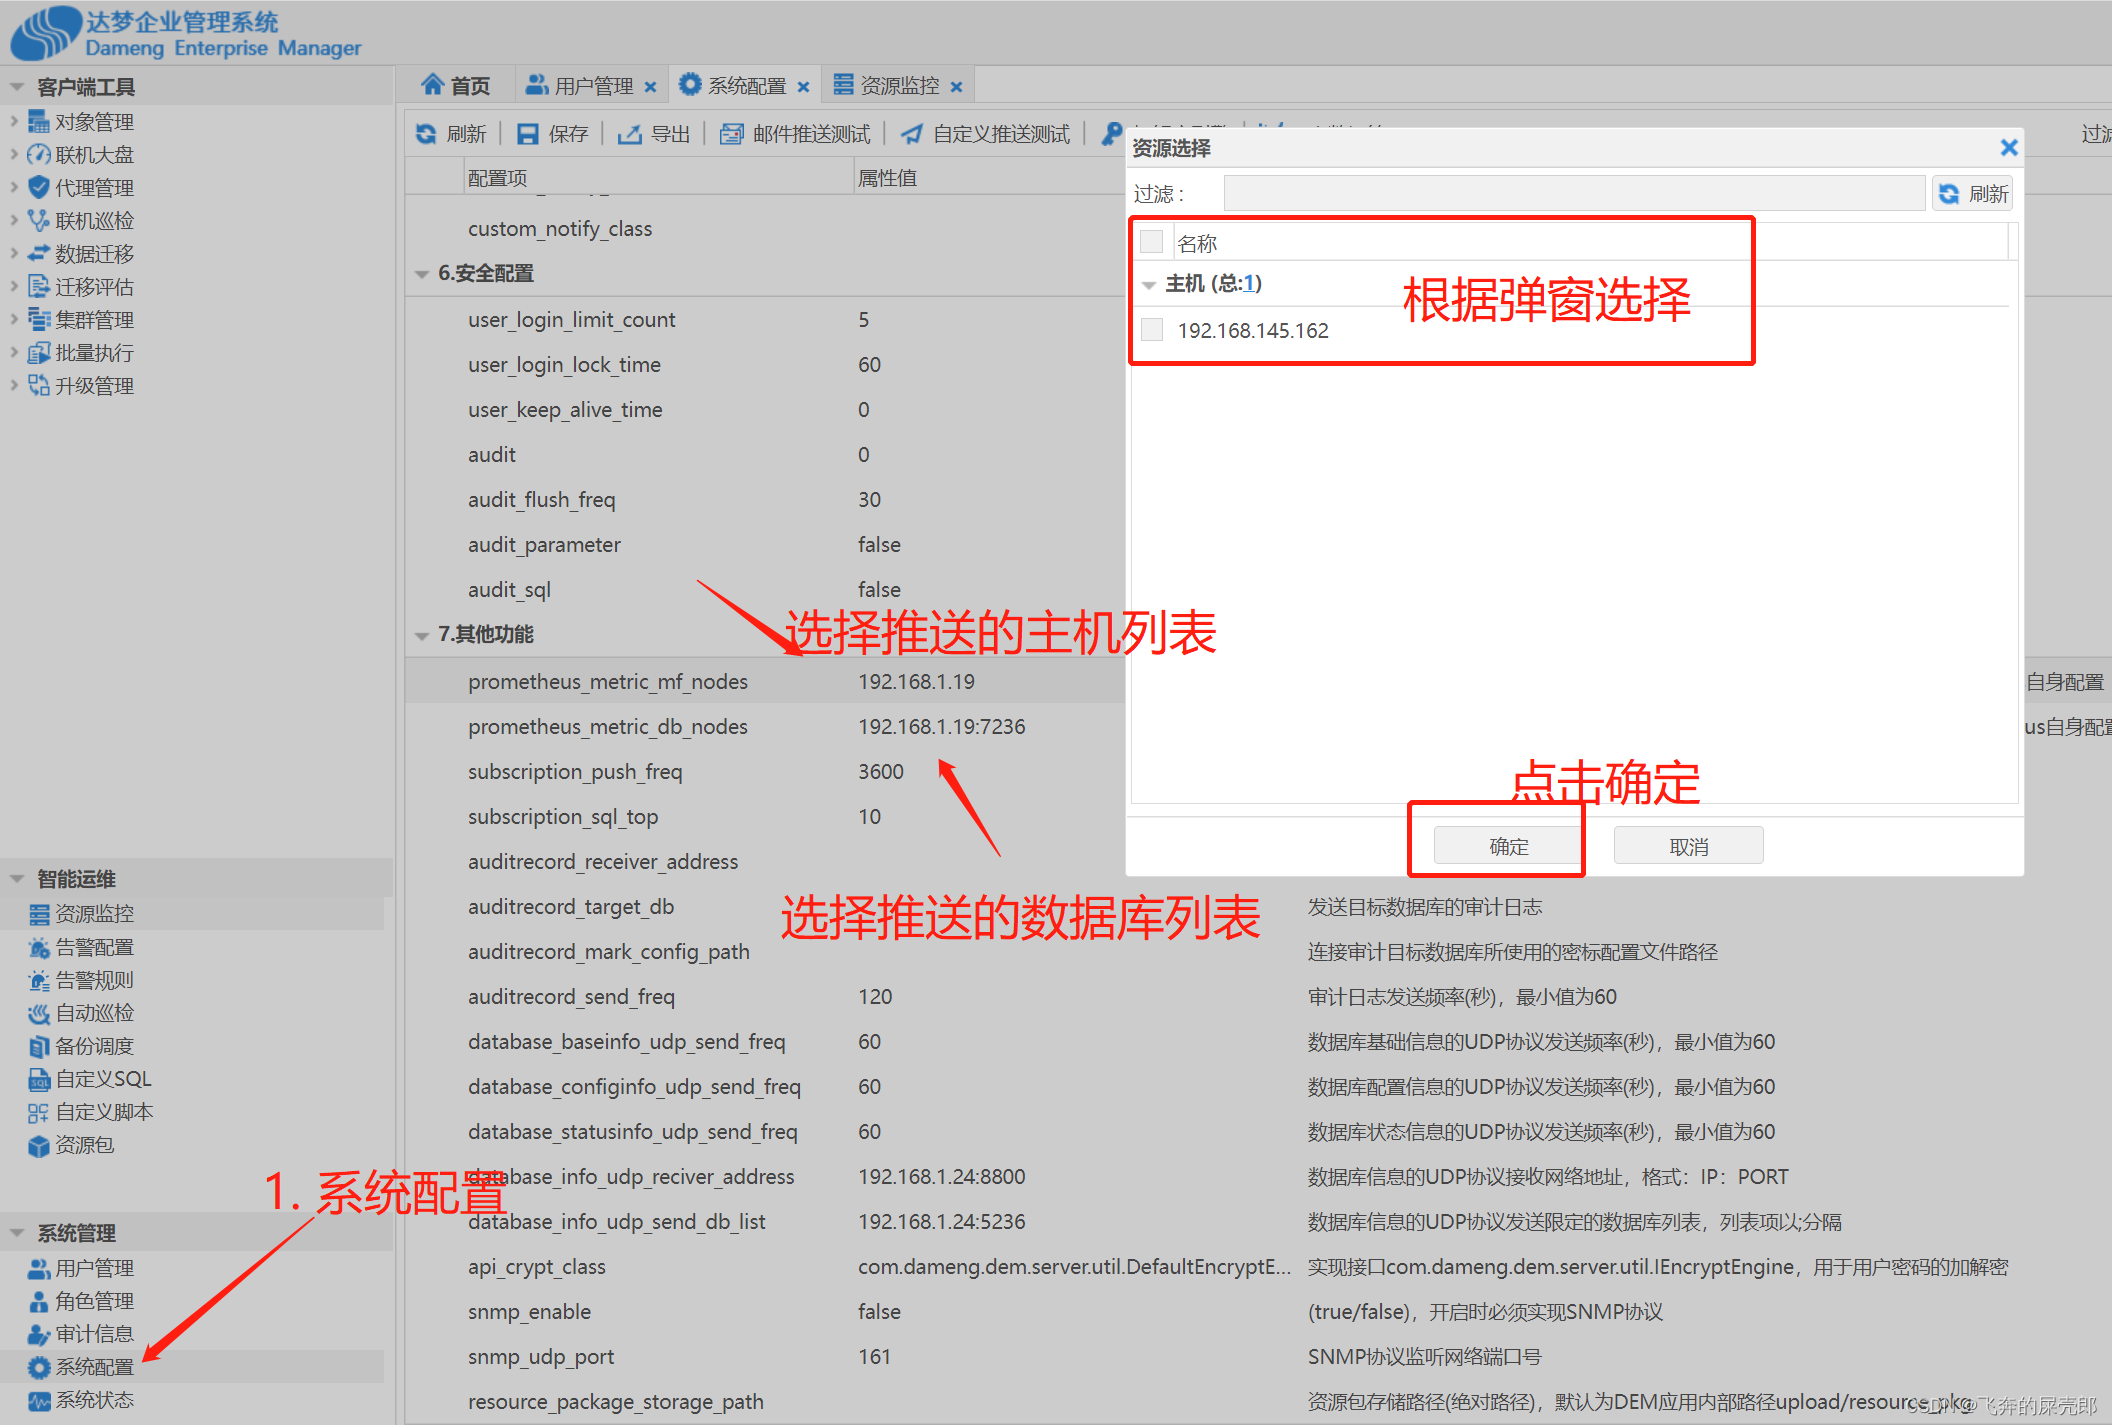
具体收集哪些主机和数据库的数据需要在 DEM 系统配置中设置。设置步骤为:
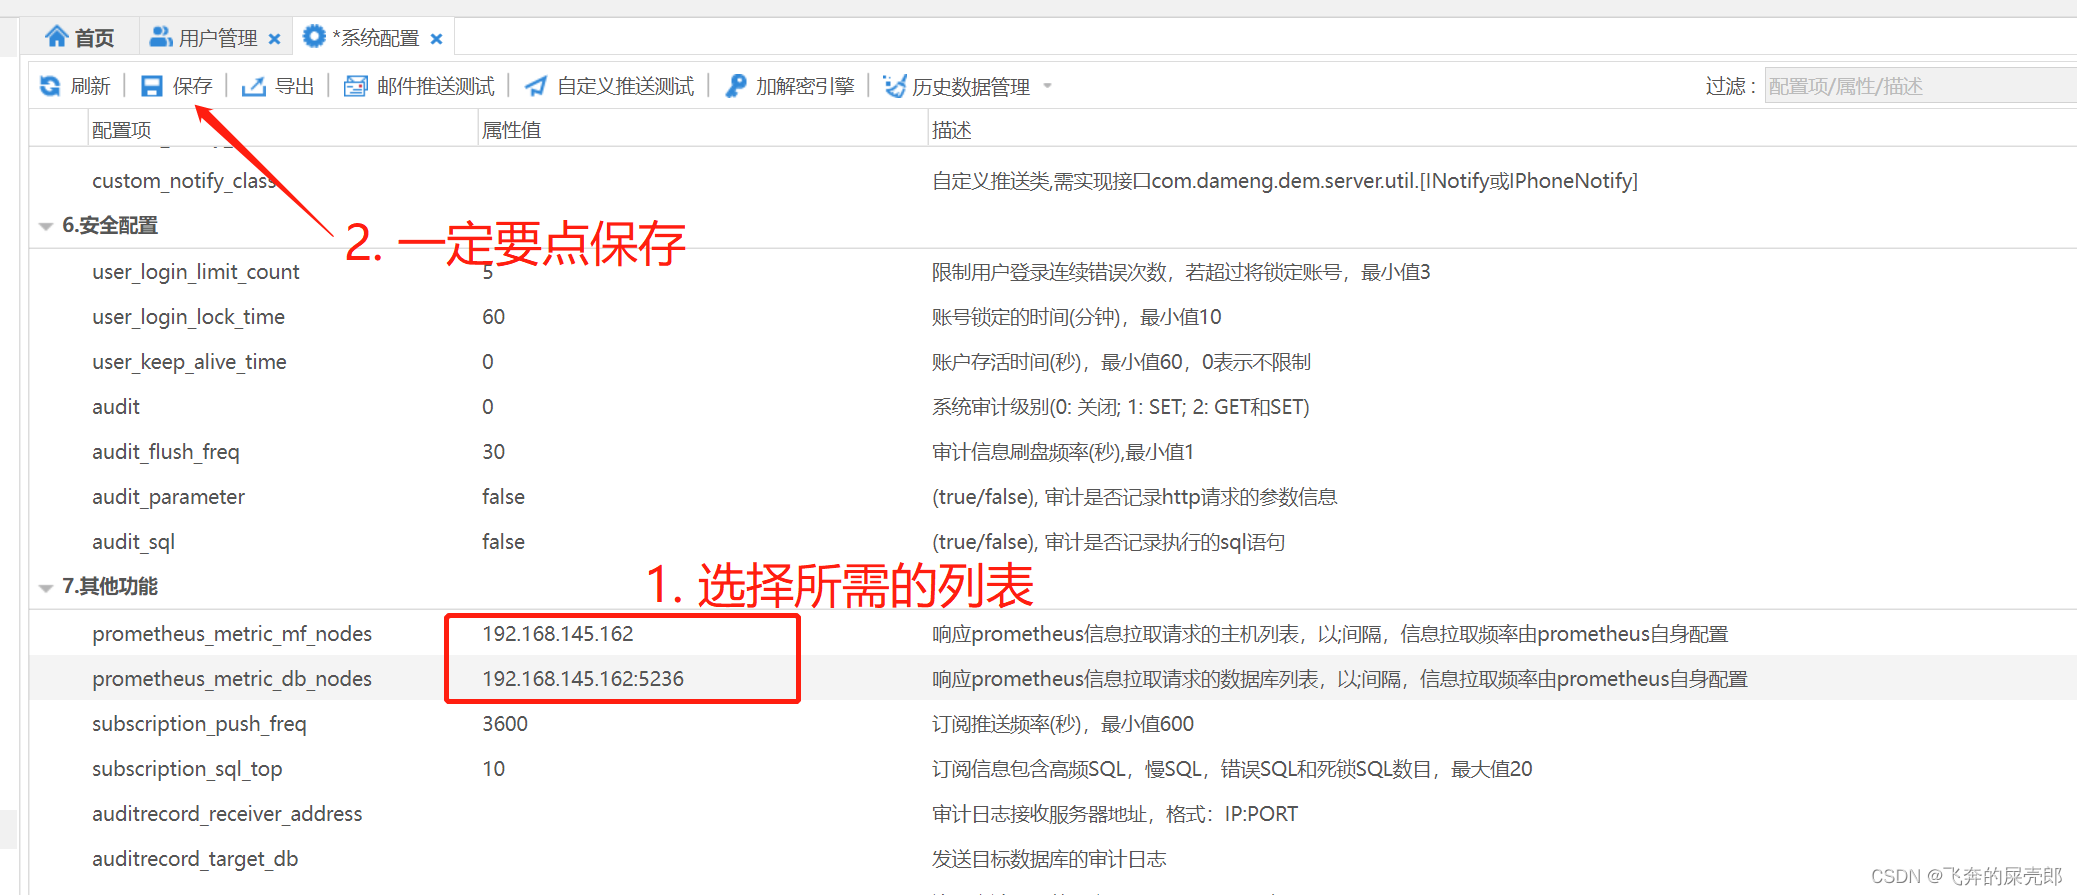
1.“系统配置”→“其他功能”→“prometheus_metric_mf_nodes”中设置主机列表。
2.“系统配置”→“其他功能”→“prometheus_metric_db_nodes”中设置数据库列表。
DEM 将根据此列表将相关主机和数据库的收集信息提供给 prometheus。
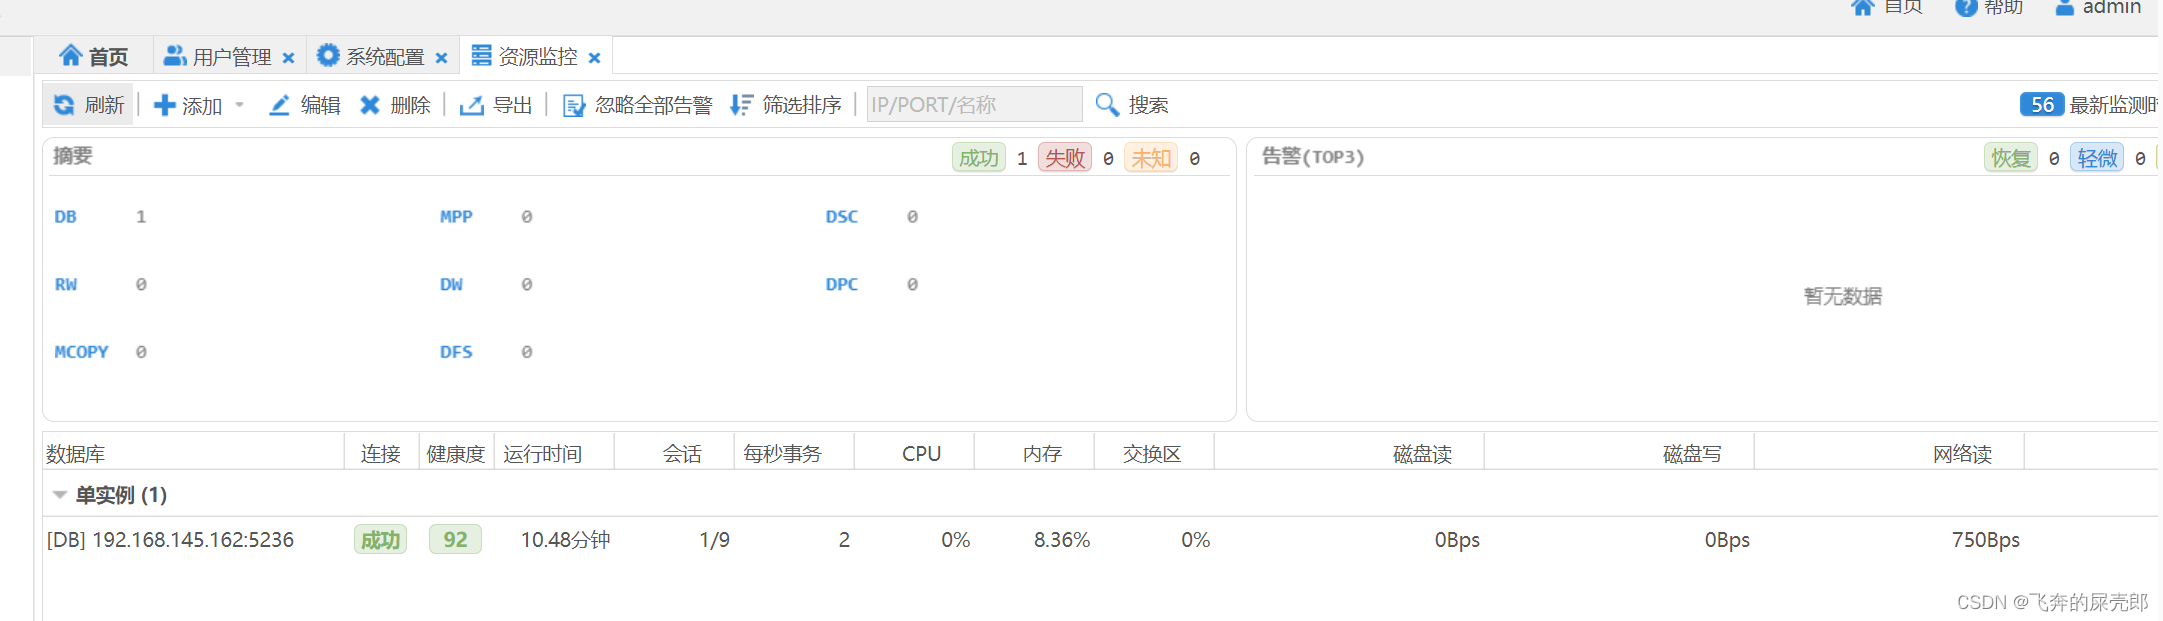
配置完了以后,等个5分钟左右访问
访问 URL 为:http://<dem_ip>:<dem_port>/dem/metrics。
- http://ip:8080/dem/metrics 能够看到解析信息
三、修改prometheus配置文件
## 1. 进入到prometheus目录
[root@localhost prometheus-2.40.5]# cd /opt/jiankong/prometheus-2.40.5
## 2. 编译prometheus.yml配置文件(添加上dem的拉取数据地址)
[root@VM-24-17-centos prometheus-2.35.0]# vim prometheus.yml

##yml格式 注意文件对齐方式
# A scrape configuration containing exactly one endpoint to scrape:
# Here it's Prometheus itself.
scrape_configs:
  # The job name is added as a label `job=<job_name>` to any timeseries scraped from this config.
  - job_name: "prometheus"
    # metrics_path defaults to '/metrics'
    # scheme defaults to 'http'.
    static_configs:
      - targets: ["localhost:9091"]
  - job_name: "dm_dem_node"
    metrics_path: "/dem/metrics"
    static_configs:
      - targets: ["192.168.145.162:8080"]

## 3.修改完成以后进行配置文件校验,避免因为空格等问题导致出错
[root@localhost prometheus-2.40.5]# ./promtool check config prometheus.yml
Checking prometheus.yml
 SUCCESS: prometheus.yml is valid prometheus config file syntax
四、重启prometheus并进行连接校验
## 4.重启prometheus
[root@localhost prometheus-2.40.5]# ps -ef|grep prometheus
root 30944 1 0 13:09 ? 00:00:06 /opt/jiankong/prometheus-2.40.5/prometheus
[root@localhost prometheus-2.40.5]# kill -9 30944
[root@localhost prometheus-2.40.5]# nohup ./prometheus --config.file="prometheus.yml" --web.listen-address="0.0.0.0:9091" > ./prometheus.log 2>&1 &
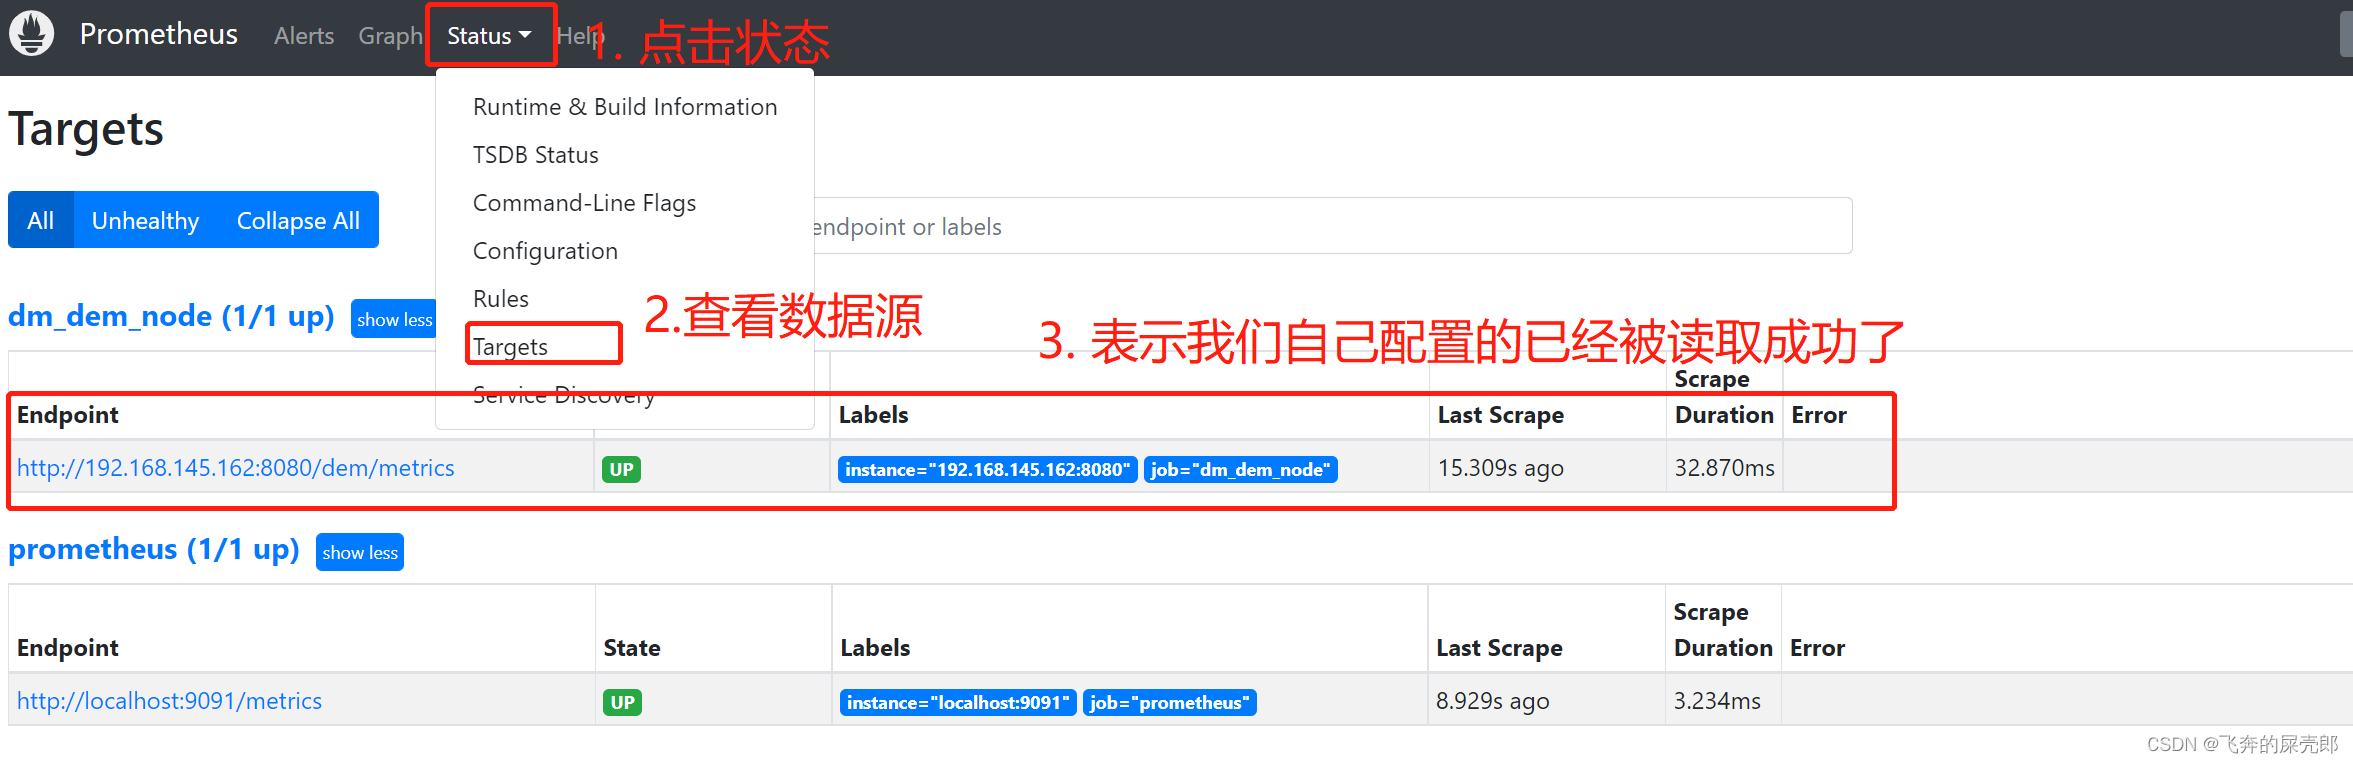
## 5.访问prometheus,查看是否数据拉取成功
http://101.42.236.144:9090/
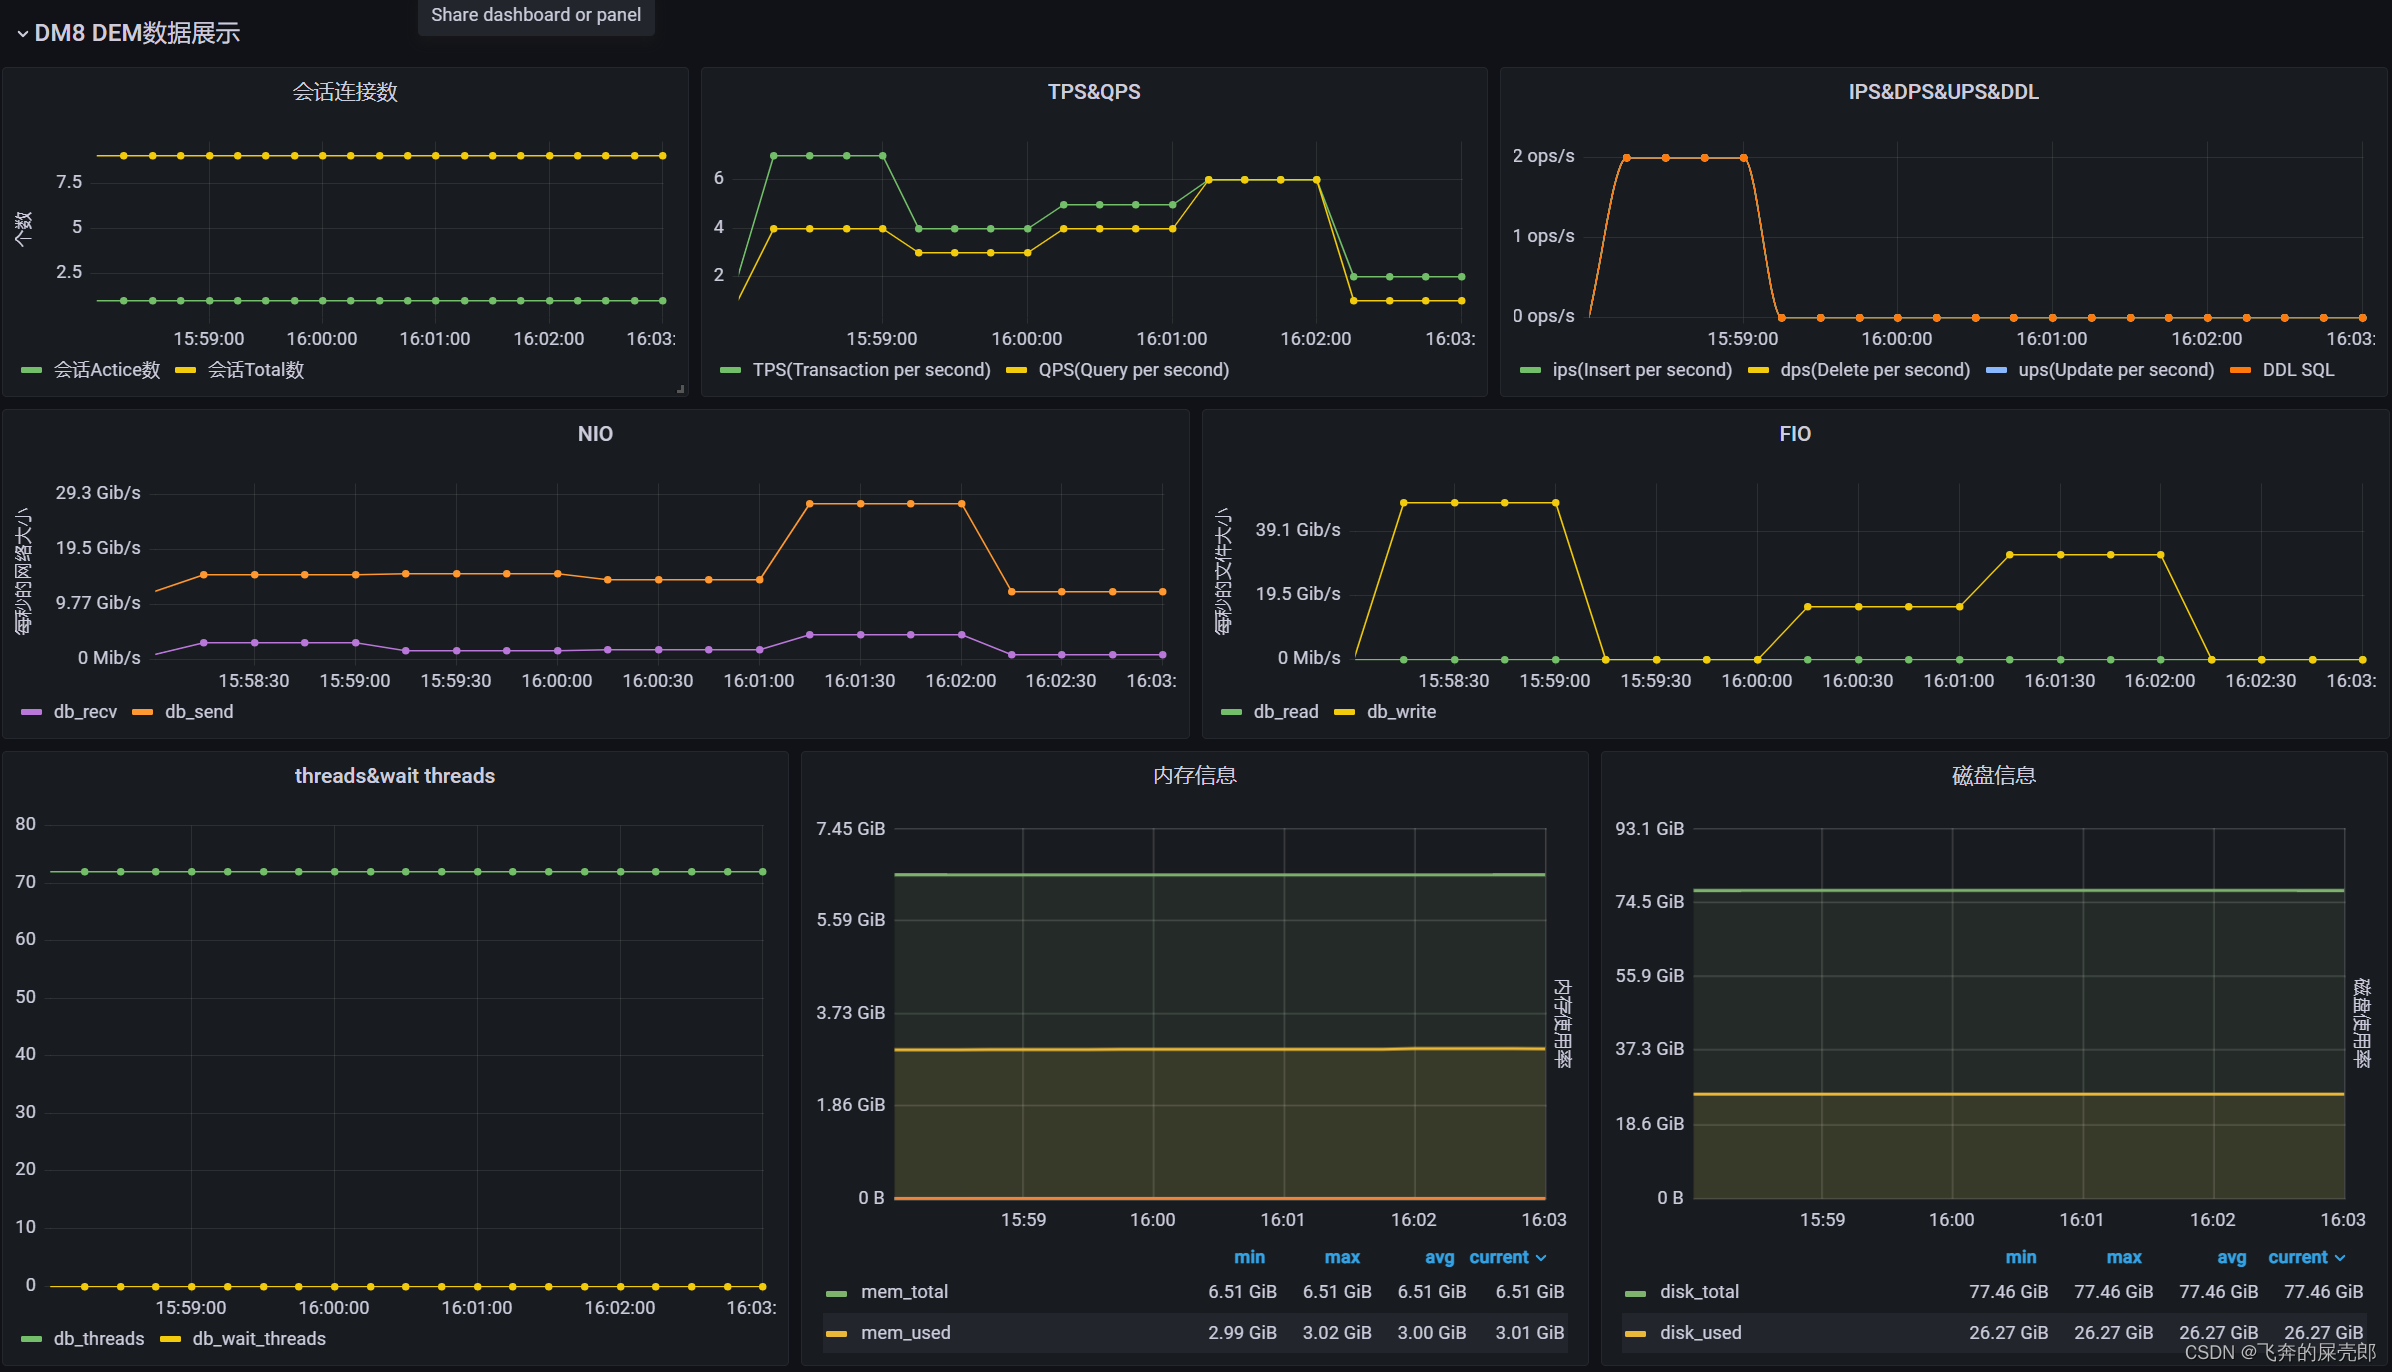
五、grafana绘制仪表盘
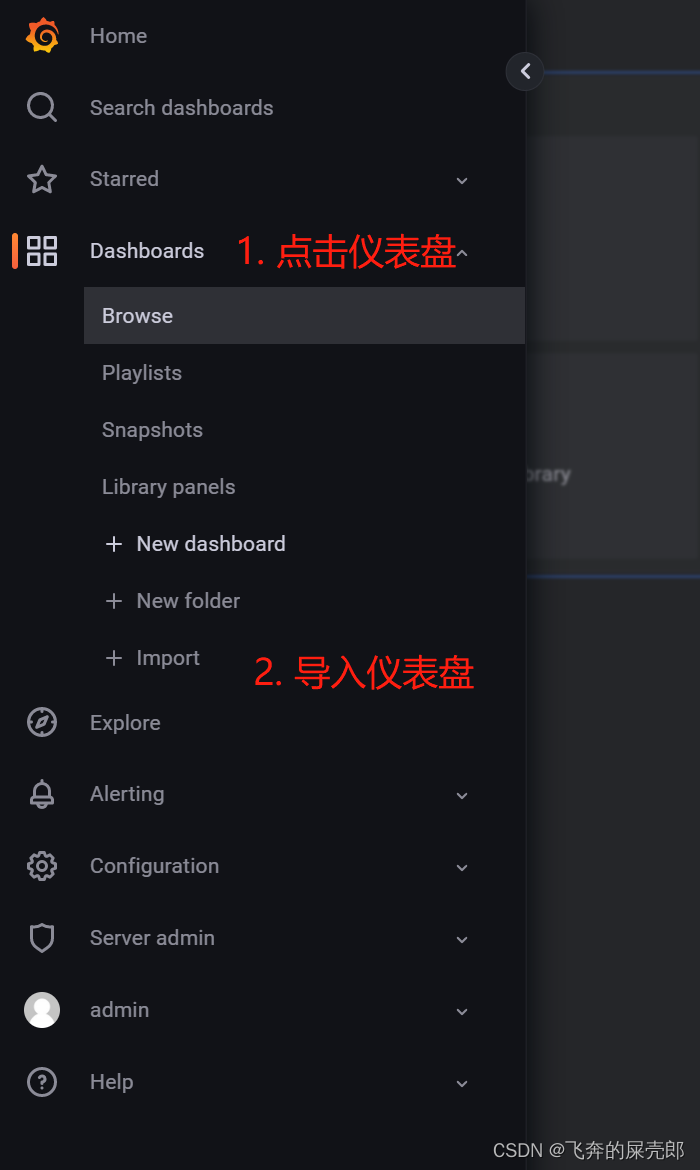
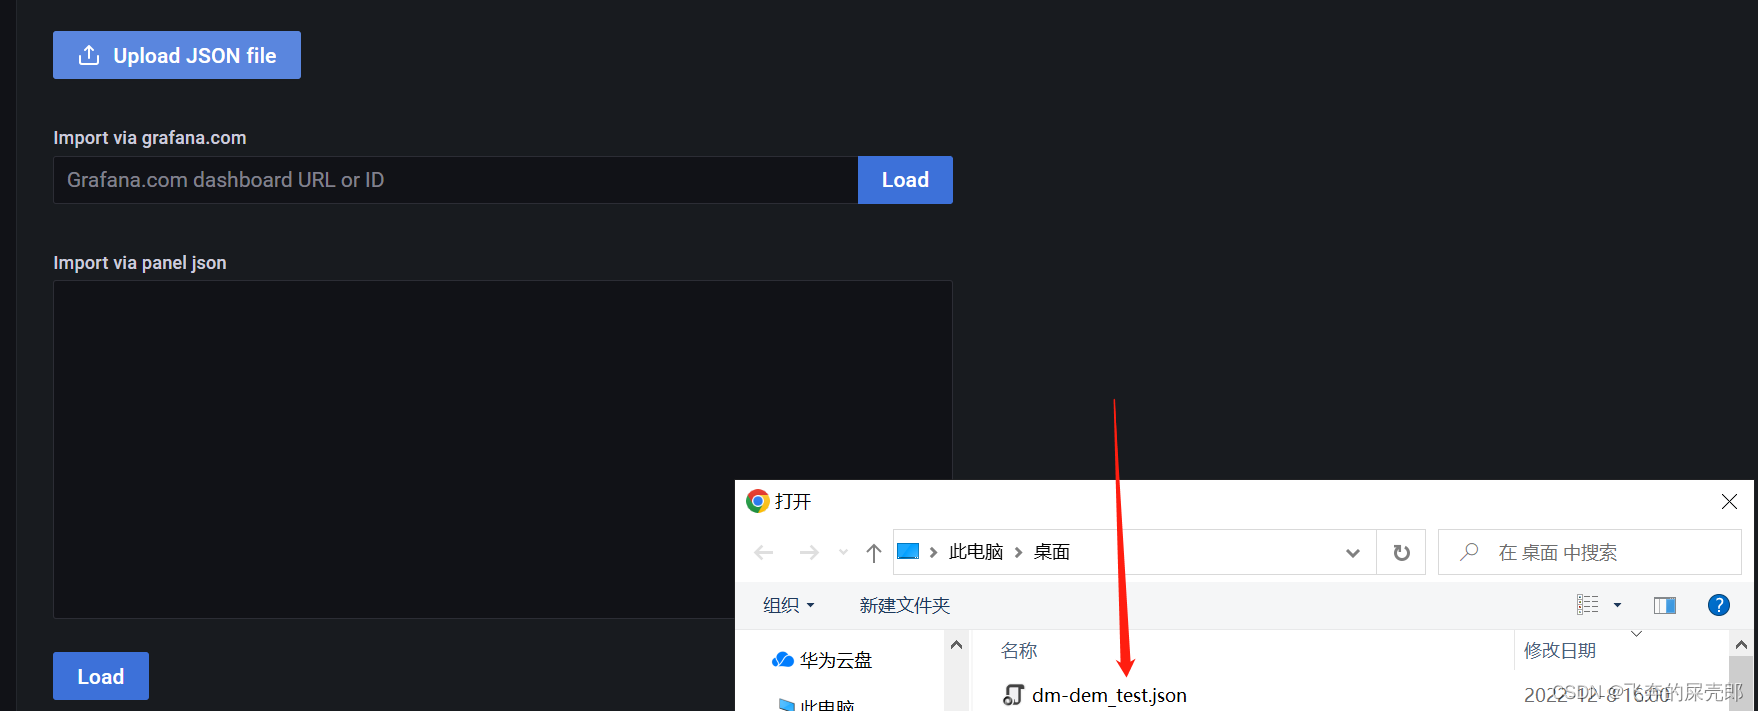
导入事先准备好的仪表盘模板(在文末的资料包中),提示grafana中仪表盘文件最终都是json文件,方便导入导出的
提示:文末中的json文件仅用于功能展示,上生产时具体需要哪些指标可查看Dem手册,并根据实际情况自行功能处理
大致效果如图所示:Dem往prometheus推送的指标项,可以查看Dem的手册,9.1.4.2 指标信息。根据实际情况手绘仪表盘
资料包
链接:https://pan.baidu.com/s/1lo6AynZBR5JdRZwY_1arbA?pwd=o178 提取码:o178
本文为达梦在线服务平台【与达梦同行】征文活动投稿文章:详细文章
第一届达梦数据库技术征文大赛来啦


 594
594

 被折叠的 条评论
为什么被折叠?
被折叠的 条评论
为什么被折叠?
 到【灌水乐园】发言


