


前阵子部署的nginx服务器出现了故障,针对故障现场做了个排查,后来发现是nginx的quic分支代码的问题,出现了死循环导致CPU 近100%
记录下在排查的思路和排查过程中使用的命令和工具
查看CPU
top命令
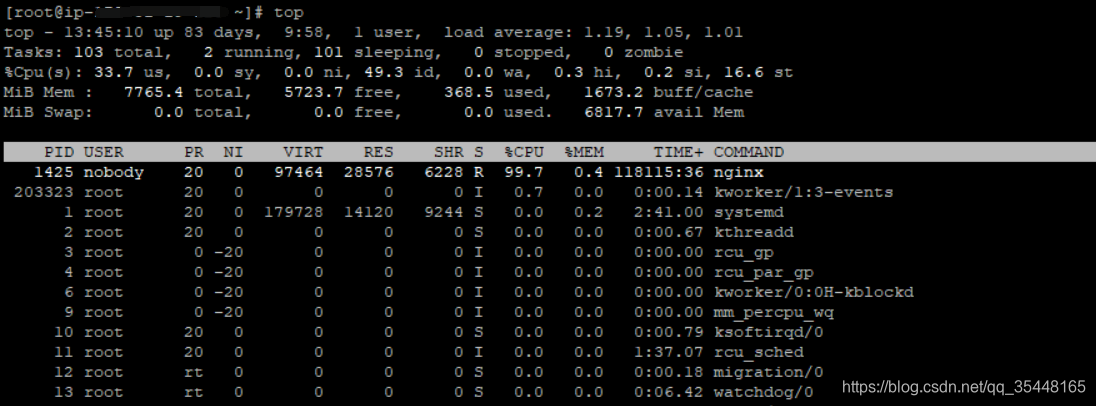
load average:该数据是每隔5秒钟检查一次活跃的进程数,然后按特定算法计算出的数值。如果这个数除以逻辑CPU的数量,结果高于5的时候就表明系统在超负荷运转了。
VIRT:进程使用的虚拟内存。进程使用的虚拟内存总量,单位kb。VIRT=SWAP+RES
RES:驻留内存大小。驻留内存是任务使用的非交换物理内存大小。进程使用的、未被换出的物理内存大小,单位kb。RES=CODE+DATA
SHR:SHR是进程使用的共享内存。共享内存大小,单位kb
S:这个表示进程的状态。它有以下不同的值:
- D - 不可中断的睡眠态。
- R – 运行态
- S – 睡眠态
- T – 被跟踪或已停止
- Z – 僵尸态
%CPU:自从上一次更新时到现在任务所使用的CPU时间百分比。
%MEM:进程使用的可用物理内存百分比。
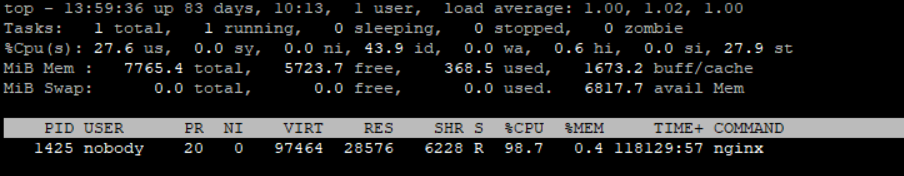
使用top命令后,按t,可以切换显示不同cpu信息

查看固定PID的CPU,内存情况
top -p {PID}
使用ps查询指定进程名或者PID的占用情况
ps -aux|grep nginx
ps -aux|grep 1425
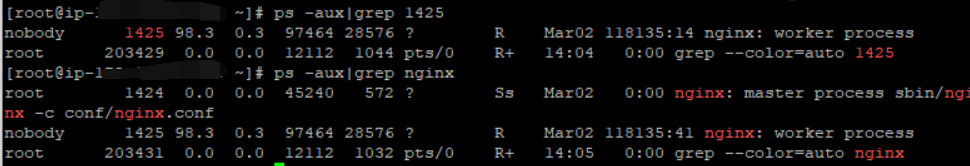
值得注意的是ps 命令里的CPU和top 命令里的计算方式不一样
ps command: CPU usage is currently expressed as the percentage of time spent runningduring the entire lifetime of a process.This is not ideal,and it does not conform to the standards that ps otherwise conforms to.
CPU usage is unlikely to add up to exactly 100%.
top command:The task’s share of the elapsedCPU time since the last screenupdate, expressed as a percentage of total CPU time. In a true SMP environment, if ‘Irix mode’ is Off, top will operate in ‘Solaris mode’ where a task’s cpu usage will be divided by the total number of CPUs. You toggle ‘Irix/Solaris’ modes with the ‘I’ interactive command.
简单来说: ps是从进程开始就开始算的,是平均的占用率;而top是从上次刷新开始算的,一般几秒钟一刷,可以认为是即时的。 排查机器问题的话还是建议看top 命令的%CPU。
查看内存使用情况
free -m /opt/server/

查看机器的连接数
查看tcp连接数
netstat -nat |awk '{print $6}'|grep -v 'Foreign'|grep -v 'established)'|sort|uniq -c|sort -rn

当前机器的连接数还ok,不至于导致cpu 100%
常用的三个状态是:ESTABLISHED 表示正在通信,TIME_WAIT 表示主动关闭,CLOSE_WAIT 表示被动关闭。具体每种状态的意思参考下图就可以了:

分析堆栈信息
pstack
安装 gdb 的时候会自带安装 pstack ,使用如下命令安装即可
yum install gdb -y
pstack {PID}
使用pstack命令打印对应的堆栈信息, 相隔一段时间多次打印,看到的堆栈信息都是一样的,说明当前进程在该方法里"卡住了", 很大可能发生了死循环

参考资料:
Nignx服务器CLOSE_WAIT和TIME_WAIT过高分析
netstat 命令详解
分析进程调用pstack和starce


 154
154


 被折叠的 条评论
为什么被折叠?
被折叠的 条评论
为什么被折叠?
 到【灌水乐园】发言


