


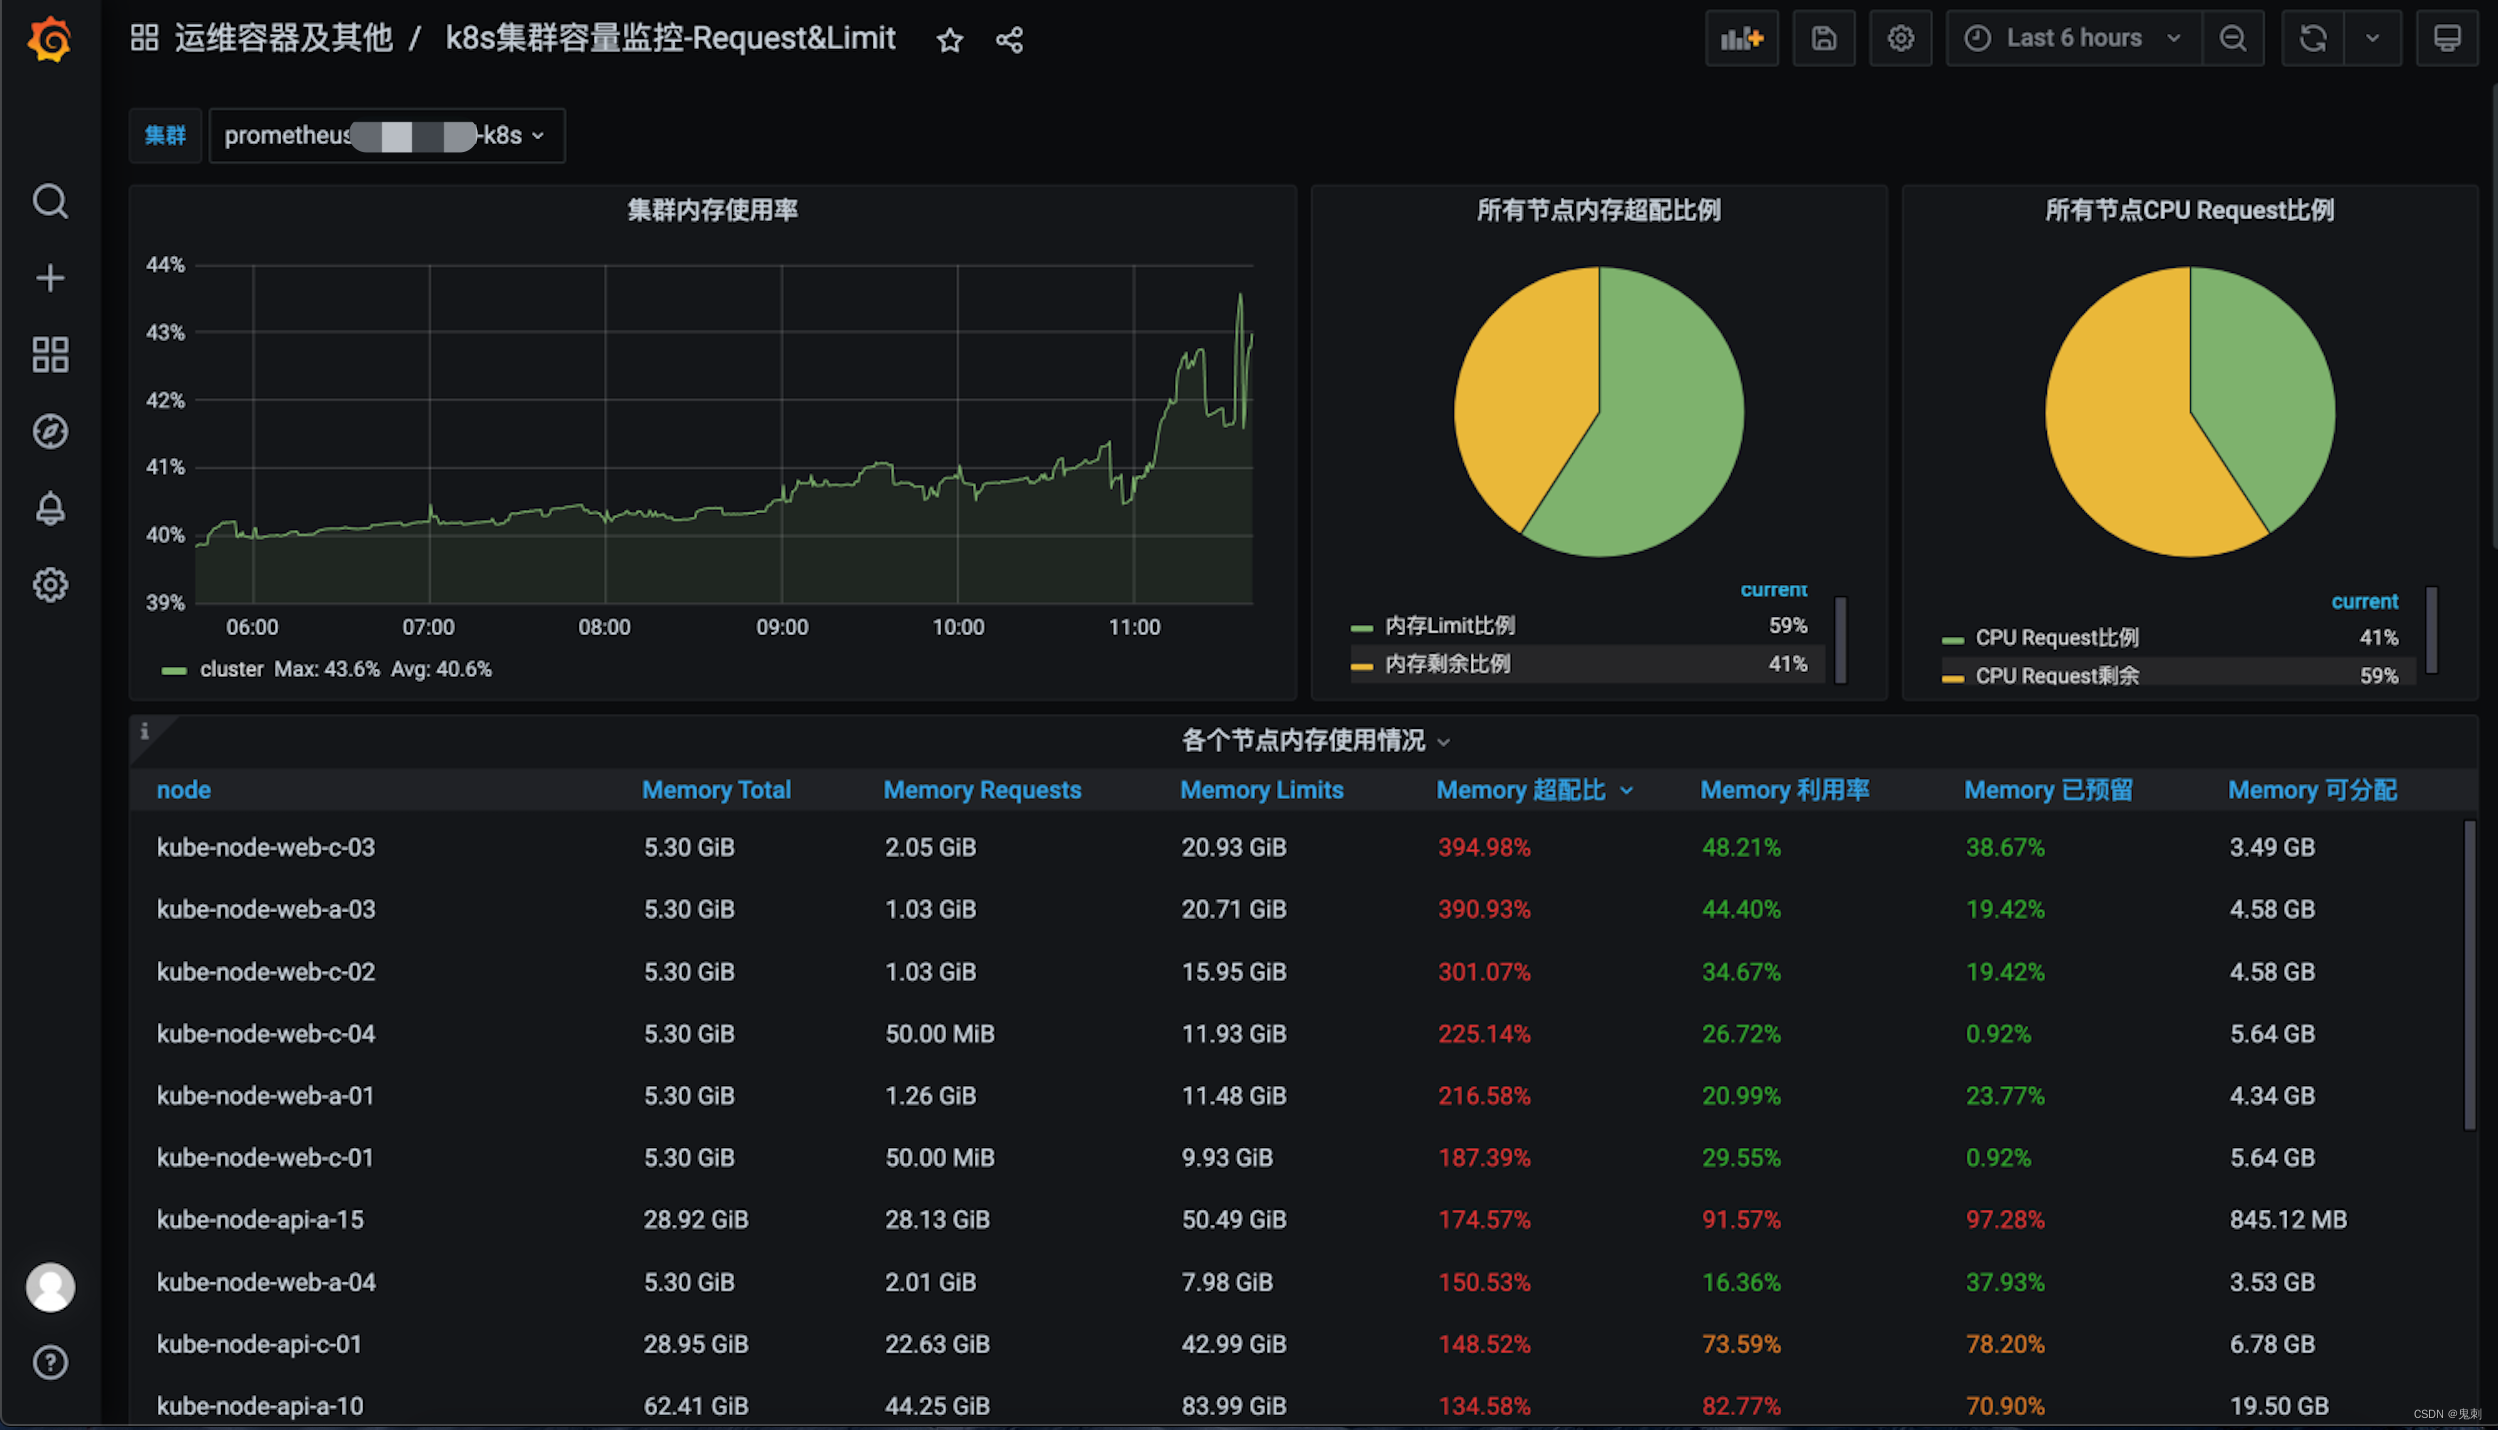
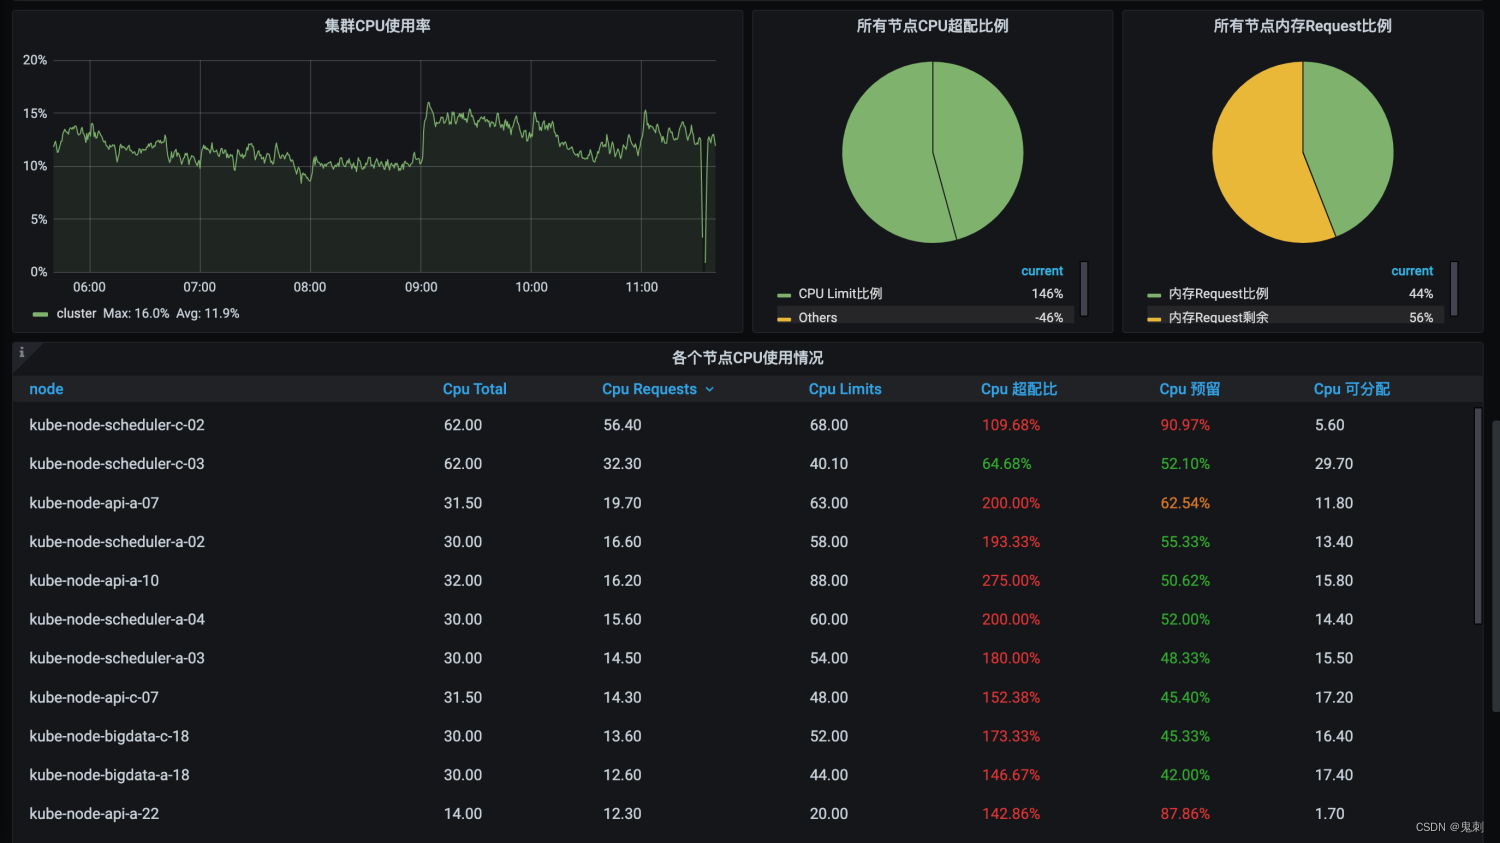
效果图
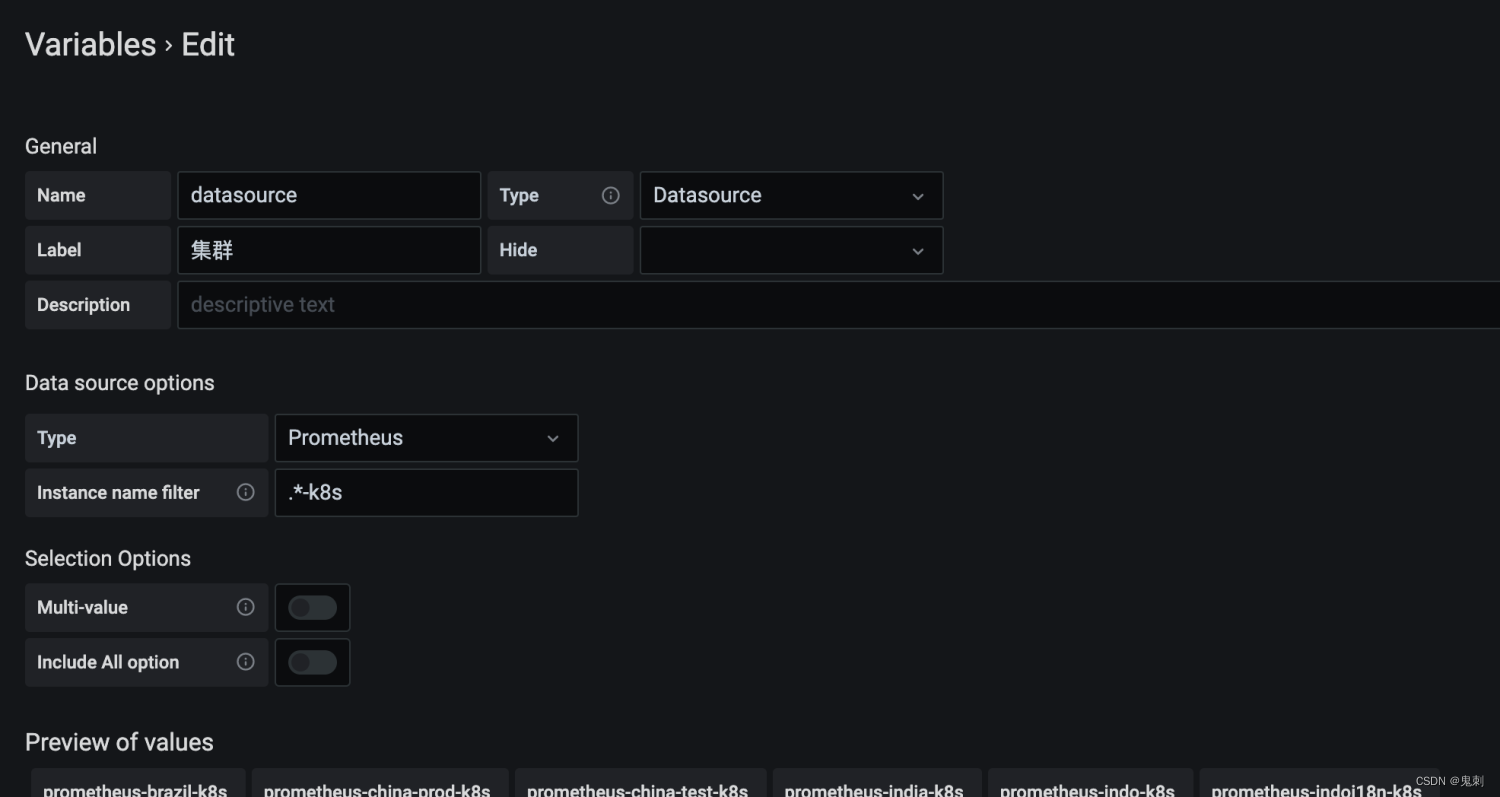
参数设置
JSON
{

  "annotations": {

    "list": [
      {

        "builtIn": 1,
        "datasource": "-- Grafana --",
        "enable": true,
        "hide": true,
        "iconColor": "rgba(0, 211, 255, 1)",
        "name": "Annotations & Alerts",
        "type": "dashboard"
      }
    ]
  },
  "editable": true,
  "gnetId": null,
  "graphTooltip": 0,
  "id": 584,
  "iteration": 1664508893169,
  "links": [],
  "panels": [
    {

      "aliasColors": {
   },
      "bars": false,
      "dashLength": 10,
      "dashes": false,
      "datasource": "${datasource}",
      "description": "",
      "fieldConfig": {

        "defaults": {

          "unit": "percent"
        },
        "overrides": []
      },
      "fill": 1,
      "fillGradient": 0,
      "gridPos": {

        "h": 8,
        "w": 12,
        "x": 0,
        "y": 0
      },
      "hiddenSeries": false,
      "id": 20,
      "legend": {

        "avg": true,
        "current": false,
        "max": true,
        "min": false,
        "show": true,
        "total": false,
        "values": true
      },
      "lines": true,
      "linewidth": 1,
      "nullPointMode": "null",
      "options": {

        "alertThreshold": true
      },
      "percentage": false,
      "pluginVersion": "7.5.10",
      "pointradius": 2,
      "points": false,
      "renderer": "flot",
      "seriesOverrides": [],
      "spaceLength": 10,
      "stack": false,
      "steppedLine": false,
      "targets": [
        {

          "exemplar": true,
          "expr": "(sum(container_memory_working_set_bytes{container!=\"POD\", name!=\"\"}) / sum(kube_node_status_allocatable_memory_bytes)) * 100 ",
          "hide": false,
          "interval": "",
          "legendFormat": "cluster",
          "refId": "A"
        }
      ],
      "thresholds": [],
      "timeFrom": null,
      "timeRegions": [],
      "timeShift": null,
      "title": "集群内存使用率",
      "tooltip": {

        "shared": true,
        "sort": 0,
        "value_type": "individual"
      },
      "type": "graph",
      "xaxis": {

        "buckets": null,
        "mode": "time",
        "name": null,
        "show": true,
        "values": []
      },
      "yaxes": [
        {

          "$$hashKey": "object:319",
          "format": "percent",
          "label": null,
          "logBase": 1,
          "max": null,
          "min": null,
          "show": true
        },
        {

          "$$hashKey": "object:320",
          "format": "short",
          "label": null,
          "logBase": 1,
          "max": null,
          "min": null,
          "show": true
        }
      ],
      "yaxis": {

        "align": false,
        "alignLevel": null
      }
    },
    {

      "aliasColors": {
   },
      "breakPoint": "50%",
      "cacheTimeout": null,
      "combine": {

        "label": "Others",
        "threshold": 0
      },
      "datasource": "$datasource",
      "fieldConfig": {

        "defaults": {
   },
        "overrides": []
      },
      "fontSize": "80%",
      "format": "percent",
      "gridPos": {

        "h": 8,
        "w": 6,
        "x": 12,
        "y": 0
      },
      "id": 15,
      "interval": null,
      "legend": {

        "show": true,
        "values": true
      },
      "legendType": "Under graph",
      "links": [],
      "maxDataPoints": 3,
      "nullPointMode": "connected",
      "pieType": "pie",
      "strokeWidth": 1,
      "targets": [
        {

          "application": {

            "filter": ""
          },
          "exemplar": true,
          "expr": "(sum(kube_pod_container_resource_limits_memory_bytes) / sum(kube_node_status_allocatable_memory_bytes)) * 100",
          "format": "time_series",
          "functions": [],
          "group": {

            "filter": ""
          },
          "hide": false,
          "host": {

            "filter": ""
          },
          "interval": "",
          "intervalFactor": 1,
          "item": {

            "filter": ""
          },
          "legendFormat": "内存Limit比例",
          "mode": 0,
          "options": {

            "showDisabledItems": false
          },
          "refId": "A",
          "triggers": {

            "acknowledged": 2,
            "count": true,
            "minSeverity": 3
          }
        },
        {

          "exemplar": true,
          "expr": "100 - (sum(kube_pod_container_resource_limits_memory_bytes) / sum(kube_node_status_allocatable_memory_bytes)) * 100",
          "format": "time_series",
          "hide": false,
          "interval": "",
          "intervalFactor": 1,
          "legendFormat": "内存剩余比例",
          "refId": "B"
        }
      ],
      "title": "所有节点内存超配比例",
      "type": "grafana-piechart-panel",
      "valueName": "current"
    },
    {

      "aliasColors": {
   },
      "breakPoint": "50%",
      "cacheTimeout": null,
      "combine": {

        "label": "Others",
        "threshold": 0
      },
      "datasource": "$datasource",
      "fieldConfig": {

        "defaults": {
   },
        "overrides": []
      },
      &#
最低0.47元/天 解锁文章


 1652
1652


 被折叠的 条评论
为什么被折叠?
被折叠的 条评论
为什么被折叠?
 到【灌水乐园】发言


