


一、软件下载
官网:https://prometheus.io/download/
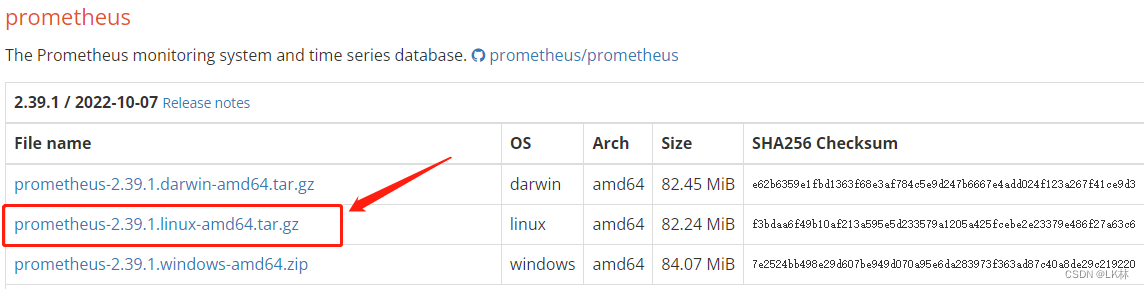
其他组件也可在此页面中选择下载。
说明:
prometheus:监控主程序,可理解为server端
node_exporter:收集信息,可理解为agent端(用于硬件监控)
Alertermanager:报警组件
blackbox:服务监控组件,可理解为agent端(用于服务监控)
二、环境说明
192.168.60.2(server+agent):部署prometheus+node_exporter
192.168.60.3(agent):部署node_exporter
192.168.60.4(agent):部署node_exporter
三、Prometheus搭建
将prometheus-2.39.1.linux-amd64.tar.gz组件上传至Linux服务器指定目录,本文上传至/prometheus/中
cd /prometheus                       #进入目录
tar -xvf prometheus-2.39.1.linux-amd64.tar.gz                 #解压
.....                                       #解压过程省略
mv prometheus-2.32.0.linux-amd64 /usr/local/prometheus    #将解压后的目录移动至/usr/local/并改名
chmod +x /usr/local/prometheus/prom*     #授权
修改配置文件
cd /usr/local/prometheus/            #进入目录
vi prometheus.yml                       #编辑配置文件
需修改的内容已用#+汉字标注:
# my global config
global:
  scrape_interval: 15s
  evaluation_interval: 15s
  scrape_timeout:15s                 #这里需要修改为15秒

# Alertmanager configuration
alerting:
  alertmanagers:
    - static_configs:
        - targets:
          # - alertmanager:9093

# Load rules once and periodically evaluate them according to the global 'evaluation_interval'.
rule_files:
  # - "first_rules.yml"
  # - "second_rules.yml"

# A scrape configuration containing exactly one endpoint to scrape:
# Here it's Prometheus itself.
scrape_configs:
  # The job name is added as a label `job=<job_name>` to any timeseries scraped from this config.
  - job_name: "prometheus"

    # metrics_path defaults to '/metrics'
    # scheme defaults to 'http'.

    static_configs:
      - targets: ["localhost:9090"]     #使用默认端口,无需修改。
        labels:                         #添加标签(可以不添加此项)
           app: prometheus
           nodename: prometheus

  - job_name: "agent"                       #添加监控项目
    static_configs:
      - targets: ["192.168.60.2:9100"]          #填写第一台服务器的端口,9100为node_exporter服务默认端口。后面会部署
        labels:                                 #添加标签,以下内容方便监控时直接使用标签进行区分。
           app: node-192.168.60.2
           nodename: node-192.168.60.2

      - targets: ["192.168.60.3:9100"]
        labels:
           app: node-192.168.60.3
           nodename: node-192.168.60.3

      - targets: ["192.168.60.4:9100"]
        labels:
           app: node-192.168.60.4
           nodename: node-192.168.60.4
修改完成后可以用prometheus自带的检查工具进行配置文件检查:
[root@localhost prometheus]# ./promtool check config prometheus.yml
Checking prometheus.yml
  SUCCESS: 0 rule files found
检查无误即可。如果配置文件写错,会提示具体行数,自己检查调整即可。
服务启动
为了方便管理,使用systemctl服务进行管理。
将prometheus服务加入system服务中:
cat > /usr/lib/systemd/system/prometheus.service <<EOF
[Unit]
Description=Prometheus

[Service]
ExecStart=/usr/local/prometheus/prometheus --config.file=/usr/local/prometheus/prometheus.yml --storage.tsdb.path=/data/prometheus --web.enable-lifecycle --storage.tsdb.retention.time=180d
Restart=on-failure

[Install]
WantedBy=multi-user.target
EOF
加载并启动服务:
systemctl daemon-reload          #重新加载
systemctl start prometheus.service   #启动
systemctl enable prometheus.service  #开机自启
检查服务状态:
[root@localhost prometheus]# systemctl status prometheus.service
● prometheus.service - Prometheus
   Loaded: loaded (/usr/lib/systemd/system/prometheus.service; enabled; vendor preset: disabled)
   Active: active (running) since Wed 2022-10-26 02:16:02 EDT; 1min 2s ago
 Main PID: 19835 (prometheus)
   CGroup: /system.slice/prometheus.service
           └─19835 /usr/local/prometheus/prometheus --config.file=/usr/local/prometheus/prometheus.yml --storage.tsdb.pa...

Oct 26 02:16:02 localhost.localdomain prometheus[19835]: ts=2022-10-26T06:16:02.710Z caller=head.go:488 level=info c...any"
Oct 26 02:16:02 localhost.localdomain prometheus[19835]: ts=2022-10-26T06:16:02.710Z caller=head.go:522 level=info c….456µs
Oct 26 02:16:02 localhost.localdomain prometheus[19835]: ts=2022-10-26T06:16:02.710Z caller=head.go:528 level=info c...ile"
Oct 26 02:16:02 localhost.localdomain prometheus[19835]: ts=2022-10-26T06:16:02.710Z caller=head.go:599 level=info c...nt=0
Oct 26 02:16:02 localhost.localdomain prometheus[19835]: ts=2022-10-26T06:16:02.710Z caller=head.go:605 level=info c….127µs
Oct 26 02:16:02 localhost.localdomain prometheus[19835]: ts=2022-10-26T06:16:02.712Z caller=main.go:945 level=info f...AGIC
Oct 26 02:16:02 localhost.localdomain prometheus[19835]: ts=2022-10-26T06:16:02.712Z caller=main.go:948 level=info m...ted"
Oct 26 02:16:02 localhost.localdomain prometheus[19835]: ts=2022-10-26T06:16:02.712Z caller=main.go:1129 level=info ....yml
Oct 26 02:16:02 localhost.localdomain prometheus[19835]: ts=2022-10-26T06:16:02.713Z caller=main.go:1166 level=info msg=…µs
Oct 26 02:16:02 localhost.localdomain prometheus[19835]: ts=2022-10-26T06:16:02.713Z caller=main.go:897 level=info m...ts."
Hint: Some lines were ellipsized, use -l to show in full.
如上,说明prometheus服务已正常启动
prometheus页面访问
(记得把IP改成自己服务器的IP)
主页面:http://192.168.60.2:9090/
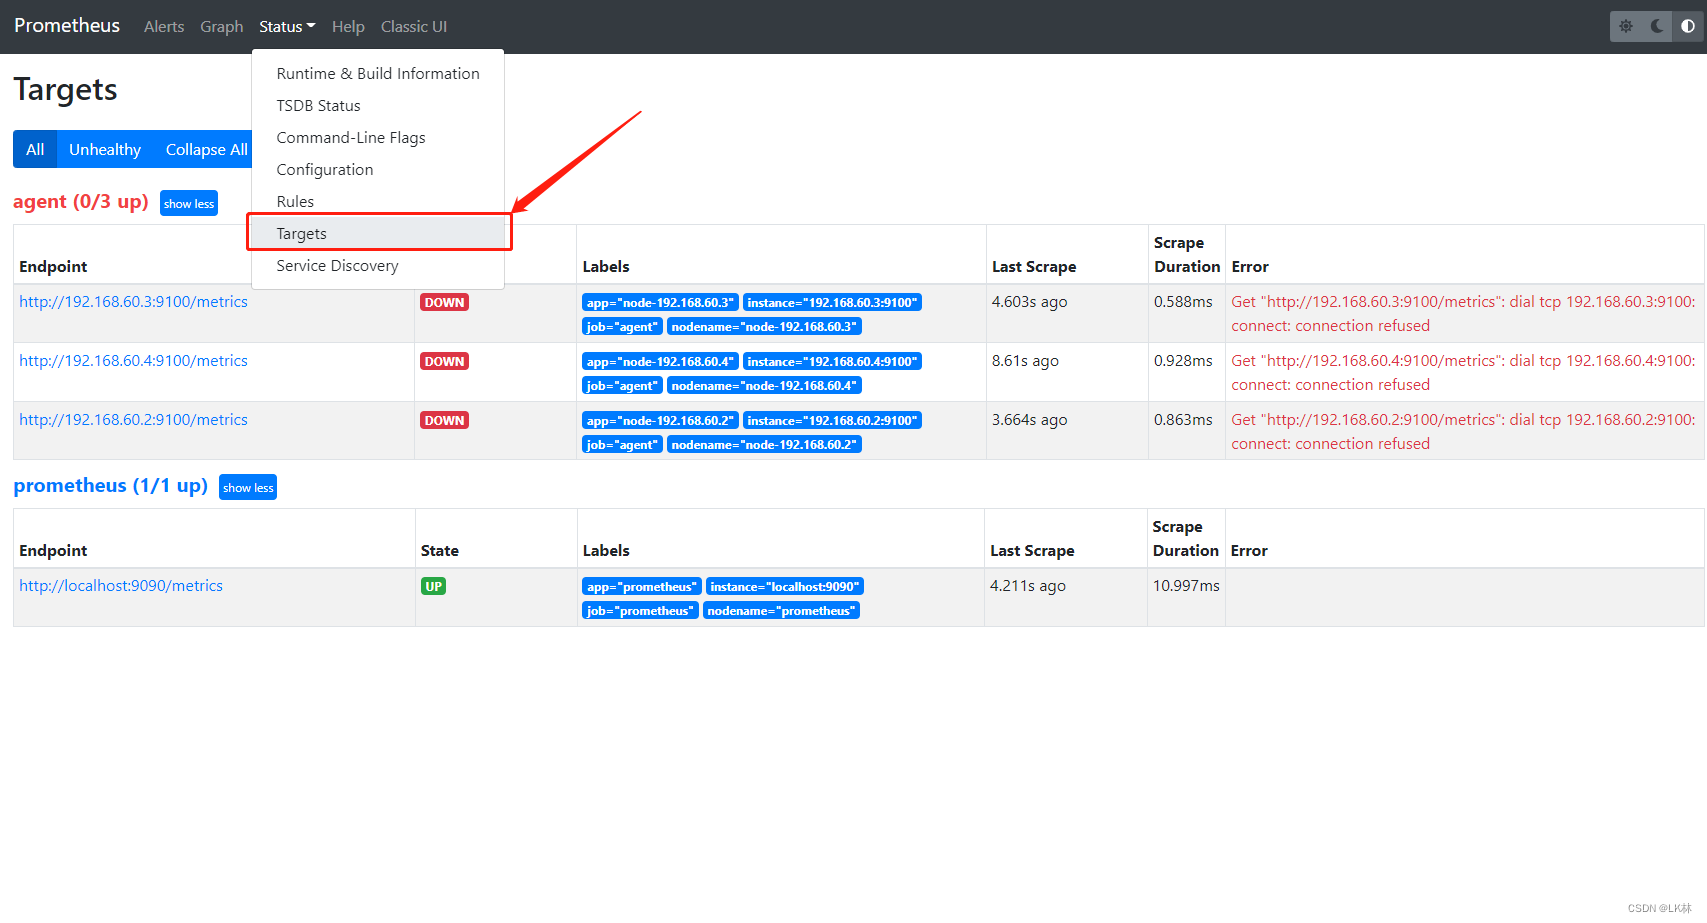
此时选中Status→Targets,可以看到已配置的客户端,均为红色(因为node_exporter未搭建)。
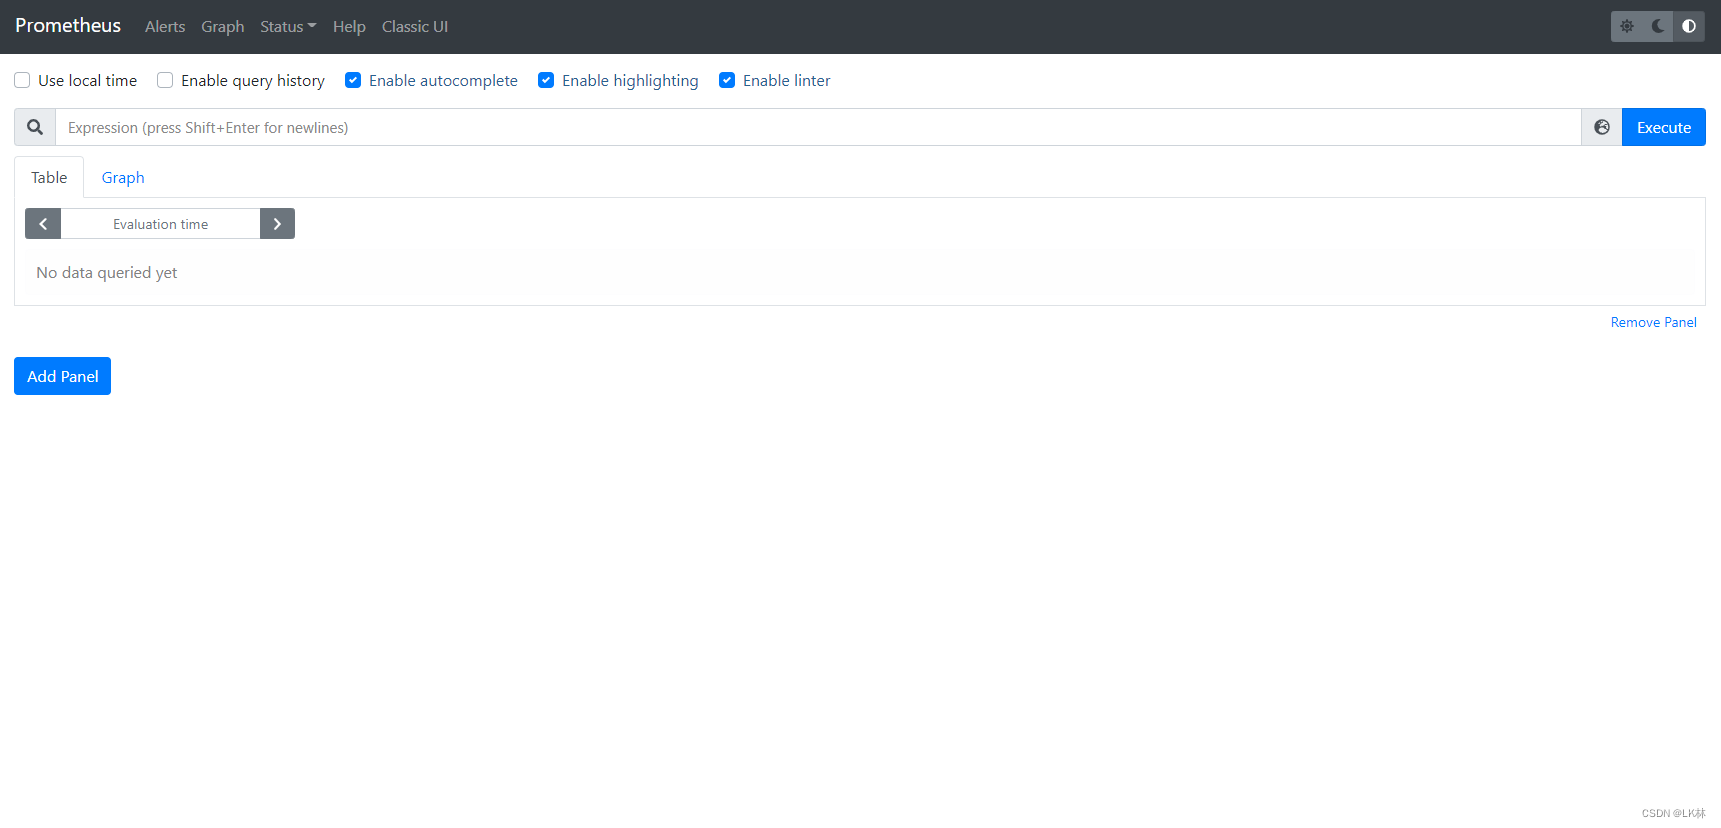
Prometheus内置的控制台访问入口:http://192.168.60.2:9090/graph
Prometheus本身暴露度量数据的HTTP接口为:http://192.168.60.2:9090/metrics
Node_exporter搭建
首先将从官网下载好的node_exporter-1.3.1.linux-amd64.tar.gz上传至3台服务器的指定目录。
博主放在了/root/下,安装包版本不一致应该问题不大。
解压和移动:
[root@localhost ~]# tar -xvf node_exporter-1.3.1.linux-amd64.tar.gz
node_exporter-1.3.1.linux-amd64/
node_exporter-1.3.1.linux-amd64/LICENSE
node_exporter-1.3.1.linux-amd64/NOTICE
node_exporter-1.3.1.linux-amd64/node_exporter
[root@localhost ~]# mv node_exporter-1.3.1.linux-amd64 /usr/local/node_exporter
依然是使用systemctl进行服务控制。编写service文件:
cat >/usr/lib/systemd/system/node_exporter.service  <<EOF
[Unit]
Description=node_exporter
[Service]
ExecStart=/usr/local/node_exporter/node_exporter \
--web.listen-address=:9100 \
--collector.systemd \
--collector.systemd.unit-whitelist="(ssh|docker|rsyslog|redis-server).service" \
--collector.textfile.directory=/usr/local/node_exporter/textfile.collected
Restart=on-failure
[Install]
WantedBy=multi-user.target
EOF
服务加载、启动、设置自启:
systemctl daemon-reload
systemctl start node_exporter.service
systemctl enable node_exporter.service
服务状态检查:
[root@localhost ~]# systemctl status node_exporter.service
● node_exporter.service - node_exporter
   Loaded: loaded (/usr/lib/systemd/system/node_exporter.service; enabled; vendor preset: disabled)
   Active: active (running) since Wed 2022-10-26 02:43:54 EDT; 5s ago
 Main PID: 10493 (node_exporter)
   Memory: 6.7M
   CGroup: /system.slice/node_exporter.service
           └─10493 /usr/local/node_exporter/node_exporter --web.listen-address=:9100 --col...

Oct 26 02:43:54 localhost.localdomain node_exporter[10493]: ts=2022-10-26T06:43:54.556Z c...e
Oct 26 02:43:54 localhost.localdomain node_exporter[10493]: ts=2022-10-26T06:43:54.556Z c...x
Oct 26 02:43:54 localhost.localdomain node_exporter[10493]: ts=2022-10-26T06:43:54.556Z c...s
Oct 26 02:43:54 localhost.localdomain node_exporter[10493]: ts=2022-10-26T06:43:54.556Z c...e
Oct 26 02:43:54 localhost.localdomain node_exporter[10493]: ts=2022-10-26T06:43:54.556Z c...t
Oct 26 02:43:54 localhost.localdomain node_exporter[10493]: ts=2022-10-26T06:43:54.556Z c...s
Oct 26 02:43:54 localhost.localdomain node_exporter[10493]: ts=2022-10-26T06:43:54.557Z c...s
Oct 26 02:43:54 localhost.localdomain node_exporter[10493]: ts=2022-10-26T06:43:54.557Z c...0
Oct 26 02:43:54 localhost.localdomain node_exporter[10493]: ts=2022-10-26T06:43:54.559Z c...e
Oct 26 02:43:59 localhost.localdomain node_exporter[10493]: ts=2022-10-26T06:43:59.612Z c..."
Hint: Some lines were ellipsized, use -l to show in full.
以上node_exporter服务已搭建完毕
prometheus使用
回到web页面,可以看到所有客户端已在线
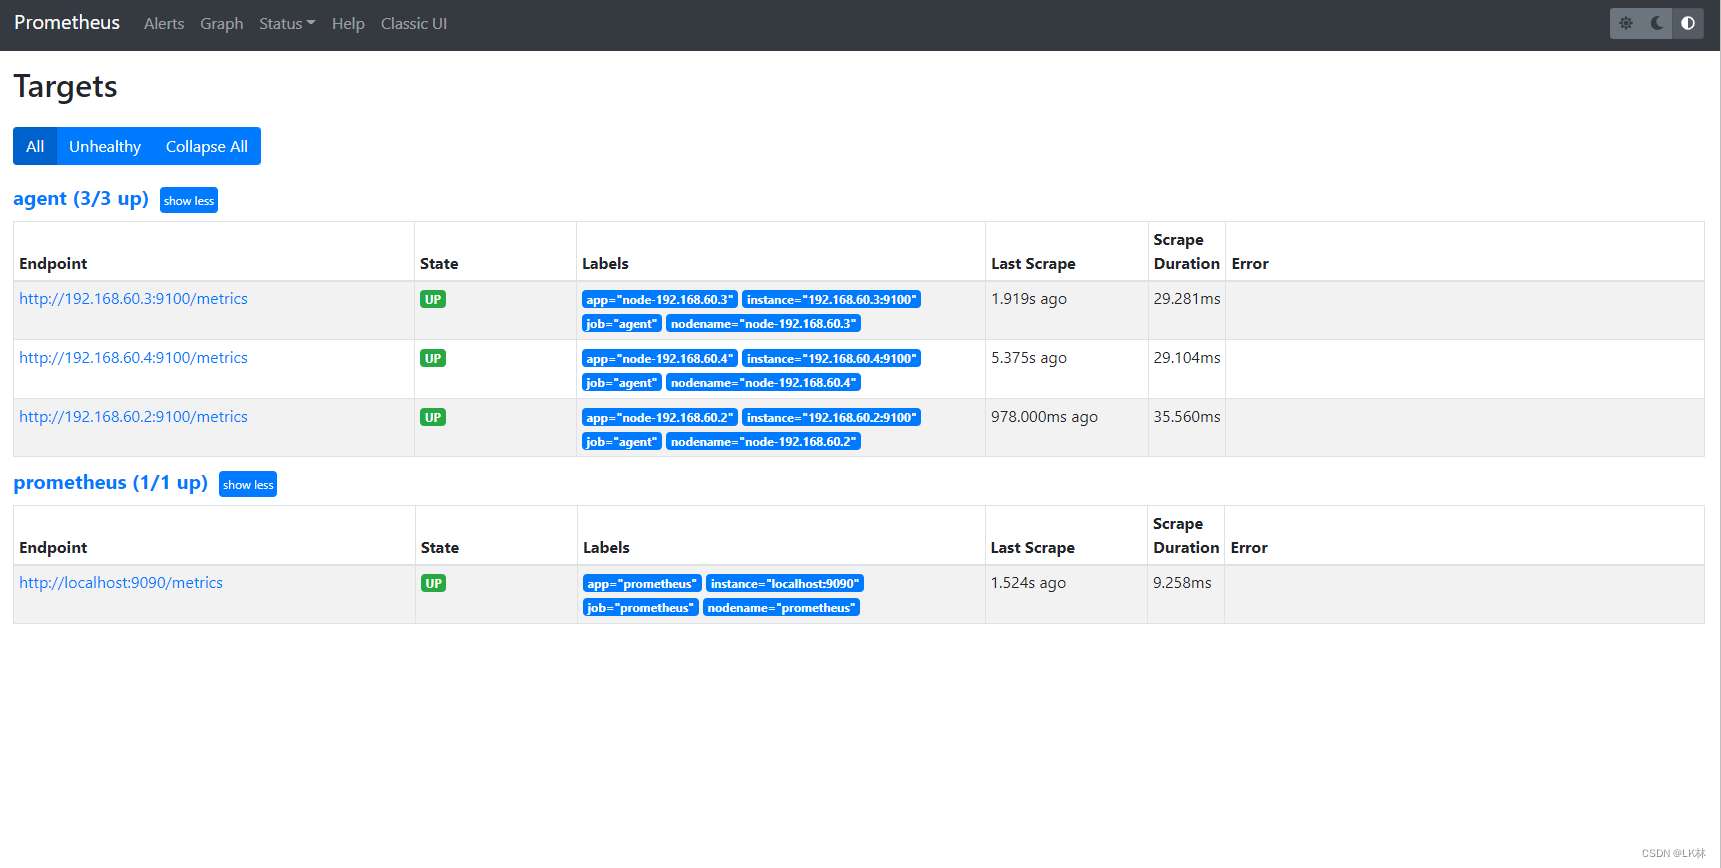
点击左上角prometheus回到主页,可以进行简单监控项查询:
例如查看192.168.60.2的各磁盘使用率:100-node_filesystem_free_bytes{nodename=“node-192.168.60.2”}/node_filesystem_size_bytes{nodename=“node-192.168.60.2”}*100
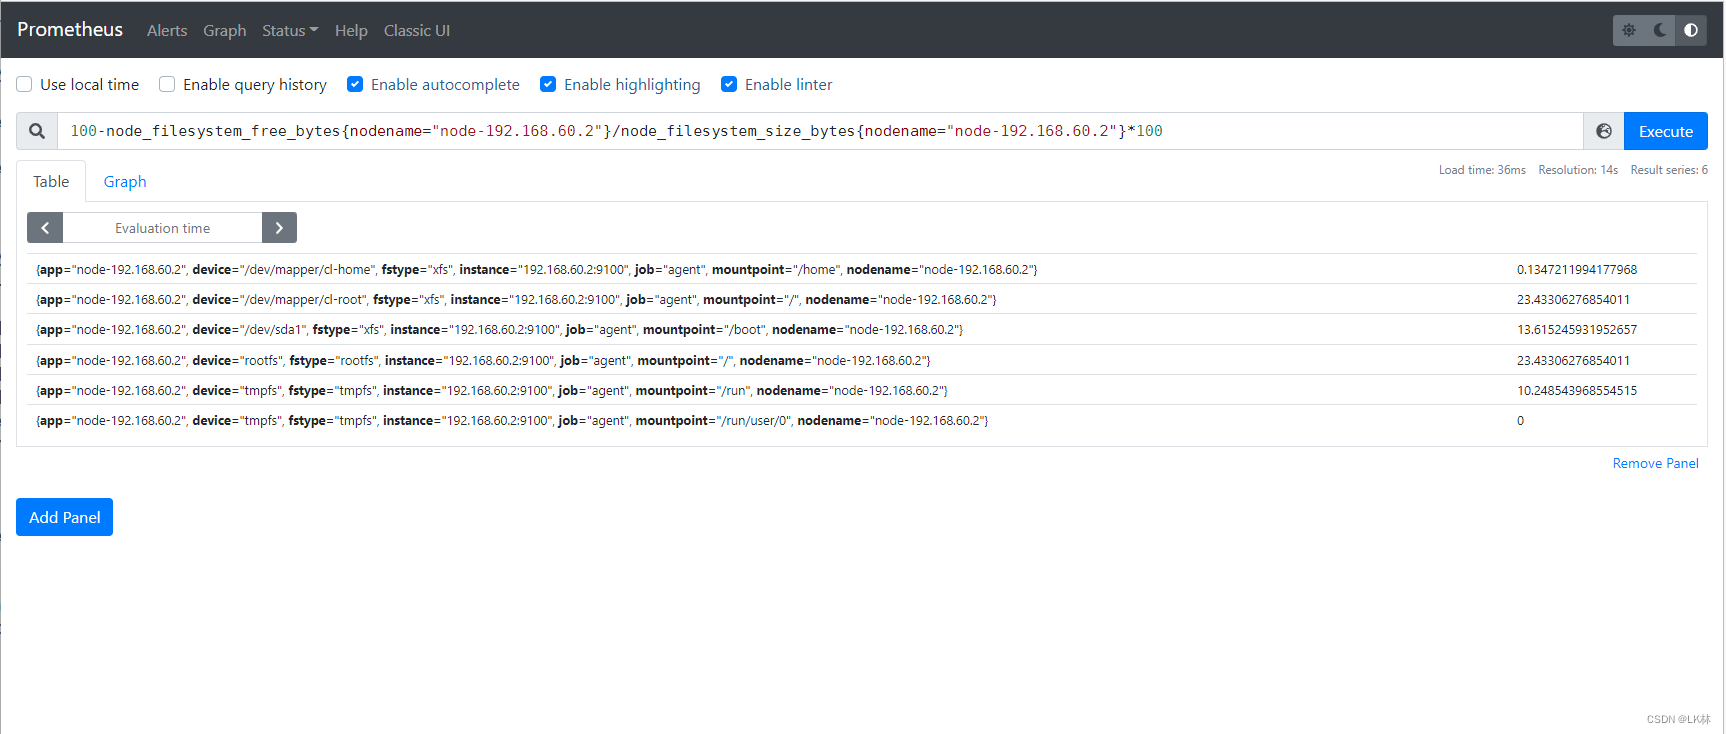
promsql有很多,可以查看内存、CPU、预计情况等等。后面会在进行汇总。
目前prometheus的监控功能已正常。
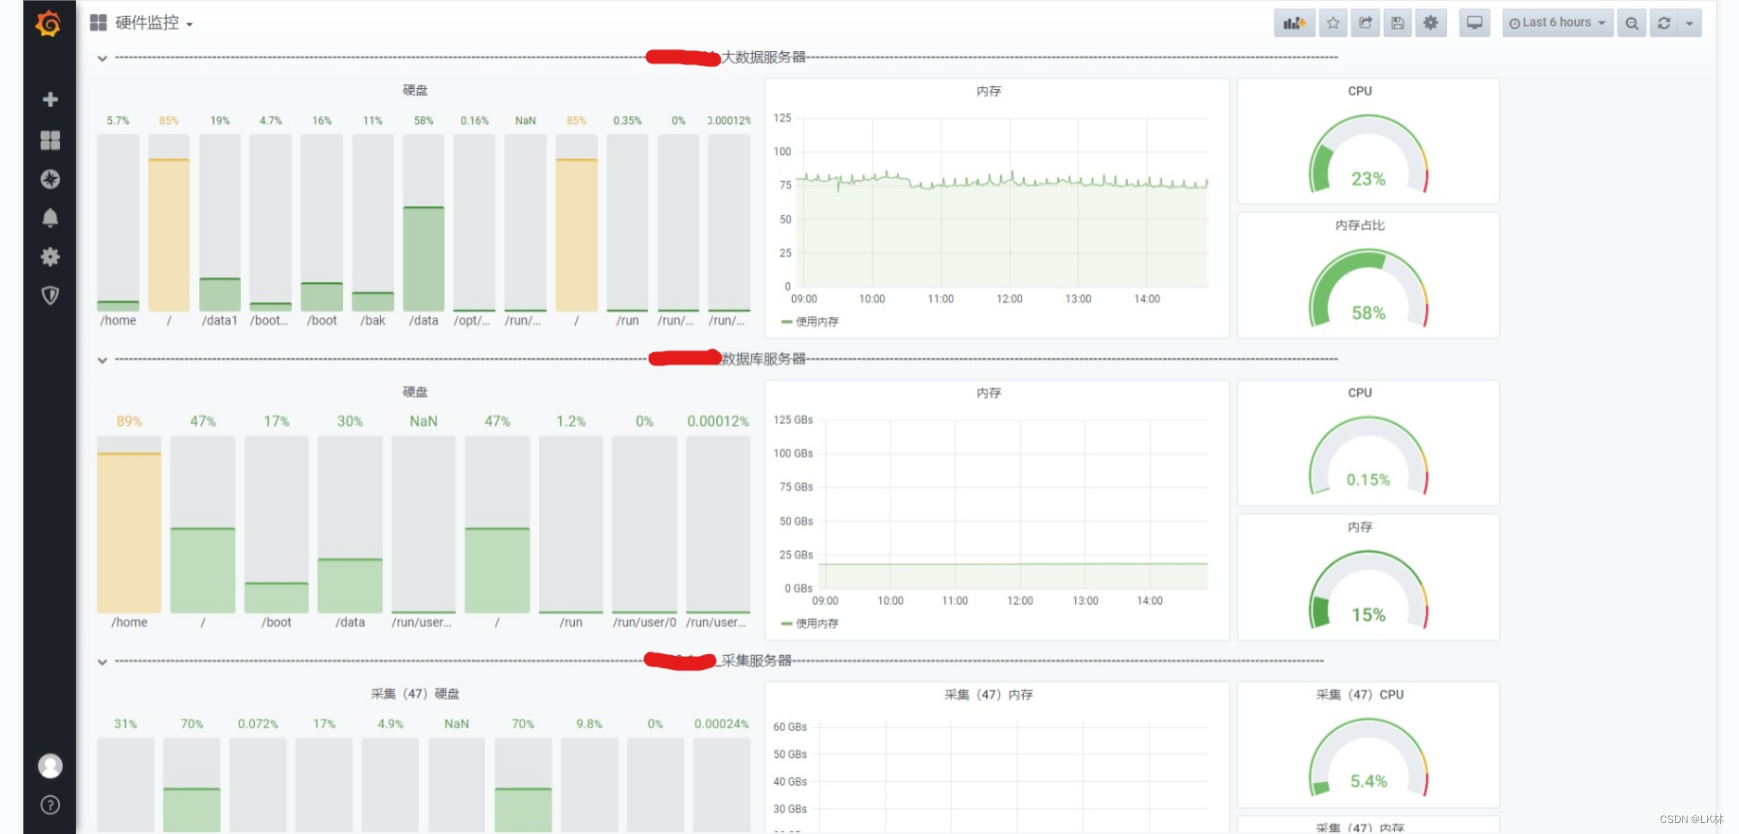
如想进行可视化展示。请期待后续:grafana监控平台部署与搭建
展示图:


 4373
4373


 被折叠的 条评论
为什么被折叠?
被折叠的 条评论
为什么被折叠?
 到【灌水乐园】发言


