


1.静态页面处理
 <div id="statistics" style="height: 400px;"></div>
<div class="hDiv">
                <div class="hDivBox">
                    <table cellspacing="0" cellpadding="0">
                        <thead>
                        <tr>
                            <th class="sign" axis="col0">
                                <div style="width: 24px;"><i class="ico-check"></i></div>
                            </th>
                            <th align="center" abbr="article_title" axis="col3" class="">
                                <div style="text-align: center; width: 120px;" class="">时间</div>
                            </th>
                            <th align="center" abbr="ac_id" axis="col4" class="">
                                <div style="text-align: center; width: 100px;" class="">订单数</div>
                            </th>
                            <th align="center" abbr="article_show" axis="col5" class="">
                                <div style="text-align: center; width: 100px;" class="">销售总额</div>
                            </th>
                            <th align="center" abbr="article_time" axis="col6" class="">
                                <div style="text-align: center; width: 100px;" class="">客单价</div>
                            </th>
                            <th align="center" axis="col1" class="handle">
                                <div style="text-align: center; width: 150px;">操作</div>
                            </th>
                        </tr>
                        </thead>
                    </table>
                </div>
            </div>
<script src="__PUBLIC__/echart/echarts.min.js" type="text/javascript"></script>
<script src="__PUBLIC__/echart/macarons.js"></script>
<script src="__PUBLIC__/echart/china.js"></script>
2.js内容
<script type="text/javascript">
    var res = {$result};
    var myChart = echarts.init(document.getElementById('statistics'),'macarons');
    option = {
        tooltip : {
            trigger: 'axis'
        },
        toolbox: {
            show : true,
            feature : {
                mark : {show: true},
                dataView : {show: true, readOnly: false},
                magicType: {show: true, type: ['line', 'bar']},
                restore : {show: true},
                saveAsImage : {show: true}
            }
        },
        calculable : true,
        legend: {
            data:['交易金额','订单数','客单价']
        },
        xAxis : [
            {
                type : 'category',
                data : res.time
            }
        ],
        yAxis : [
            {
                type : 'value',
                name : '金额',
                axisLabel : {
                    formatter: '{value} ¥'
                }
            },
            {
                type : 'value',
                name : '客单价',
                axisLabel : {
                    formatter: '{value} ¥'
                }
            }
        ],
        series : [
            {
                name:'交易金额',
                type:'bar',
                data:res.amount
            },
            {
                name:'订单数',
                type:'bar',
                data:res.order
            },
            {
                name:'客单价',
                type:'line',
                yAxisIndex: 1,
                data:res.sign
            }
        ]
    };
    myChart.setOption(option);
    $(document).ready(function(){
        // 表格行点击选中切换
        $('#flexigrid > table>tbody >tr').click(function(){
            $(this).toggleClass('trSelected');
        });
        // 点击刷新数据
        $('.fa-refresh').click(function(){
            location.href = location.href;
        });

</script>
3.php从数据库获取数据,并进行处理
  $sql .= " where create_time>$this->begin and create_time<$this->end AND status>0 group by gap ";
        $res = Db::query($sql);//订单数,交易额
        foreach ($res as $val){
            $arr[$val['gap']] = $val['tnum'];
            $brr[$val['gap']] = $val['amount'];
        }

        for($i=$this->begin;$i<=$this->end;$i=$i+24*3600){
            $tmp_num = empty($arr[date('Y-m-d',$i)]) ? 0 : $arr[date('Y-m-d',$i)];
            $tmp_amount = empty($brr[date('Y-m-d',$i)]) ? 0 : $brr[date('Y-m-d',$i)];
            $tmp_sign = empty($tmp_num) ? 0 : round($tmp_amount/$tmp_num,2);
            $order_arr[] = $tmp_num;
            $amount_arr[] = $tmp_amount;
            $sign_arr[] = $tmp_sign;
            $date = date('Y-m-d',$i);
            $list[] = array('day'=>$date,'order_num'=>$tmp_num,'amount'=>$tmp_amount,'sign'=>$tmp_sign,'end'=>date('Y-m-d',$i+24*60*60));
            $day[] = $date;
        }
        rsort($list);
        $this->assign('list',$list);
        $result = array('order'=>$order_arr,'amount'=>$amount_arr,'sign'=>$sign_arr,'time'=>$day);
        $this->assign('result',json_encode($result));
        return $this->fetch();
4.最终生成的图形
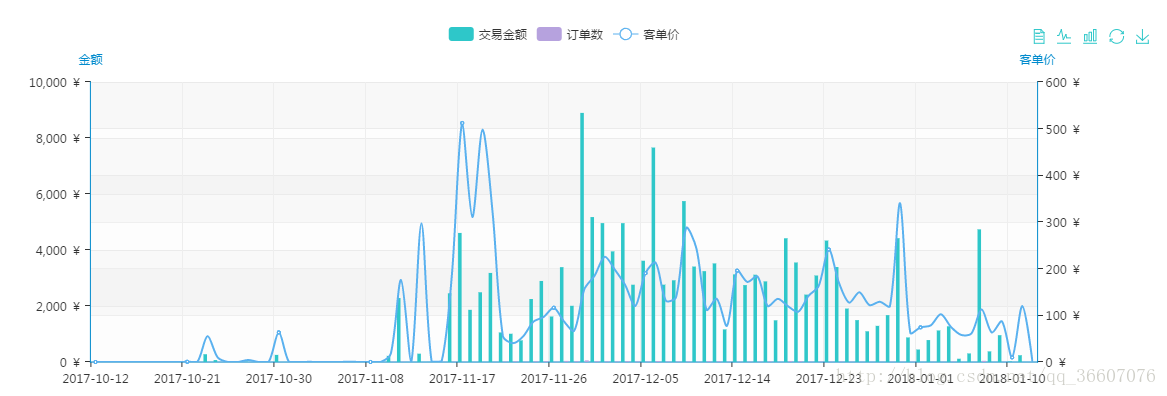


 2492
2492

 被折叠的 条评论
为什么被折叠?
被折叠的 条评论
为什么被折叠?
 到【灌水乐园】发言


