


项目场景:
通过uniapp编写echart 由于dom无法操作 所以一直无法显示 自己也尝试很多案例 也试了Uechart 感觉还是用原生的echart 爽 废了九牛二虎 终于整完 借鉴这位大大神的文章;我终于能用上 但是我发现地图还是不行 所以我研究了下 改了下代码 终于成功
解决方案:
1、创建echart.vue 这是个组件
<template>
	<!-- 新的:接口对其了H5 -->
	<view class="content" :style="{height,width}">
		<!-- #ifdef APP-PLUS || H5 -->
		<view @click="echarts.onClick" :rOption="rOption" :change:rOption="echarts.messageChanged"
			style="height: 100%;width: 100%;" :prop="option" :change:prop="echarts.updateEcharts" :id="canvasId"></view>
		<!-- #endif -->
		<!-- #ifndef APP-PLUS || H5 -->
		<canvas style="height: 100%;width: 100%;" type="2d" class="ec-canvas" :canvas-id="canvasId" :id="canvasId"
			:ref="canvasId" bindinit="init" @touchstart="ec.disableTouch ? '' : 'touchStart'"
			@touchmove="ec.disableTouch ? '' : 'touchMove'" @touchend="ec.disableTouch ? '' : 'touchEnd'"></canvas>
		<!-- #endif -->

	</view>
</template>

<script>
	class MlCanvas {
		constructor(ctx, canvasId, isNew, canvasNode) {
			this.ctx = ctx;
			this.canvasId = canvasId;
			this.chart = null;
			this.isNew = isNew
			if (isNew) {
				this.canvasNode = canvasNode;
			}


			this._initStyle(ctx)
			this._initEvent();
		}

		getContext(contextType) {
			if (contextType === '2d') {
				return this.ctx;
			} else {
				return this.ctx
			}
		}
		addEventListener() {

		}

		setChart(chart) {
			this.chart = chart;
		}

		attachEvent() {
			// noop
		}

		detachEvent() {
			// noop
		}

		_initCanvas(zrender, ctx) {
			console.log(zrender, ctx, 111)
			zrender.util.getContext = function() {
				return ctx;
			};

			zrender.util.$override('measureText', function(text, font) {
				ctx.font = font || '12px sans-serif';
				return ctx.measureText(text);
			});
		}

		_initStyle(ctx) {

			ctx.createRadialGradient = () => {
				return ctx.createCircularGradient(arguments);
			};
		}

		_initEvent() {
			this.event = {};
			const eventNames = [{
				wxName: 'touchStart',
				ecName: 'mousedown'
			}, {
				wxName: 'touchMove',
				ecName: 'mousemove'
			}, {
				wxName: 'touchEnd',
				ecName: 'mouseup'
			}, {
				wxName: 'touchEnd',
				ecName: 'click'
			}];

			eventNames.forEach(name => {
				this.event[name.wxName] = e => {
					const touch = e.touches[0];
					this.chart.getZr().handler.dispatch(name.ecName, {
						zrX: name.wxName === 'tap' ? touch.clientX : touch.x,
						zrY: name.wxName === 'tap' ? touch.clientY : touch.y
					});
				};
			});
		}

		set width(w) {
			if (this.canvasNode) this.canvasNode.width = w
		}
		set height(h) {
			if (this.canvasNode) this.canvasNode.height = h
		}

		get width() {
			if (this.canvasNode)
				return this.canvasNode.width
			return 0
		}
		get height() {
			if (this.canvasNode)
				return this.canvasNode.height
			return 0
		}
	}

	// #ifndef APP-PLUS || H5
	import * as echarts from 'echarts';
	// #endif

	let ctx;
	let chart;

	function wrapTouch(event) {
		for (let i = 0; i < event.touches.length; ++i) {
			const touch = event.touches[i];
			touch.offsetX = touch.x;
			touch.offsetY = touch.y;
		}
		return event;
	}
	export default {
		props: {
			canvasId: {
				type: String,
				default: 'ec-canvas',
			},
			ec: {
				type: Object,
				default: () => ({}),
			},
			option: {
				type: Object,
			},

			width: {
				type: String,
				default: '100%',
			},
			height: {
				type: String,
				default: '500rpx',
			},
		},
		computed: {
			eOption() {
				return JSON.stringify(this.option);
			},
		},
		data() {
			return {
				isUseNewCanvas: true,
				rOption: null,
				// chart: null,
			};
		},

		mounted() {
			// #ifdef APP-PLUS || H5
			this.$nextTick(() => {
				this.rOption = {
					canvasId: this.canvasId,
					...this.option,
				};
			});
			//  #endif
			// #ifndef APP-PLUS || H5

			this.$nextTick(() => {
				echarts.registerPreprocessor((option) => {
					if (option && option.series) {
						if (option.series.length > 0) {
							option.series.forEach((series) => {
								series.progressive = 0;
							});
						} else if (typeof option.series === 'object') {
							option.series.progressive = 0;
						}
					}

				});
				this.init();
			});
			// #endif
		},
		methods: {
			init(callback) {
				this.initByNewWay(callback);
			},
			initChart(canvas, width, height, dpr) {
				chart = echarts.init(canvas, null, {
					width: width,
					height: height,
					devicePixelRatio: dpr, // 像素
				});
				canvas.setChart(chart);
				chart.setOption(this.option);
				return chart;
			},
			initByNewWay(callback) {
				// version >= 2.9.0:使用新的方式初始化
				const query = uni.createSelectorQuery().in(this);
				query
					.select('.ec-canvas')
					.fields({
						node: true,
						size: true,
						context: true,
					})
					.exec((res) => {
						let targetNode;
						if (res[0].node) {
							//兼容微信小程序,2.7以上版本
							targetNode = res[0].node;
						} else {
							//兼容h5
							const parentNode = this.$refs[this.canvasId].$el;
							targetNode = parentNode.getElementsByTagName('canvas')[0];
						}
						const canvasDpr = uni.getSystemInfoSync().pixelRatio;
						// targetNode = res[0].context._context.canvas

						const canvasNode = targetNode;
						const canvasWidth = res[0].width;
						const canvasHeight = res[0].height;

						const ctx = canvasNode.getContext('2d');

						const canvas = new MlCanvas(ctx, this.canvasId, true, canvasNode);
						echarts.setCanvasCreator(() => {
							return canvas;
						});
						if (typeof callback === 'function') {
							this.chart = callback(canvas, canvasWidth, canvasHeight, canvasDpr);
						} else if (this.option) {
							this.initChart(canvas, canvasWidth, canvasHeight, canvasDpr);
							// this.chart = this.ec.onInit(canvas, canvasWidth, canvasHeight, canvasDpr)
						} else {
							this.triggerEvent('init', {
								canvas: canvas,
								width: canvasWidth,
								height: canvasHeight,
								dpr: canvasDpr,
							});
						}
					});
			},

			touchStart(e) {},
			setOption(option) {
				// #ifndef APP-PLUS || H5
				chart.setOption(option);
				//  #endif
				// #ifdef APP-PLUS || H5
				this.rOption = {
					...option
				};
				//  #endif
			},
			touchMove(e) {},
			touchEnd(e) {},

			onViewClick(e) {},
		},
	};
</script>


<script module="echarts" lang="renderjs">
	// #ifdef  APP-PLUS || H5
	import * as echarts from 'echarts'


	let myChart
	export default {
		data() {
			return {
				Coption: null,
				CcanvasId: null,
				// chart: null
			}
		},
		mounted() {
			// #ifdef  APP-PLUS || H5
			// this.$nextTick(() => {
			// 	this.initl()
			// })
			// #endif

		},
		methods: {

			initl() {
				console.log('app&H5')
			},
			initEcharts() {
				myChart = echarts.init(document.getElementById(this.CcanvasId))
				myChart.showLoading({
					text: '数据加载中...',
					color: '#c23531',
					textColor: '#ffffc2',
					maskColor: 'rgba(255, 255, 255, 0)',
				});
				// 观测更新的数据在 view 层可以直接访问到
				myChart && myChart.setOption(this.Coption)
			},
			updateEcharts(newValue, oldValue, ownerInstance, instance) {

				if (newValue.inclass) {
					echarts.registerMap(newValue.inclass.name, newValue.inclass.source);
				}
				myChart = echarts.init(document.getElementById(this.CcanvasId))
				// 监听 service 层数据变更

				myChart && myChart.setOption(newValue, true)
				myChart && myChart.hideLoading()

			},
			onClick(event, ownerInstance) {
				// 调用 service 层的方法
				ownerInstance.callMethod('onViewClick', {
					test: 'test'
				})
			},
			messageChanged(newVal, oldVal, ins, vm) {
				if (newVal.canvasId) {
					this.CcanvasId = newVal.canvasId
					delete newVal.canvasId
					this.Coption = newVal

					this.initEcharts()
				} else {

					myChart = echarts.init(document.getElementById(this.CcanvasId))

					myChart && myChart.setOption(newVal)
				}

			}
		}
	}
	// #endif
</script>


<style scoped>
	.ec-canvas {
		width: 100%;
		height: 100%;
	}
</style>
2、只需要引入此组件,传入 ehcarts 文档 option 配置,并命名 id 即可yui
<mlEcharts :option="option" canvasId="mlEcharts"></mlEcharts>
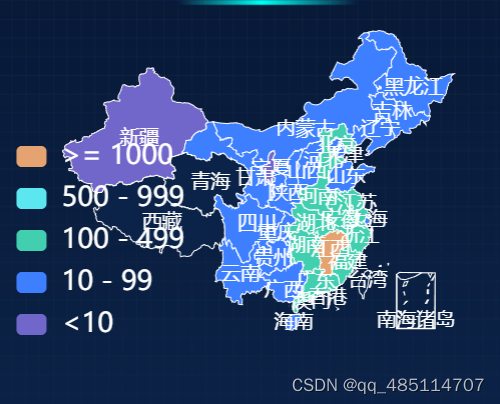
import mlEcharts from "@/components/echart.vue";引入地图文件(我这是中国地图 也可以根据你的需求引入你的json文件 也可以动态引入不同省份)
import chinaData from '@/static/json/china.json'; 在option配置中加入 以下参数
inclass:{
name:"china",
source:chinaData
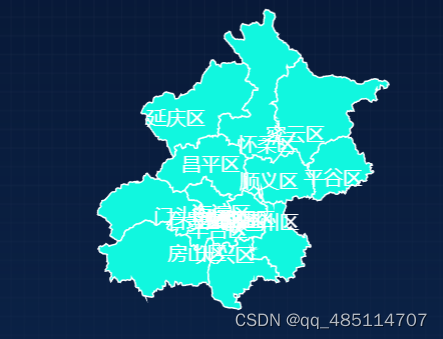
}运行 就得到地图啦 亲测H5 app有效
这是省份地图


 被折叠的 条评论
为什么被折叠?
被折叠的 条评论
为什么被折叠?
 到【灌水乐园】发言


