


这是目标样式

最后在echarts管理台的样子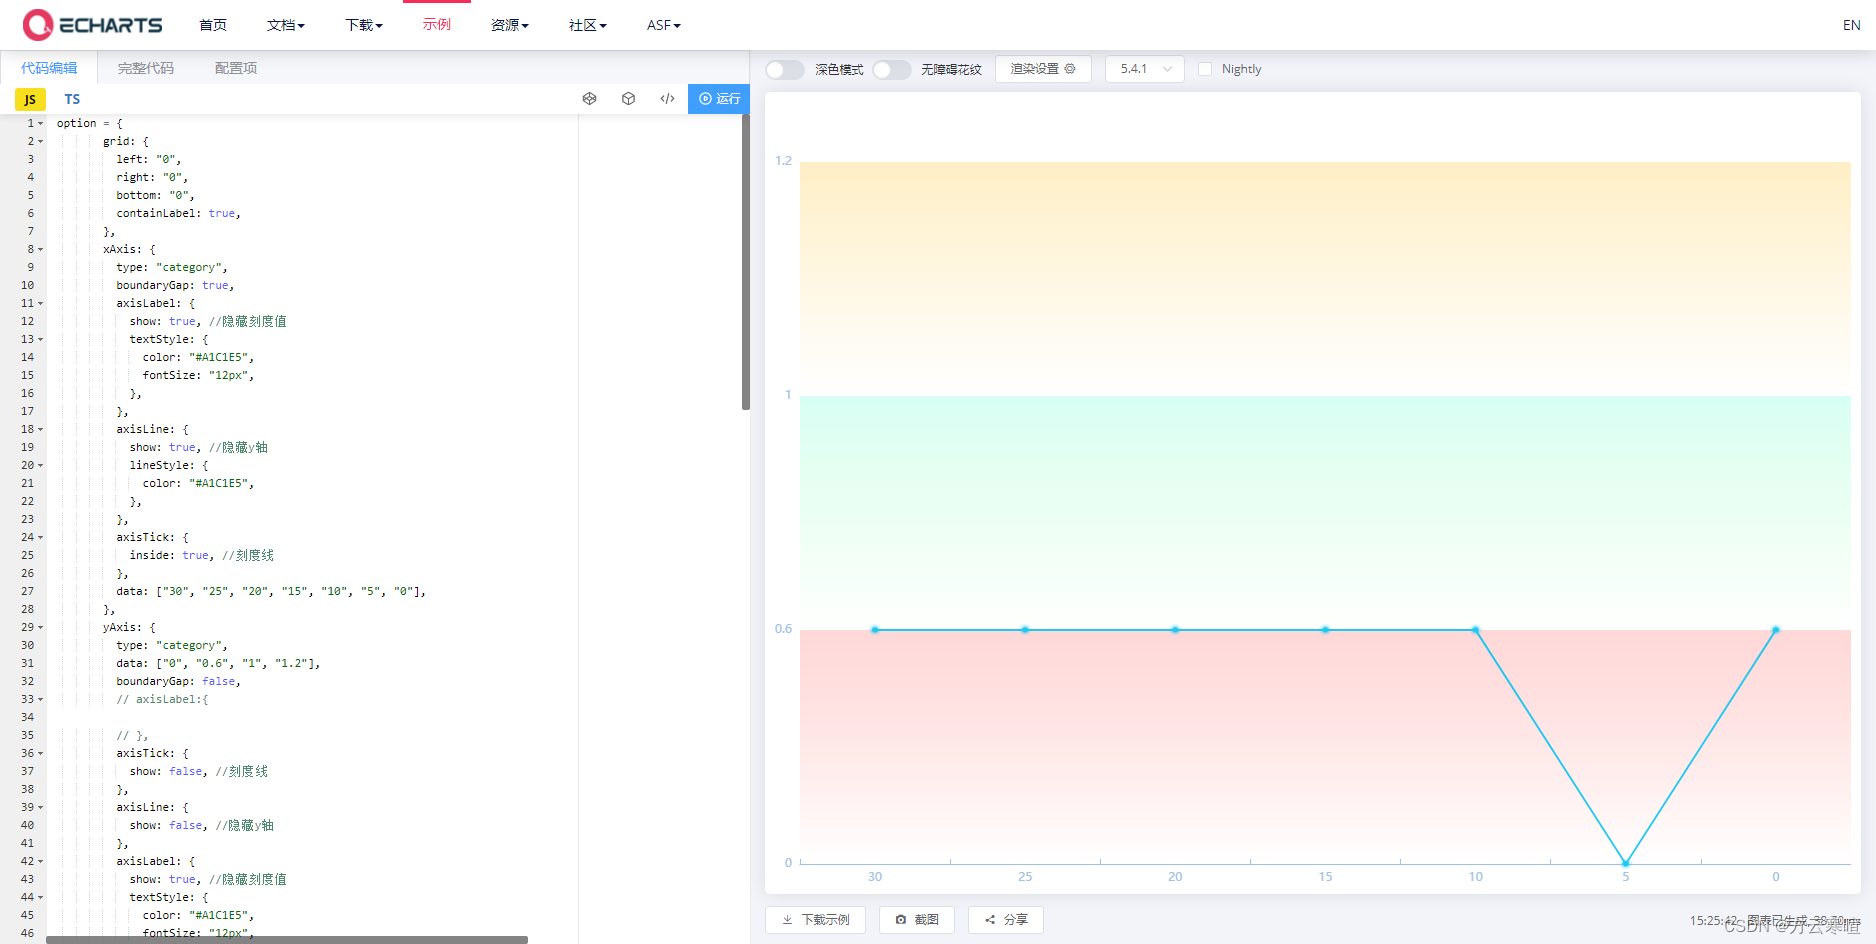
最后附上代码。配置参数如下
 let option = {
        grid: {
          left: "0",
          right: "0",
          bottom: "0",
          containLabel: true,
        },
        xAxis: {
          type: "category",
          boundaryGap: true,
          axisLabel: {
            show: true, //隐藏刻度值
            textStyle: {
              color: "#A1C1E5",
              fontSize: "12px",
            },
          },
          axisLine: {
            show: true, //隐藏轴
            lineStyle: {
              color: "#A1C1E5",
            },
          },
          axisTick: {
            inside: true, //刻度线
          },
          data: ["30", "25", "20", "15", "10", "5", "0"],
        },
        yAxis: {
          type: "category",
          data: ["0", "0.6", "1", "1.2"],
          boundaryGap: false,
          // axisLabel:{

          // },
          axisTick: {
            show: false, //刻度线
          },
          axisLine: {
            show: false, //隐藏轴
          },
          axisLabel: {
            show: true, //隐藏刻度值
            textStyle: {
              color: "#A1C1E5",
              fontSize: "12px",
            },
          },
        },
        series: [
          {
            symbol:
              "image://https://lyzw-public.obs.cn-east-3.myhuaweicloud.com/companyId/74/2023/03/22/点-cc720fec-92f4-46da-bba3-914914da3609.png", //上同
            symbolSize: 12,
            data: [0.5, 0.5, 0.5, 0.5, 0.5, 0.36, 0.5],
            type: "line",
            lineStyle: {
              color: "#20C7EF",
            },
            /*折线图线下面带渐变
            areaStyle: {
                normal: {
                    color: {
                        type: "linear",
                        x: 0,
                        y: 0,
                        x2: 0,
                        y2: 1,
                        colorStops: [
                            {
                                offset: 0,
                                color: "rgba(7,220,159,0.4)", // 0% 处的颜色
                            },
                            {
                                offset: 1,
                                color: "rgba(7,220,159,0)", // 100% 处的颜色
                            },
                        ],
                        global: false, // 缺省为 false
                    },
                },
            },*/

            markArea: {
              //区域划分
              data: [
                [
                  {
                    yAxis: "0",
                    itemStyle: {
                      color: new echarts.graphic.LinearGradient(0, 0, 0, 1, [
                        {
                          offset: 0,
                          color: "rgba(255, 156, 156, 0.4)",
                        },
                        {
                          offset: 1,
                          color: "rgba(255, 127, 127, 0)",
                        },
                      ]),
                    },
                  },
                  {
                    yAxis: "0.6",
                  },
                ],
                [
                  {
                    yAxis: "0.6",
                    itemStyle: {
                      color: new echarts.graphic.LinearGradient(0, 0, 0, 1, [
                        {
                          offset: 0,
                          color: "rgba(143, 241, 206, 0.4)",
                        },
                        {
                          offset: 1,
                          color: "rgba(143, 241, 153, 0)",
                        },
                      ]),
                    },
                  },
                  {
                    yAxis: "1",
                  },
                ],
                [
                  {
                    yAxis: "1",
                    itemStyle: {
                      color: new echarts.graphic.LinearGradient(0, 0, 0, 1, [
                        {
                          offset: 0,
                          color: "rgba(254, 214, 110, 0.4)",
                        },
                        {
                          offset: 1,
                          color: "rgba(249, 214, 125, 0)",
                        },
                      ]),
                    },
                  },
                  {
                    yAxis: "1.2",
                  },
                ],
              ],
            },
          },
        ],
      };


 624
624


 被折叠的 条评论
为什么被折叠?
被折叠的 条评论
为什么被折叠?
 到【灌水乐园】发言


