


云端工业物联网生态组件 - 工厂能效与预测维护 (模拟)
概述
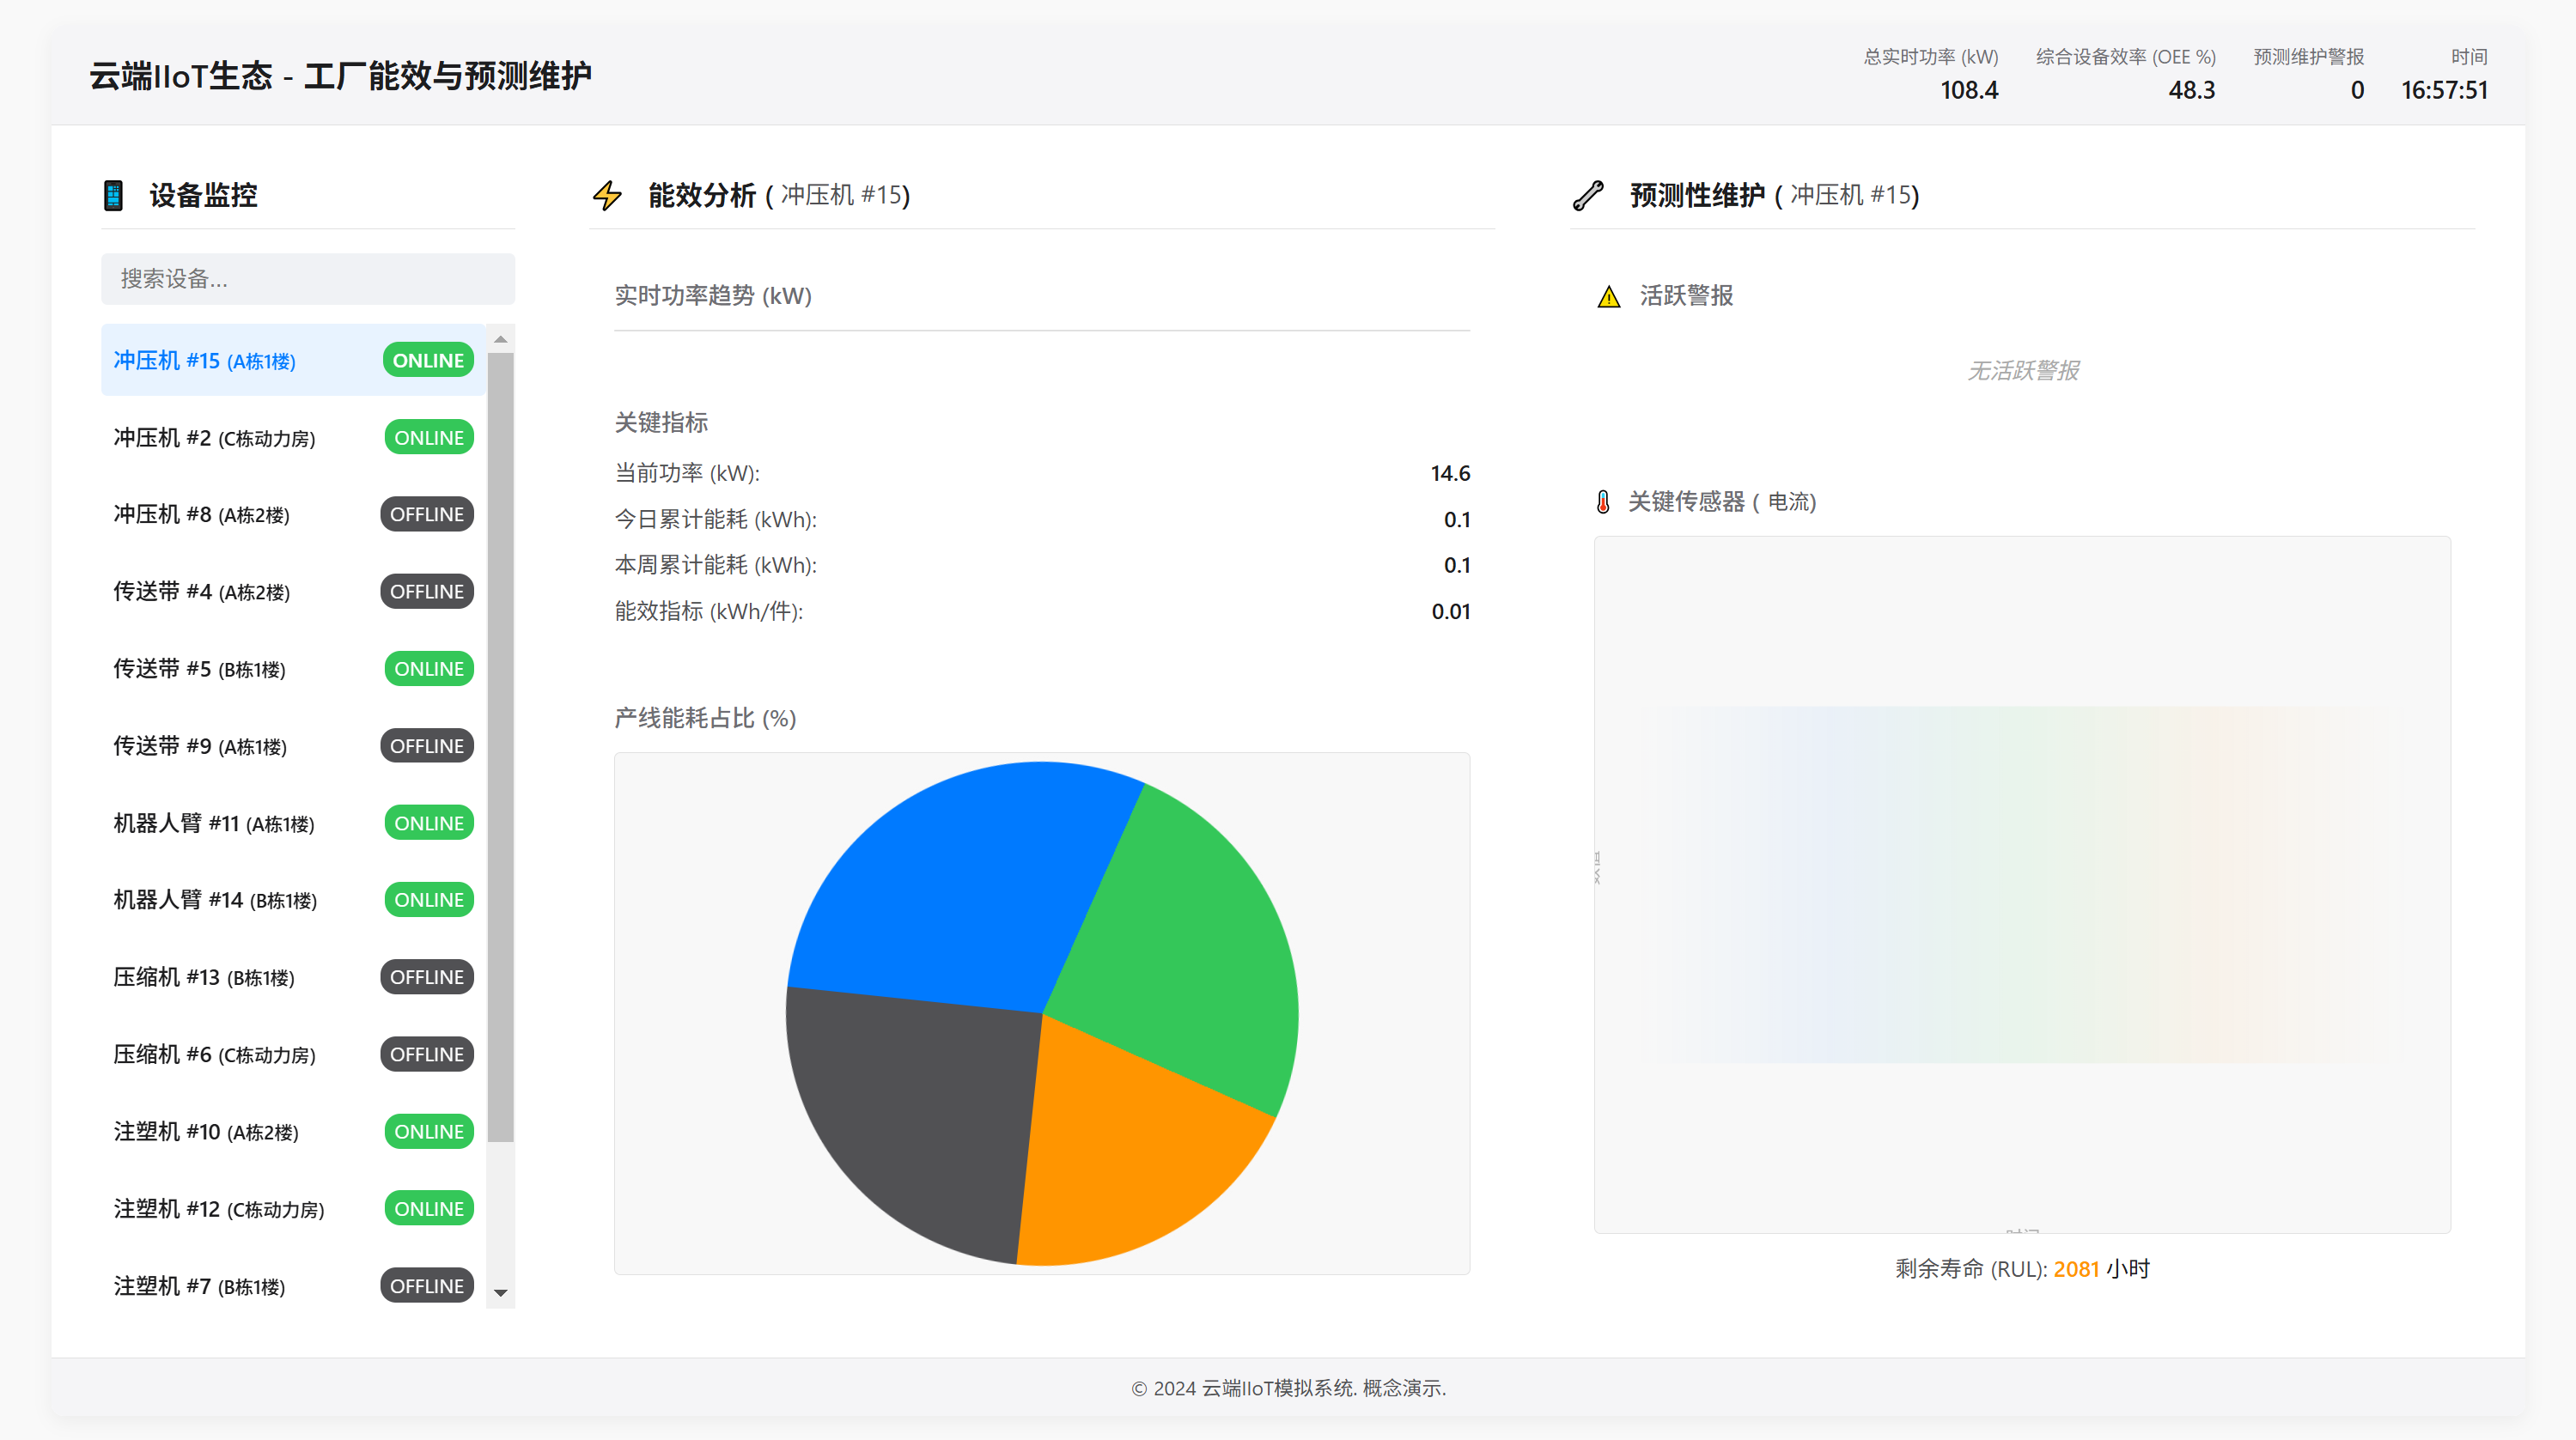
这是一个交互式的 Web 组件,旨在模拟一个云端工业物联网 (IIoT) 平台的核心界面,专注于工厂层面的能效分析和基于传感器数据的预测性维护概念。用户可以监控模拟的设备状态,查看全局或单个设备的能耗指标,并观察预测性维护警报的生成。
请注意:这是一个高度简化的前端模拟演示,不连接任何真实的云平台或物理设备。所有数据、状态变化、警报和预测都是在浏览器端模拟生成的。
主要功能
- 设备监控列表:
- 展示工厂内的模拟设备列表(如 CNC、冲压机、机器人臂等)。
- 显示每个设备的实时状态(在线、离线、警告、错误),状态会动态变化。
- 提供搜索功能,可以按设备名称、类型、位置或 ID 过滤列表。
- 全局 KPI 概览: 页眉实时显示工厂级的关键绩效指标 (KPI),包括:
- 总实时功率 (kW)
- 综合设备效率 (OEE %)
- 活跃的预测性维护警报数量
- 能效分析面板:
- 默认显示全局能耗信息。
- 当选择某个设备时,切换显示该单个设备的能耗信息。
- 展示关键指标:当前功率、今日累计能耗、本周累计能耗、能效指标 (kWh/件,模拟计算)。
- 包含模拟的实时功率趋势图和产线能耗占比饼图(占位符)。
- 预测性维护面板:
- 当选择某个设备时,显示该设备的预测性维护相关信息。
- 活跃警报列表: 显示针对该设备的警告(如传感器值偏高、RUL 低)或错误(传感器值异常)信息,包含警报级别、消息和时间戳。
- 关键传感器信息: 显示模拟的传感器类型(如振动、温度)、模拟的传感器数值趋势图(占位符)以及最重要的预估剩余使用寿命 (RUL) (小时)。
- 动态模拟:
- 设备状态(在线/离线/警告/错误)会基于模拟的传感器读数和随机事件动态变化。
- 能耗数据(功率、累计能耗)会根据设备状态和模拟逻辑实时更新。
- 预测性警报会根据模拟的传感器值和 RUL 阈值动态生成。
- 界面风格: 采用苹果科技风格,简洁、直观,三栏布局并支持响应式设计,适应不同屏幕尺寸。
如何使用
- 打开页面: 在浏览器中打开
index.html。 - 查看全局状态: 默认加载后,页面显示工厂的全局 KPI 和全局能效数据。
- 监控设备: 在左侧"设备监控"列表中查看所有模拟设备及其当前状态。
- 搜索设备: 使用列表上方的搜索框输入关键字(名称、类型、位置、ID)来快速查找特定设备。
- 选择设备: 点击设备列表中的任意一项:
- 该项会高亮显示。
- 中间的"能效分析"面板会更新,显示该设备的能耗数据。
- 右侧的"预测性维护"面板会更新,显示该设备的活跃警报、传感器类型和预估 RUL。
- 取消选择: 再次点击已选中的设备项,将取消选择,面板恢复显示全局信息或占位符。
- 观察动态变化: 页面上的数据(KPI、设备状态、能耗、警报、RUL)会随时间自动更新,模拟工厂的动态运行。
模拟细节
- 设备数据: 组件初始化时会生成一组包含不同类型、位置和传感器配置的模拟设备。
- 状态变化: 设备的在线/离线状态会随机改变。警告/错误状态主要由模拟的传感器读数决定。当传感器读数超过预设的警告或错误阈值时,状态会改变;当读数回落后,有一定几率恢复为在线状态。
- 能耗模拟: 在线设备的功率会在一个基础值附近随机波动。累计能耗根据功率和时间间隔累加。生产件数也是随机模拟的,用于计算简单的能效指标。
- 传感器模拟: 每个设备关联一个模拟的关键传感器(类型随机)。其读数值会波动,且当 RUL 较低时,读数值偏高的可能性更大。
- RUL 模拟: 每个设备的 RUL 会随时间线性递减。这是预测性维护的核心输入之一。
- 警报生成: 当模拟的传感器值超过警告或错误阈值,或者 RUL 低于特定阈值(如 100 小时)时,会生成对应的预测性维护警报。
- OEE 模拟: 这是一个非常简化的 OEE 计算,主要基于在线设备比例、模拟的生产效率和有问题的设备比例。
文件结构
数据与物联网组件/cloud-iiot-factory-analysis/
├── index.html         # 组件的 HTML 结构
├── styles.css         # 组件的 CSS 样式 (苹果风格, 三栏响应式布局)
├── script.js          # 组件的 JavaScript 逻辑 (模拟数据, 状态更新, 交互)
└── README.md          # 本说明文件
技术栈
- HTML5
- CSS3 (使用了 CSS 变量, Grid 布局, Flexbox, 媒体查询)
- JavaScript (原生 JS, 无外部库依赖)
效果展示
源码
index.html
<!DOCTYPE html>
<html lang="zh-CN">
<head>
<meta charset="UTF-8">
<meta name="viewport" content="width=device-width, initial-scale=1.0">
<title>云IIoT - 工厂能效与预测维护</title>
<link rel="stylesheet" href="styles.css">
<!-- Placeholder for potential charting library -->
</head>
<body>
<div class="iiot-ecosystem-container">
<header class="main-header">
<h1>云端IIoT生态 - 工厂能效与预测维护</h1>
<div class="header-kpis">
<div class="kpi-item">
<span class="kpi-label">总实时功率 (kW)</span>
<span class="kpi-value" id="totalPower">--</span>
</div>
<div class="kpi-item">
<span class="kpi-label">综合设备效率 (OEE %)</span>
<span class="kpi-value" id="overallOEE">--</span>
</div>
<div class="kpi-item">
<span class="kpi-label">预测维护警报</span>
<span class="kpi-value alert" id="predictiveAlertsCount">0</span>
</div>
<div class="kpi-item">
<span class="kpi-label">时间</span>
<span class="kpi-value" id="currentTime">--:--:--</span>
</div>
</div>
</header>
<main class="main-content">
<!-- Column 1: Device List & Status -->
<aside class="device-list-panel">
<h2><i class="icon icon-device"></i> 设备监控</h2>
<div class="toolbar">
<input type="search" id="deviceSearch" placeholder="搜索设备...">
</div>
<ul id="deviceList" class="device-list">
<!-- Device items populated by JS -->
<li class="placeholder">加载设备列表中...</li>
</ul>
</aside>
<!-- Column 2: Energy Efficiency Analysis -->
<section class="energy-analysis-panel">
<h2><i class="icon icon-energy"></i> 能效分析 (<span id="selectedDeviceEnergy">全局</span>)</h2>
<div class="analysis-grid">
<div class="chart-widget">
<h3>实时功率趋势 (kW)</h3>
<div class="chart-placeholder" id="powerTrendChart">
<div class="fake-chart energy-trend"></div>
<span class="chart-axis-label y-axis">功率 (kW)</span>
<span class="chart-axis-label x-axis">时间</span>
</div>
</div>
<div class="stats-widget">
<h3>关键指标</h3>
<div class="stats-list">
<div class="stat-item"><span>当前功率 (kW):</span> <strong id="currentPower">--</strong></div>
<div class="stat-item"><span>今日累计能耗 (kWh):</span> <strong id="todayEnergy">--</strong></div>
<div class="stat-item"><span>本周累计能耗 (kWh):</span> <strong id="weekEnergy">--</strong></div>
<div class="stat-item"><span>能效指标 (kWh/件):</span> <strong id="efficiencyMetric">--</strong></div>
</div>
</div>
<div class="chart-widget">
<h3>产线能耗占比 (%)</h3>
<div class="chart-placeholder" id="energyDistributionChart">
<div class="fake-chart energy-pie"></div>
</div>
</div>
</div>
</section>
<!-- Column 3: Predictive Maintenance -->
<section class="predictive-maintenance-panel">
<h2><i class="icon icon-predictive"></i> 预测性维护 (<span id="selectedDeviceMaintenance">--</span>)</h2>
<div class="maintenance-content">
<div class="alerts-widget">
<h3><i class="icon icon-alert"></i> 活跃警报</h3>
<ul id="alertList" class="alert-list">
<li class="placeholder">无活跃警报</li>
<!-- Alerts populated by JS -->
</ul>
</div>
<div class="sensors-widget">
<h3><i class="icon icon-sensor"></i> 关键传感器 (<span id="selectedSensorType">--</span>)</h3>
<div class="chart-placeholder" id="sensorTrendChart">
<div class="fake-chart sensor-trend"></div>
<span class="chart-axis-label y-axis">数值</span>
<span class="chart-axis-label x-axis">时间</span>
</div>
<div class="sensor-details">
<span>剩余寿命 (RUL): </span><strong id="rulEstimate">--</strong> 小时
</div>
</div>
</div>
</section>
</main>
<footer class="main-footer">
<p>© 2024 云端IIoT模拟系统. 概念演示.</p>
</footer>
</div>
<script src="script.js"></script>
</body>
</html>
styles.css
:root {
    --bg-color-light: #f9f9f9;
    --bg-color-container: #ffffff;
    --header-bg: #f5f5f7; /* Apple-like light grey */
    --panel-bg: #ffffff;
    --border-color: #e1e1e1;
    --text-primary: #1d1d1f;
    --text-secondary: #515154;
    --text-label: #6e6e73;
    --accent-blue: #007aff;
    --accent-green: #34c759;
    --accent-orange: #ff9500;
    --accent-red: #ff3b30;
    --kpi-value-color: var(--text-primary);
    --kpi-alert-color: var(--accent-red);
    --list-item-hover-bg: #f0f0f0;
    --list-item-selected-bg: #e8f3ff;
    --list-item-selected-text: var(--accent-blue);
    --input-bg: #f0f2f5;
    --input-border: transparent;
    --input-focus-border: var(--accent-blue);
    --placeholder-text: #aaaaaa;
    --chart-placeholder-bg: #f8f8f8;
    --chart-axis-color: #b0b0b0;
    --shadow-color: rgba(0, 0, 0, 0.05);
    --font-family: -apple-system, BlinkMacSystemFont, "Segoe UI", Roboto, Helvetica, Arial, sans-serif;
    --border-radius: 8px;
    --border-radius-small: 4px;
    --transition-speed: 0.2s;
}

* {
    box-sizing: border-box;
    margin: 0;
    padding: 0;
}

body {
    font-family: var(--font-family);
    background-color: var(--bg-color-light);
    color: var(--text-primary);
    line-height: 1.4;
    overflow-x: hidden;
}

.iiot-ecosystem-container {
    max-width: 1600px;
    margin: 1rem auto;
    background-color: var(--bg-color-container);
    border-radius: var(--border-radius);
    box-shadow: 0 4px 12px var(--shadow-color);
    overflow: hidden;
    display: flex;
    flex-direction: column;
    height: calc(100vh - 2rem); /* Limit height */
    min-height: 700px; /* Minimum reasonable height */
}

/* Header */
.main-header {
    background-color: var(--header-bg);
    padding: 0.75rem 1.5rem;
    border-bottom: 1px solid var(--border-color);
    flex-shrink: 0;
    display: flex;
    justify-content: space-between;
    align-items: center;
}

.main-header h1 {
    font-size: 1.3rem;
    font-weight: 600;
    color: var(--text-primary);
}

.header-kpis {
    display: flex;
    align-items: center;
    gap: 1.5rem;
}

.kpi-item {
    display: flex;
    flex-direction: column;
    align-items: flex-end;
}

.kpi-label {
    font-size: 0.75rem;
    color: var(--text-label);
    margin-bottom: 0.1rem;
}

.kpi-value {
    font-size: 1rem;
    font-weight: 600;
    color: var(--kpi-value-color);
}

.kpi-value.alert {
    color: var(--kpi-alert-color);
    font-weight: 700;
}

/* Main Content Layout */
.main-content {
    flex-grow: 1;
    padding: 1rem;
    overflow: hidden;
    display: grid;
    grid-template-columns: 300px 1fr 1fr; /* Device List | Energy | Predictive */
    gap: 1rem;
}

/* Panels */
.device-list-panel,
.energy-analysis-panel,
.predictive-maintenance-panel {
    background-color: var(--panel-bg);
    /* border: 1px solid var(--border-color); */ /* Optional border */
    border-radius: var(--border-radius);
    padding: 1rem;
    display: flex;
    flex-direction: column;
    overflow: hidden;
}

/* Panel Headers */
.device-list-panel h2,
.energy-analysis-panel h2,
.predictive-maintenance-panel h2 {
    font-size: 1.1rem;
    font-weight: 600;
    margin-bottom: 1rem;
    padding-bottom: 0.6rem;
    border-bottom: 1px solid var(--border-color);
    display: flex;
    align-items: center;
    color: var(--text-primary);
    flex-shrink: 0;
}

.device-list-panel h2 .icon,
.energy-analysis-panel h2 .icon,
.predictive-maintenance-panel h2 .icon {
    margin-right: 0.6rem;
    color: var(--accent-blue);
}

.energy-analysis-panel h2 span,
.predictive-maintenance-panel h2 span {
    font-weight: normal;
    font-size: 0.9em;
    color: var(--text-secondary);
    margin-left: 0.3rem;
}

/* Device List Panel */
.device-list-panel .toolbar {
    margin-bottom: 0.75rem;
    flex-shrink: 0;
}

#deviceSearch {
    width: 100%;
    padding: 0.5rem 0.75rem;
    font-size: 0.9rem;
    border: 1px solid var(--input-border);
    background-color: var(--input-bg);
    border-radius: var(--border-radius-small);
    outline: none;
    transition: border-color var(--transition-speed), box-shadow var(--transition-speed);
}

#deviceSearch:focus {
    border-color: var(--input-focus-border);
    box-shadow: 0 0 0 2px rgba(0, 122, 255, 0.2);
}

.device-list {
    list-style: none;
    overflow-y: auto;
    flex-grow: 1;
}

.device-item {
    padding: 0.75rem 0.5rem;
    margin-bottom: 0.2rem;
    border-radius: var(--border-radius-small);
    cursor: pointer;
    transition: background-color var(--transition-speed);
    display: flex;
    justify-content: space-between;
    align-items: center;
    font-size: 0.9rem;
}

.device-item:hover {
    background-color: var(--list-item-hover-bg);
}

.device-item.selected {
    background-color: var(--list-item-selected-bg);
    color: var(--list-item-selected-text);
    font-weight: 500;
}

.device-item .device-name {
    font-weight: 500;
}

.device-status {
    font-size: 0.8rem;
    padding: 0.15rem 0.4rem;
    border-radius: 10px;
    color: white;
}

.device-status.online {
    background-color: var(--accent-green);
}

.device-status.offline {
    background-color: var(--text-secondary);
}

.device-status.warning {
    background-color: var(--accent-orange);
}

.device-status.error {
    background-color: var(--accent-red);
}

/* Energy Analysis Panel */
.energy-analysis-panel .analysis-grid {
    display: grid;
    grid-template-columns: 1fr; /* Single column for now, could be 2 */
    grid-template-rows: auto auto 1fr;
    gap: 1rem;
    flex-grow: 1;
    overflow-y: auto;
}

.chart-widget, .stats-widget {
    background-color: #fff; /* Slightly different bg if needed */
    /* border: 1px solid var(--border-color); */
    border-radius: var(--border-radius-small);
    padding: 1rem;
}

.chart-widget h3, .stats-widget h3 {
    font-size: 0.95rem;
    font-weight: 500;
    margin-bottom: 0.75rem;
    color: var(--text-label);
}

.stats-list {
    display: flex;
    flex-direction: column;
    gap: 0.6rem;
}

.stat-item {
    font-size: 0.9rem;
    display: flex;
    justify-content: space-between;
}

.stat-item span {
    color: var(--text-secondary);
}

.stat-item strong {
    font-weight: 600;
    color: var(--kpi-value-color);
}

/* Predictive Maintenance Panel */
.predictive-maintenance-panel .maintenance-content {
    display: grid;
    grid-template-rows: auto 1fr; /* Alerts list then sensor */
    gap: 1rem;
    flex-grow: 1;
    overflow-y: auto;
}

.alerts-widget, .sensors-widget {
    background-color: #fff;
    border-radius: var(--border-radius-small);
    padding: 1rem;
}

.alerts-widget h3, .sensors-widget h3 {
    font-size: 0.95rem;
    font-weight: 500;
    margin-bottom: 0.75rem;
    color: var(--text-label);
    display: flex;
    align-items: center;
}

.alerts-widget h3 .icon, .sensors-widget h3 .icon {
    margin-right: 0.4rem;
    font-size: 0.9em;
}

.sensors-widget h3 span {
     font-weight: normal;
    font-size: 0.9em;
    color: var(--text-secondary);
    margin-left: 0.3rem;
}

.alert-list {
    list-style: none;
    max-height: 150px; /* Limit alert list height */
    overflow-y: auto;
}

.alert-item {
    padding: 0.5rem 0;
    border-bottom: 1px dashed var(--border-color);
    font-size: 0.85rem;
    display: flex;
    align-items: center;
    gap: 0.5rem;
}

.alert-item:last-child {
    border-bottom: none;
}

.alert-icon {
    flex-shrink: 0;
    font-size: 1.1em;
}
.alert-icon.warning { color: var(--accent-orange); }
.alert-icon.error { color: var(--accent-red); }

.alert-message {
    flex-grow: 1;
}

.alert-time {
    font-size: 0.75rem;
    color: var(--text-secondary);
    flex-shrink: 0;
}

.sensors-widget {
    display: flex;
    flex-direction: column;
}

.sensors-widget .chart-placeholder {
    flex-grow: 1; /* Let chart take available space */
    min-height: 150px;
}

.sensor-details {
    margin-top: 0.75rem;
    font-size: 0.9rem;
    text-align: center;
    flex-shrink: 0;
}

.sensor-details span {
    color: var(--text-secondary);
}

.sensor-details strong {
     font-weight: 600;
    color: var(--accent-orange); /* Highlight RUL */
}

/* Chart Placeholders */
.chart-placeholder {
    background-color: var(--chart-placeholder-bg);
    border-radius: var(--border-radius-small);
    display: flex;
    align-items: center;
    justify-content: center;
    position: relative;
    overflow: hidden;
    border: 1px solid var(--border-color);
}

.chart-axis-label {
    position: absolute;
    font-size: 0.7rem;
    color: var(--chart-axis-color);
    transform: rotate(-90deg);
    white-space: nowrap;
}

.chart-axis-label.y-axis {
    left: -10px;
    top: 50%;
    transform-origin: left top;
}

.chart-axis-label.x-axis {
    bottom: -10px;
    left: 50%;
    transform: translateX(-50%);
}

.fake-chart {
    width: 90%;
    height: 80%;
    position: relative;
}

/* Different fake chart styles */
.fake-chart.energy-trend::after,
.fake-chart.sensor-trend::after {
    content: '';
    position: absolute;
    inset: 0;
    background: linear-gradient(to right, transparent, rgba(0, 122, 255, 0.1), rgba(52, 199, 89, 0.15), rgba(255, 149, 0, 0.1), transparent);
    animation: fakePulse 6s ease-in-out infinite;
    border-radius: 3px;
}

.fake-chart.energy-pie {
    width: 60%;
    height: 0;
    padding-bottom: 60%; /* Make it square */
    border-radius: 50%;
    background: conic-gradient(
        var(--accent-blue) 0% 30%,
        var(--accent-green) 30% 55%,
        var(--accent-orange) 55% 75%,
        var(--text-secondary) 75% 100%
    );
    animation: fakeSpin 20s linear infinite;
    border: 3px solid var(--chart-placeholder-bg);
}

@keyframes fakePulse {
    0%, 100% { transform: scaleY(0.6); opacity: 0.5; }
    50% { transform: scaleY(1); opacity: 0.8; }
}

@keyframes fakeSpin {
    from { transform: rotate(0deg); }
    to { transform: rotate(360deg); }
}

/* Generic Placeholder */
.placeholder {
    color: var(--placeholder-text);
    font-style: italic;
    text-align: center;
    padding: 1rem;
    font-size: 0.9rem;
}

/* Footer */
.main-footer {
    background-color: var(--header-bg); /* Match header */
    padding: 0.6rem 1.5rem;
    text-align: center;
    font-size: 0.8rem;
    color: var(--text-secondary);
    border-top: 1px solid var(--border-color);
    flex-shrink: 0;
}

/* Icons (Basic Placeholders) */
.icon::before {
    display: inline-block;
    font-weight: normal;
    font-style: normal;
    font-variant: normal;
    text-rendering: auto;
    -webkit-font-smoothing: antialiased;
    margin-right: 0.3em;
    /* Consider using a proper icon font like Font Awesome or Material Icons */
}
.icon-device::before { content: "📱"; }
.icon-energy::before { content: "⚡️"; }
.icon-predictive::before { content: "🔧"; }
.icon-alert::before { content: "⚠️"; } /* Warning triangle */
.icon-sensor::before { content: "🌡️"; } /* Thermometer */
.alert-icon.warning::before { content: "🔶"; } /* Orange Diamond */
.alert-icon.error::before { content: "🔴"; } /* Red Circle */

/* Responsive Design */
@media (max-width: 1200px) {
    .main-content {
        grid-template-columns: 250px 1fr 1fr; /* Smaller sidebar */
    }
    .header-kpis { gap: 1rem; }
    .main-header h1 { font-size: 1.15rem; }
    .kpi-label { font-size: 0.7rem; }
    .kpi-value { font-size: 0.9rem; }
}

@media (max-width: 992px) {
    .iiot-ecosystem-container {
        height: auto; /* Allow content to determine height */
        min-height: 100vh;
        margin: 0.5rem;
    }
    .main-content {
        grid-template-columns: 1fr; /* Stack columns */
        grid-template-rows: auto auto auto; /* Let rows size automatically */
        padding: 0.5rem;
        gap: 0.5rem;
    }
    .device-list-panel,
    .energy-analysis-panel,
    .predictive-maintenance-panel {
        padding: 0.75rem;
        overflow-y: visible; /* Allow panels to grow */
    }
    .device-list { max-height: 250px; } /* Limit list height on mobile */
    .alert-list { max-height: 120px; }
    .energy-analysis-panel .analysis-grid,
    .predictive-maintenance-panel .maintenance-content {
        overflow-y: visible;
    }
    .main-header {
        flex-direction: column;
        align-items: flex-start;
        gap: 0.5rem;
        padding: 0.75rem;
    }
    .header-kpis {
        width: 100%;
        justify-content: space-between;
        flex-wrap: wrap;
        gap: 0.5rem 1rem;
    }
    .kpi-item { align-items: flex-start; }
}

@media (max-width: 576px) {
    .main-header h1 { font-size: 1rem; }
    .header-kpis { gap: 0.3rem 0.8rem; }
    .kpi-label { font-size: 0.65rem; }
    .kpi-value { font-size: 0.8rem; }
    .device-list-panel h2,
    .energy-analysis-panel h2,
    .predictive-maintenance-panel h2 {
        font-size: 1rem;
    }
}
script.js
// script.js - Cloud IIoT Factory Analysis Component

document.addEventListener('DOMContentLoaded', () => {
    // --- DOM Elements ---
    const totalPowerEl = document.getElementById('totalPower');
    const overallOEEEl = document.getElementById('overallOEE');
    const predictiveAlertsCountEl = document.getElementById('predictiveAlertsCount');
    const currentTimeEl = document.getElementById('currentTime');
    const deviceSearchInput = document.getElementById('deviceSearch');
    const deviceListUl = document.getElementById('deviceList');
    const selectedDeviceEnergyEl = document.getElementById('selectedDeviceEnergy');
    const currentPowerEl = document.getElementById('currentPower');
    const todayEnergyEl = document.getElementById('todayEnergy');
    const weekEnergyEl = document.getElementById('weekEnergy');
    const efficiencyMetricEl = document.getElementById('efficiencyMetric');
    const selectedDeviceMaintenanceEl = document.getElementById('selectedDeviceMaintenance');
    const alertListUl = document.getElementById('alertList');
    const selectedSensorTypeEl = document.getElementById('selectedSensorType');
    const rulEstimateEl = document.getElementById('rulEstimate');
    // Chart placeholders are mostly for styling in this version
    const powerTrendChartEl = document.getElementById('powerTrendChart');
    const energyDistributionChartEl = document.getElementById('energyDistributionChart');
    const sensorTrendChartEl = document.getElementById('sensorTrendChart');

    // --- Simulation State & Parameters ---
    let simulationTime = new Date();
    let selectedDeviceId = null; // null means global view
    let searchTerm = '';
    let factoryDevices = {}; // Store device data
    let factoryState = {
        totalPower: 0,
        overallOEE: 0,
        alerts: [],
        todayEnergyGlobal: 0,
        weekEnergyGlobal: 0,
    };

    // Update intervals (in ms)
    const timeUpdateInterval = 1000;
    const dataUpdateInterval = 3000; // Update device data less frequently
    const alertCheckInterval = 7000; // Check for new alerts periodically

    // --- Sample Data Generation ---
    function generateSampleDevices(count = 15) {
        const devices = {};
        const types = ['CNC机床', '冲压机', '注塑机', '机器人臂', '传送带', '压缩机'];
        const locations = ['A栋1楼', 'A栋2楼', 'B栋1楼', 'C栋动力房'];
        const sensorTypes = ['振动', '温度', '压力', '电流'];

        for (let i = 1; i <= count; i++) {
            const id = `DEV-${String(i).padStart(3, '0')}`;
            const type = types[Math.floor(Math.random() * types.length)];
            const location = locations[Math.floor(Math.random() * locations.length)];
            devices[id] = {
                id: id,
                name: `${type} #${i}`,
                type: type,
                location: location,
                status: 'offline', // Initial status
                power: 0, // kW
                todayEnergy: 0, // kWh
                weekEnergy: 0, // kWh
                unitsProduced: 0,
                efficiencyMetric: null, // kWh/unit
                sensors: {
                    type: sensorTypes[Math.floor(Math.random() * sensorTypes.length)],
                    value: 0,
                    thresholdWarning: 50 + Math.random() * 20,
                    thresholdError: 80 + Math.random() * 15,
                    rul: 1000 + Math.random() * 2000, // Remaining Useful Life in hours
                },
                alerts: [] // Active alerts for this device
            };
        }
        return devices;
    }

    // --- Initialization ---
    function initializeIIoTMonitor() {
        factoryDevices = generateSampleDevices();
        setupEventListeners();
        updateTime();
        setInterval(updateTime, timeUpdateInterval);

        // Start simulation loops
        updateFactoryData(); // Initial data load
        setInterval(updateFactoryData, dataUpdateInterval);
        setInterval(checkForNewAlerts, alertCheckInterval);

        renderDeviceList(); // Initial render
        displayGlobalEnergyData(); // Show global initially
        displayMaintenanceInfo(); // Show placeholder initially

        console.log("Cloud IIoT Monitor Initialized");
    }

    // --- Event Handlers ---
    function setupEventListeners() {
        deviceSearchInput.addEventListener('input', handleSearchInput);
        deviceListUl.addEventListener('click', handleDeviceSelect);
    }

    function handleSearchInput(event) {
        searchTerm = event.target.value.toLowerCase();
        renderDeviceList();
    }

    function handleDeviceSelect(event) {
        const listItem = event.target.closest('.device-item');
        if (listItem && listItem.dataset.id) {
            const deviceId = listItem.dataset.id;
            if (selectedDeviceId === deviceId) {
                // Clicked selected device again: Deselect and show global
                selectedDeviceId = null;
                displayGlobalEnergyData();
                displayMaintenanceInfo(); // Clear maintenance panel or show global summary?
            } else {
                selectedDeviceId = deviceId;
                displayDeviceEnergyData(selectedDeviceId);
                displayMaintenanceInfo(selectedDeviceId);
            }
            renderDeviceList(); // Re-render to update selection highlight
        }
    }

    // --- Simulation & Data Update Logic ---
    function updateTime() {
        simulationTime = new Date();
        currentTimeEl.textContent = simulationTime.toLocaleTimeString('zh-CN');
    }

    function updateFactoryData() {
        let currentTotalPower = 0;
        let totalUnits = 0;
        let onlineDevices = 0;
        let devicesWithIssues = 0;

        Object.values(factoryDevices).forEach(device => {
            // Simulate status changes
            const randStatus = Math.random();
            if (device.status === 'offline' && randStatus < 0.1) {
                device.status = 'online'; // Chance to come online
            } else if (device.status === 'online' && randStatus < 0.02) {
                device.status = 'offline'; // Chance to go offline
                device.power = 0;
            } else if (device.status !== 'offline') {
                 // Simulate power fluctuation for online/warning/error devices
                const basePower = (device.type === 'CNC机床' || device.type === '冲压机') ? 15 : 8;
                device.power = basePower + (Math.random() - 0.3) * 5;
                if (device.power < 0) device.power = 0;

                // Simulate energy consumption
                const energyConsumed = device.power * (dataUpdateInterval / (1000 * 3600)); // kWh
                device.todayEnergy += energyConsumed;
                device.weekEnergy += energyConsumed;
                factoryState.todayEnergyGlobal += energyConsumed;
                factoryState.weekEnergyGlobal += energyConsumed;

                // Simulate production
                if (device.power > basePower * 0.5) {
                     const units = Math.floor(Math.random() * 3);
                     device.unitsProduced += units;
                     totalUnits += units;
                     if (device.unitsProduced > 0) {
                         device.efficiencyMetric = device.todayEnergy / device.unitsProduced;
                     }
                }
                 onlineDevices++;
            }

            // Simulate sensor readings & RUL decrease
            if (device.status !== 'offline') {
                device.sensors.rul -= (dataUpdateInterval / (1000 * 3600)); // Decrease RUL
                if (device.sensors.rul < 0) device.sensors.rul = 0;

                const sensorRand = Math.random();
                // Fluctuate sensor value, more likely to increase if RUL is low
                const baseSensorValue = 20 + (1000 / (device.sensors.rul + 10)) * 2; // Higher base value for lower RUL
                device.sensors.value = baseSensorValue + (sensorRand - 0.5 + (device.sensors.rul < 200 ? 0.2 : 0)) * 15;
                if (device.sensors.value < 0) device.sensors.value = 0;
                if (device.sensors.value > 100) device.sensors.value = 100;

                // Update status based on sensor thresholds
                 if (device.sensors.value >= device.sensors.thresholdError && device.status !== 'offline') {
                     if (device.status !== 'error') device.status = 'error';
                     devicesWithIssues++;
                 } else if (device.sensors.value >= device.sensors.thresholdWarning && device.status !== 'offline') {
                     if (device.status !== 'error' && device.status !== 'warning') device.status = 'warning';
                     devicesWithIssues++;
                 } else if (device.status === 'error' || device.status === 'warning') {
                     // Chance to recover if value drops (less likely for error)
                     if (Math.random() < (device.status === 'error' ? 0.05 : 0.2)) {
                         device.status = 'online';
                     }
                 }
            }

            currentTotalPower += device.power;
        });

        factoryState.totalPower = currentTotalPower;
        // Simulate OEE (simple version based on online and issue states)
        const availability = onlineDevices / Object.keys(factoryDevices).length;
        const performance = totalUnits > 0 ? 0.8 + Math.random() * 0.15 : 0; // Simplified performance
        const quality = 1 - (devicesWithIssues / (onlineDevices + 0.1)); // Simplified quality
        factoryState.overallOEE = availability * performance * quality * 100;
        if (factoryState.overallOEE < 0) factoryState.overallOEE = 0;
         if (factoryState.overallOEE > 100) factoryState.overallOEE = 100;

        // Update header KPIs
        totalPowerEl.textContent = factoryState.totalPower.toFixed(1);
        overallOEEEl.textContent = factoryState.overallOEE.toFixed(1);

        // Re-render lists and panels if necessary (e.g., status changed)
        renderDeviceList();
        if (selectedDeviceId) {
            displayDeviceEnergyData(selectedDeviceId);
            displayMaintenanceInfo(selectedDeviceId);
        } else {
             displayGlobalEnergyData();
        }
    }

    function checkForNewAlerts() {
        factoryState.alerts = []; // Clear global alerts, rebuild from devices
        let activeAlertCount = 0;
        Object.values(factoryDevices).forEach(device => {
            device.alerts = []; // Clear device alerts first
            const sensorVal = device.sensors.value;
            let alertLevel = null;
            let message = '';

            if (device.status === 'error' || sensorVal >= device.sensors.thresholdError) {
                alertLevel = 'error';
                message = `${device.sensors.type}值异常 (${sensorVal.toFixed(1)}),可能导致故障`;
            } else if (device.status === 'warning' || sensorVal >= device.sensors.thresholdWarning) {
                 alertLevel = 'warning';
                 message = `${device.sensors.type}值偏高 (${sensorVal.toFixed(1)}),请关注`;
            }

            if (alertLevel && Math.random() < 0.8) { // Don't generate alert every single time
                const newAlert = {
                    id: `alrt-${device.id}-${Date.now()}`,
                    deviceId: device.id,
                    deviceName: device.name,
                    level: alertLevel,
                    message: message,
                    timestamp: new Date()
                };
                 device.alerts.push(newAlert);
                 factoryState.alerts.push(newAlert);
                 activeAlertCount++;
            }
        });

         // Add a RUL based alert
         Object.values(factoryDevices).forEach(device => {
             if (device.sensors.rul < 100 && device.status !== 'offline' && Math.random() < 0.5) { // RUL warning < 100 hours
                  const newAlert = {
                    id: `alrt-${device.id}-rul-${Date.now()}`,
                    deviceId: device.id,
                    deviceName: device.name,
                    level: 'warning',
                    message: `预估剩余寿命低 (${device.sensors.rul.toFixed(0)} 小时),建议安排维护`,
                    timestamp: new Date()
                };
                 // Avoid duplicate RUL alerts for the same device if one already exists
                 if (!device.alerts.some(a => a.message.includes('剩余寿命'))) {
                     device.alerts.push(newAlert);
                     factoryState.alerts.push(newAlert);
                     activeAlertCount++;
                 }
             }
         });

        factoryState.alerts.sort((a, b) => b.timestamp - a.timestamp); // Sort newest first
        predictiveAlertsCountEl.textContent = activeAlertCount;
        if (activeAlertCount > 0) {
            predictiveAlertsCountEl.classList.add('alert');
        } else {
            predictiveAlertsCountEl.classList.remove('alert');
        }

        // Update maintenance panel if a device is selected
        if (selectedDeviceId) {
            displayMaintenanceInfo(selectedDeviceId);
        }
    }

    // --- Rendering Functions ---
    function renderDeviceList() {
        deviceListUl.innerHTML = ''; // Clear list
        const filteredDevices = Object.values(factoryDevices).filter(device =>
            device.name.toLowerCase().includes(searchTerm)
            || device.type.toLowerCase().includes(searchTerm)
            || device.location.toLowerCase().includes(searchTerm)
            || device.id.toLowerCase().includes(searchTerm)
        );

        if (filteredDevices.length === 0) {
            deviceListUl.innerHTML = '<li class="placeholder">未找到匹配设备</li>';
            return;
        }

        filteredDevices
            .sort((a, b) => a.name.localeCompare(b.name)) // Sort alphabetically
            .forEach(device => {
                const li = document.createElement('li');
                li.className = 'device-item';
                li.dataset.id = device.id;
                if (device.id === selectedDeviceId) {
                    li.classList.add('selected');
                }
                li.innerHTML = `
                    <span class="device-name">${device.name} <small>(${device.location})</small></span>
                    <span class="device-status ${device.status}">${device.status.toUpperCase()}</span>
                `;
                deviceListUl.appendChild(li);
            });
    }

    function displayGlobalEnergyData() {
        selectedDeviceEnergyEl.textContent = '全局';
        currentPowerEl.textContent = factoryState.totalPower.toFixed(1);
        todayEnergyEl.textContent = factoryState.todayEnergyGlobal.toFixed(1);
        weekEnergyEl.textContent = factoryState.weekEnergyGlobal.toFixed(1);
        // Global efficiency metric might be complex, leave blank or use an average
        efficiencyMetricEl.textContent = '--';
         // TODO: Update global charts (placeholders for now)
    }

     function displayDeviceEnergyData(deviceId) {
        const device = factoryDevices[deviceId];
        if (!device) return;

        selectedDeviceEnergyEl.textContent = device.name;
        currentPowerEl.textContent = device.power.toFixed(1);
        todayEnergyEl.textContent = device.todayEnergy.toFixed(1);
        weekEnergyEl.textContent = device.weekEnergy.toFixed(1);
        efficiencyMetricEl.textContent = device.efficiencyMetric ? device.efficiencyMetric.toFixed(2) : '--';
         // TODO: Update energy charts for the specific device (placeholders)
    }

     function displayMaintenanceInfo(deviceId = null) {
         if (!deviceId) {
             selectedDeviceMaintenanceEl.textContent = '全局概览'; // Or maybe show all active alerts?
             selectedSensorTypeEl.textContent = '--';
             rulEstimateEl.textContent = '--';
             alertListUl.innerHTML = '<li class="placeholder">选择设备查看警报</li>';
              // TODO: Clear or show global sensor overview chart (placeholder)
             return;
         }

        const device = factoryDevices[deviceId];
        if (!device) return;

        selectedDeviceMaintenanceEl.textContent = device.name;
        selectedSensorTypeEl.textContent = device.sensors.type;
        rulEstimateEl.textContent = device.sensors.rul.toFixed(0);

        // Display alerts for this device
        alertListUl.innerHTML = '';
        const deviceAlerts = factoryState.alerts.filter(a => a.deviceId === deviceId);
        if (deviceAlerts.length === 0) {
            alertListUl.innerHTML = '<li class="placeholder">无活跃警报</li>';
        } else {
            deviceAlerts.forEach(alert => {
                const li = document.createElement('li');
                li.className = 'alert-item';
                li.innerHTML = `
                    <span class="alert-icon ${alert.level}"></span>
                    <span class="alert-message">${alert.message}</span>
                    <span class="alert-time">${alert.timestamp.toLocaleTimeString('zh-CN')}</span>
                `;
                alertListUl.appendChild(li);
            });
        }

         // TODO: Update sensor trend chart for the device (placeholder)
    }

    // --- Initial Call ---
    initializeIIoTMonitor();
});


 被折叠的 条评论
为什么被折叠?
被折叠的 条评论
为什么被折叠?
 到【灌水乐园】发言


