


钢铁厂峰谷电价策略优化分析组件
1. 组件概述
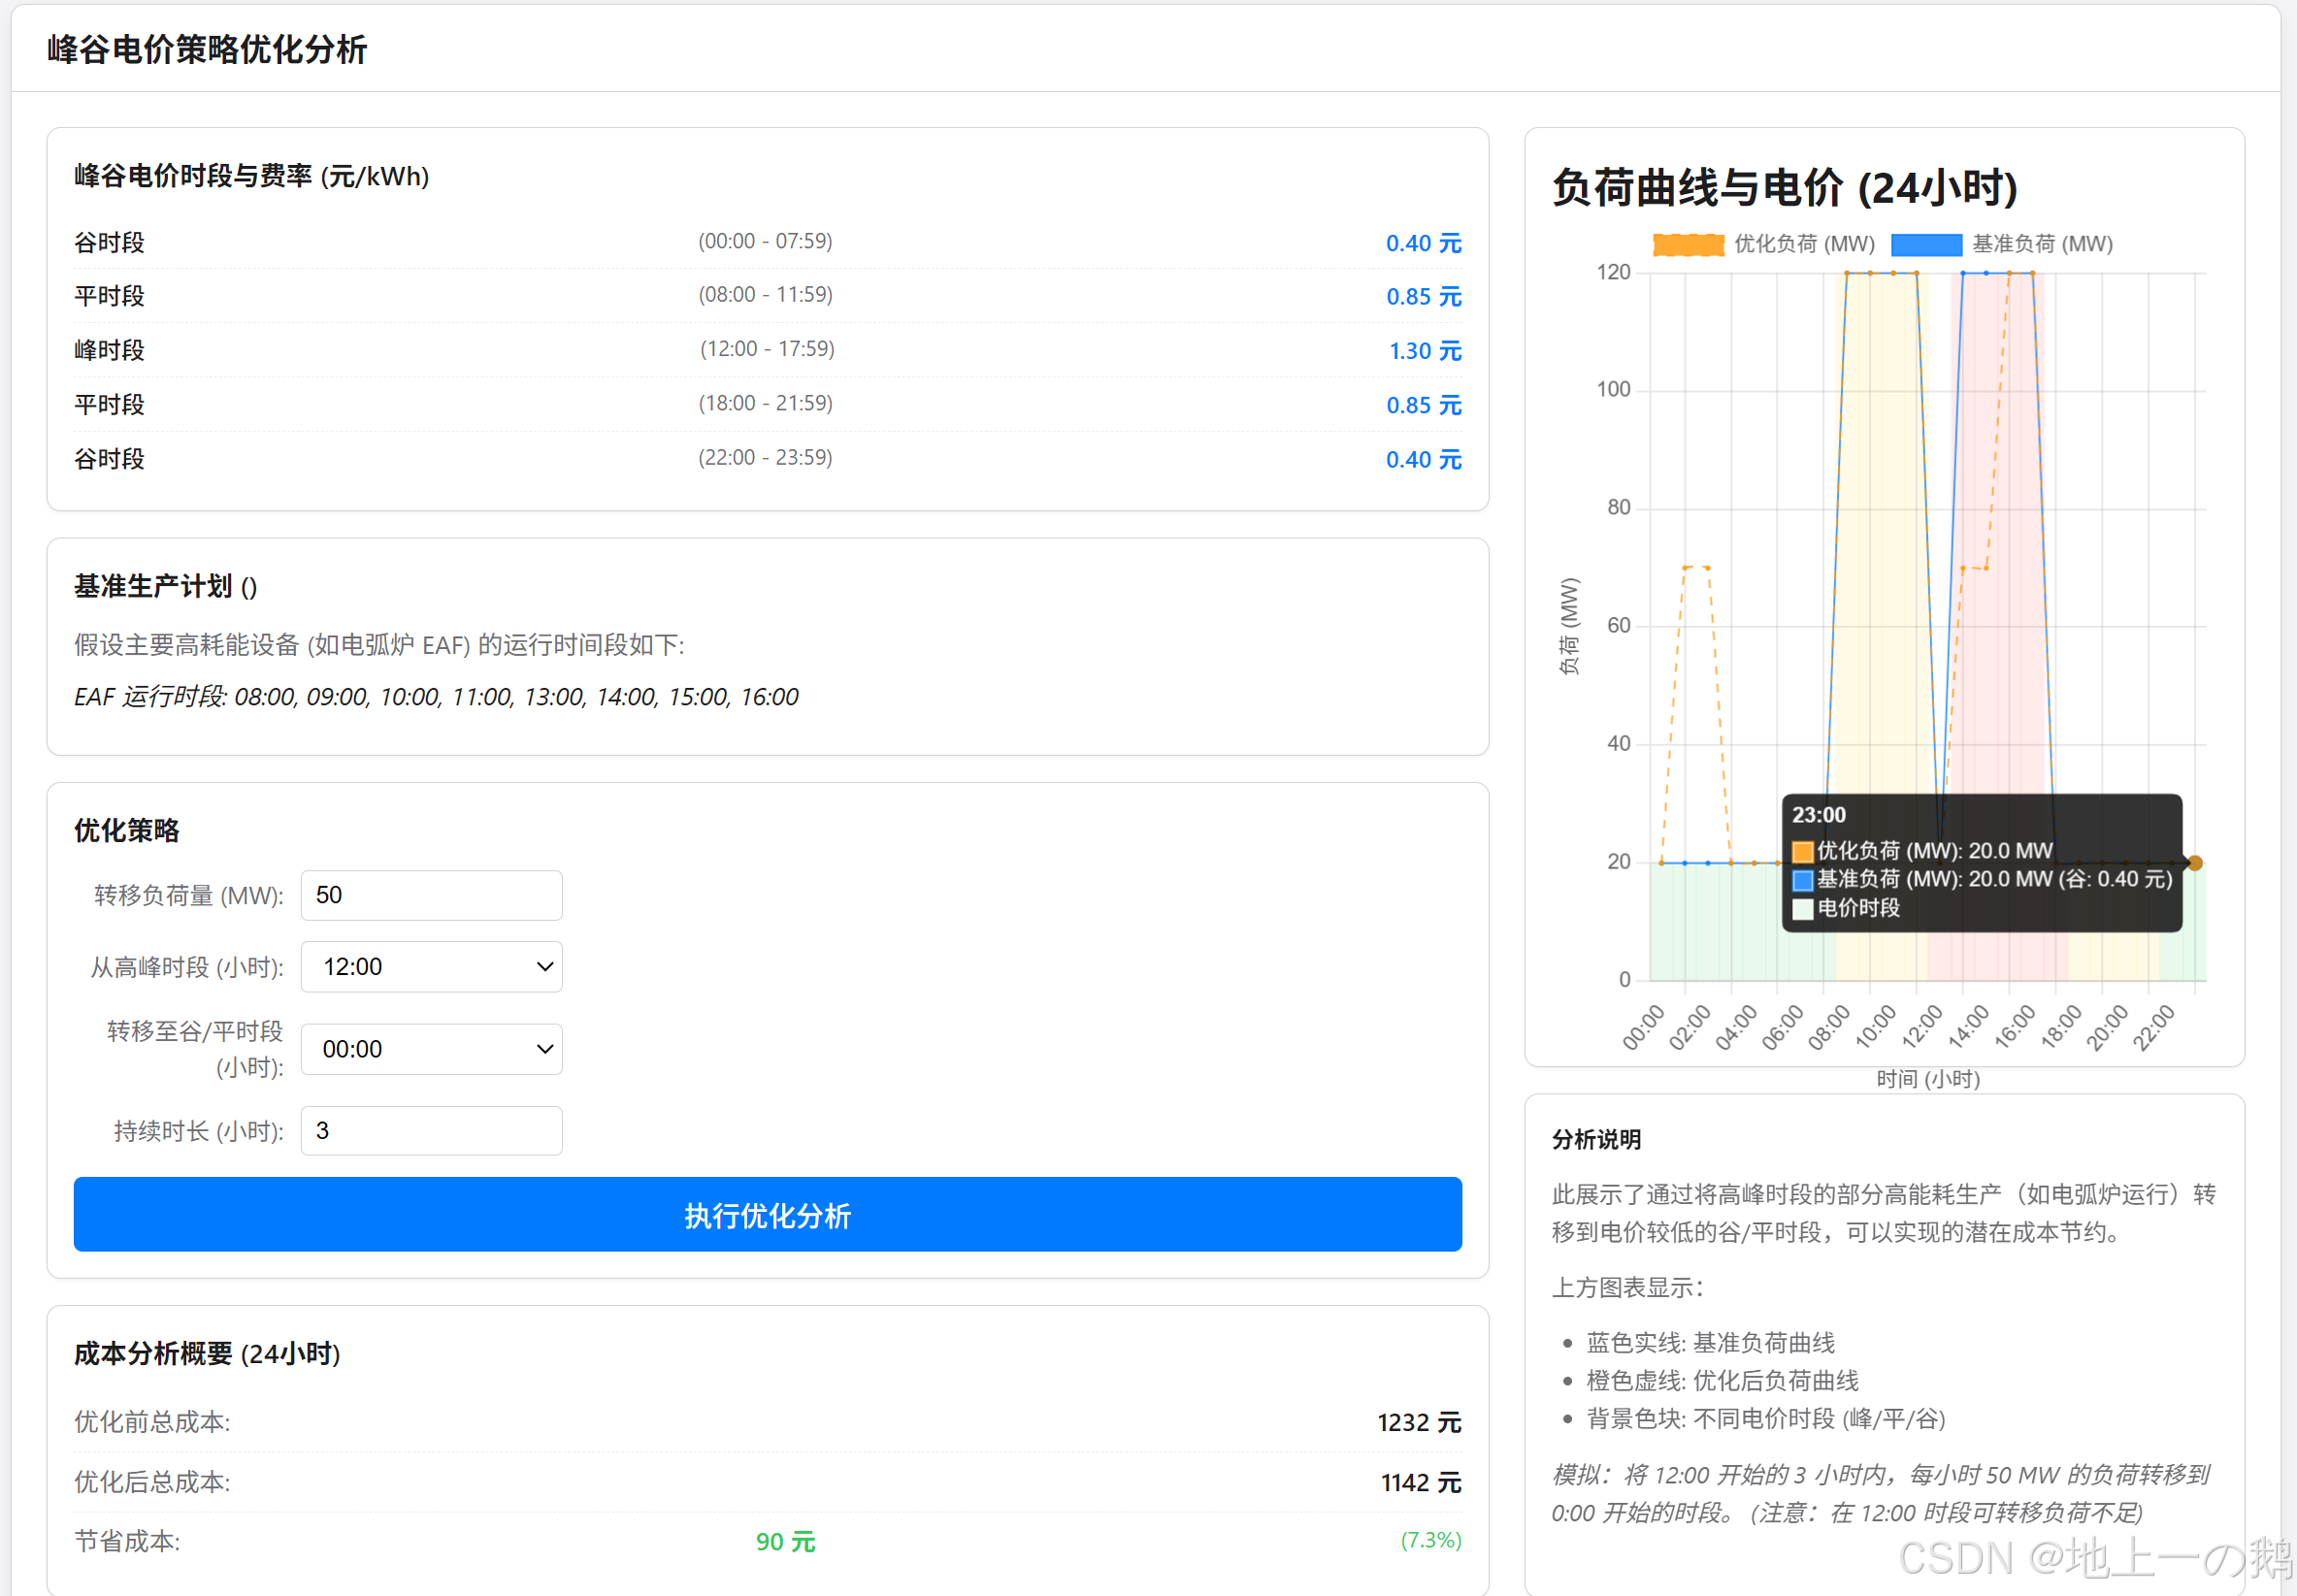
本组件旨在模拟钢铁厂(特别是电弧炉 EAF 等高耗能工序)在峰谷电价机制下的用电成本,并通过模拟调整生产计划(负荷转移)来分析潜在的成本优化空间。
用户可以设定负荷转移策略(转移多少负荷、从哪个高峰时段转移、转移到哪个谷/平时段、持续多久),然后组件会计算并对比优化前后的总用电成本,并在图表中直观展示负荷曲线的变化以及与电价时段的关系。
设计风格遵循苹果科技工业美学,注重数据的清晰呈现和交互的便捷性。
2. 主要功能
- 电价信息展示: 清晰列出预设的峰、平、谷时段及其对应的电价费率。
- 基准负荷模拟: 基于设定的工厂基础负荷和高耗能设备(如 EAF)的典型运行时间,生成一个 24 小时的基准负荷曲线。
- 优化策略配置: 用户可以输入想要模拟的负荷转移量 (MW)、选择负荷转移的起始高峰时段、目标谷/平时段以及转移的持续时长 (小时)。
- 成本对比分析: 计算并显示模拟的 24 小时内,基准负荷下的总用电成本和执行优化策略后的总用电成本,以及明确的成本节省金额和百分比。
- 可视化图表: 使用 Chart.js 图表展示:
- 基准负荷曲线(例如,蓝色实线)。
- 优化后的负荷曲线(例如,橙色虚线)。
- 代表峰、平、谷电价时段的背景色块,方便用户直观理解负荷与电价的关系。
- 交互式分析: 用户调整优化策略参数后,点击按钮即可重新计算并更新成本和图表。
- 响应式布局: 界面适应不同屏幕宽度。
3. 技术栈
- HTML5
- CSS3 (Flexbox, CSS Variables, Media Queries)
- JavaScript (ES6+)
- Chart.js (用于绘制图表)
- Day.js (本次模拟未使用,但已包含在 HTML 中以备将来扩展)
4. 运行与使用
- 将
steel-plant-tou-optimization文件夹放置在能源管理组件目录下。 - 在支持 HTML5 和 JavaScript 的浏览器中打开
index.html文件。 - 组件加载后会显示预设的电价信息、基准 EAF 运行计划,并进行一次初始成本计算和图表绘制。
- 在左侧"优化策略模拟"区域:
- 修改"转移负荷量"、“从高峰时段”、"转移至谷/平时段"和"持续时长"等参数。
- 点击"执行优化分析"按钮。
- 观察左下侧"成本分析概要"面板中更新的成本数据(优化前、优化后、节省额)。
- 观察右侧图表中负荷曲线(橙色虚线)的变化,以及它与电价背景色的对应关系。
5. 模拟逻辑说明
- 峰谷电价: 在
script.js的config.touTariff中预定义。getTariffForHour(hour)函数根据小时确定对应的电价类型和费率。 - 基准负荷: 由固定基础负荷 (
config.baseLoadMW) 和在特定高峰时段 (config.eafBaselineRunHours) 叠加的高耗能设备负荷 (config.eafLoadMW) 组成。 - 成本计算:
calculateCost(loadProfile)函数遍历 24 小时负荷曲线,将每小时的负荷 (MW) 乘以对应时段的电价费率(此处简化假设费率为 元/MWh),累加得到总成本。 - 负荷转移:
generateOptimizedLoadProfile()函数根据用户输入的参数,从指定的fromHour开始,在duration小时内,尝试将每小时shiftAmountMW 的负荷(仅转移超出基础负荷的部分)减少,并增加到对应的toHour开始的时段。如果源时段没有足够的可转移负荷,会进行部分转移并在分析说明中提示。 - 图表可视化: 使用 Chart.js 的组合图表类型。基准和优化后的负荷用
line类型绘制,电价时段用bar类型作为背景色块绘制,通过order属性控制绘制顺序。工具提示 (Tooltip) 会同时显示负荷值和当前时段的电价信息。
6. 注意事项
- 这是一个概念性模拟,用于演示峰谷电价优化策略的基本思路和效果。实际钢铁厂的负荷构成、生产调度约束和电价结构要复杂得多。
- 负荷转移模型非常简化,未考虑生产工艺的连续性、设备启停限制等实际约束。
- 成本计算假设电价费率单位为 元/MWh,是为了简化计算(MW * 元/MWh = 元)。如果实际费率是 元/kWh,则需要在计算时乘以 1000。
- 所有数据均为程序生成。
效果展示
源码
index.html
<!DOCTYPE html>
<html lang="zh-CN">
<head>
    <meta charset="UTF-8">
    <meta name="viewport" content="width=device-width, initial-scale=1.0">
    <title>钢铁厂峰谷电价策略优化</title>
    <link rel="stylesheet" href="styles.css">
    <!-- Chart.js for visualization -->
    <script src="https://cdn.jsdelivr.net/npm/chart.js"></script>
    <!-- Using Day.js for potential time formatting if needed -->
    <script src="https://cdn.jsdelivr.net/npm/dayjs@1/dayjs.min.js"></script>
</head>
<body>
    <div class="container">
        <header class="header-bar">
            <h1>峰谷电价策略优化分析</h1>
        </header>

        <main class="main-content">
            <section class="config-control-section">
                <div class="panel tou-tariff-panel">
                    <h2>峰谷电价时段与费率 (元/kWh)</h2>
                    <ul id="tariffList">
                        <!-- Tariff details loaded by JS -->
                        <li>加载电价信息...</li>
                    </ul>
                </div>

                <div class="panel schedule-panel">
                    <h2>基准生产计划 ()</h2>
                    <p>假设主要高耗能设备 (如电弧炉 EAF) 的运行时间段如下:</p>
                    <div id="baselineScheduleDisplay">
                         <!-- Baseline schedule info loaded by JS -->
                         <p>加载基准计划...</p>
                    </div>
                </div>

                <div class="panel optimization-panel">
                    <h2>优化策略</h2>
                    <div class="control-group">
                        <label for="shiftLoadAmount">转移负荷量 (MW):</label>
                        <input type="number" id="shiftLoadAmount" value="50" min="0" step="5">
                    </div>
                    <div class="control-group">
                         <label for="shiftFromHour">从高峰时段 (小时):</label>
                         <select id="shiftFromHour">
                             <!-- Options populated by JS based on peak hours -->
                         </select>
                    </div>
                     <div class="control-group">
                         <label for="shiftToHour">转移至谷/平时段 (小时):</label>
                         <select id="shiftToHour">
                            <!-- Options populated by JS based on off-peak hours -->
                         </select>
                    </div>
                     <div class="control-group">
                         <label for="shiftDuration">持续时长 (小时):</label>
                         <input type="number" id="shiftDuration" value="3" min="1" max="8" step="1">
                     </div>
                    <button id="optimizeBtn">执行优化分析</button>
                </div>

                <div class="panel cost-summary-panel">
                    <h2>成本分析概要 (24小时)</h2>
                     <div class="summary-item">
                         <span>优化前总成本:</span>
                         <strong id="baselineCost">-- 元</strong>
                     </div>
                     <div class="summary-item">
                         <span>优化后总成本:</span>
                         <strong id="optimizedCost">-- 元</strong>
                     </div>
                     <div class="summary-item savings">
                         <span>节省成本:</span>
                         <strong id="costSavings">-- 元</strong>
                         <span id="savingsPercentage"></span>
                     </div>
                </div>
            </section>

            <section class="visualization-section">
                 <div class="chart-container load-chart-container">
                     <h2>负荷曲线与电价 (24小时)</h2>
                     <canvas id="loadProfileChart"></canvas>
                 </div>
                  <div class="analysis-details-panel panel">
                    <h2>分析说明</h2>
                    <p>此展示了通过将高峰时段的部分高能耗生产(如电弧炉运行)转移到电价较低的谷/平时段,可以实现的潜在成本节约。</p>
                    <p>上方图表显示:</p>
                    <ul>
                        <li>蓝色实线: 基准负荷曲线</li>
                        <li>橙色虚线: 优化后负荷曲线</li>
                        <li>背景色块: 不同电价时段 (峰/平/谷)</li>
                    </ul>
                    <p id="analysisNotes">请调整左侧优化策略参数,点击"执行优化分析"查看结果。</p>
                  </div>
            </section>
        </main>

    </div>

    <script src="script.js"></script>
</body>
</html>
styles.css
:root {
    --bg-color: #f5f5f7;
    --panel-bg-color: #ffffff;
    --border-color: #d2d2d7;
    --text-color-primary: #1d1d1f;
    --text-color-secondary: #6e6e73;
    --accent-blue: #007aff;
    --accent-green: #34c759;
    --accent-red: #ff3b30;
    --accent-orange: #ff9500; /* For optimized line */
    --tariff-peak-bg: rgba(255, 59, 48, 0.1);
    --tariff-shoulder-bg: rgba(255, 204, 0, 0.1);
    --tariff-offpeak-bg: rgba(52, 199, 89, 0.1);
    --font-family: -apple-system, BlinkMacSystemFont, "Segoe UI", Roboto, Helvetica, Arial, sans-serif;
    --border-radius: 8px;
    --container-padding: 20px;
    --panel-padding: 15px;
    --header-height: 50px;
}

* {
    box-sizing: border-box;
    margin: 0;
    padding: 0;
}

body {
    font-family: var(--font-family);
    background-color: var(--bg-color);
    color: var(--text-color-primary);
    line-height: 1.5;
    display: flex;
    justify-content: center;
    align-items: flex-start;
    min-height: 100vh;
    padding: 20px;
}

.container {
    width: 100%;
    max-width: 1300px; /* Adjust max width as needed */
    background-color: var(--panel-bg-color);
    border-radius: var(--border-radius);
    border: 1px solid var(--border-color);
    box-shadow: 0 4px 12px rgba(0, 0, 0, 0.08);
    overflow: hidden;
    display: flex;
    flex-direction: column;
}

/* Header */
.header-bar {
    padding: 0 var(--container-padding);
    height: var(--header-height);
    border-bottom: 1px solid var(--border-color);
    display: flex;
    align-items: center;
}

.header-bar h1 {
    font-size: 1.15em;
    font-weight: 600;
}

/* Main Content */
.main-content {
    display: flex;
    flex: 1;
    padding: var(--container-padding);
    gap: var(--container-padding);
    min-height: 500px; /* Ensure reasonable height */
}

.config-control-section {
    flex: 2; /* Left side takes less space */
    display: flex;
    flex-direction: column;
    gap: var(--panel-padding);
}

.visualization-section {
    flex: 3; /* Right side takes more space */
    display: flex;
    flex-direction: column;
    gap: var(--panel-padding);
    flex-grow: 1;
}

/* Panels */
.panel {
    background-color: #ffffff;
    border: 1px solid var(--border-color);
    border-radius: var(--border-radius);
    padding: var(--panel-padding);
    box-shadow: 0 1px 2px rgba(0,0,0,0.05);
}

.panel h2 {
    font-size: 0.95em;
    font-weight: 600;
    margin-bottom: 12px;
    color: var(--text-color-primary);
}

/* Left Panel Specifics */
.tou-tariff-panel ul {
    list-style: none;
    padding: 0;
    font-size: 0.85em;
}

.tou-tariff-panel li {
    padding: 5px 0;
    border-bottom: 1px dashed #eee;
    display: flex;
    justify-content: space-between;
}
.tou-tariff-panel li:last-child {
    border-bottom: none;
}
.tou-tariff-panel .tariff-type {
    font-weight: 500;
}
.tou-tariff-panel .tariff-hours {
    color: var(--text-color-secondary);
    font-size: 0.9em;
}
.tou-tariff-panel .tariff-rate {
    font-weight: 600;
    color: var(--accent-blue);
}

.schedule-panel p {
    font-size: 0.9em;
    margin-bottom: 8px;
    color: var(--text-color-secondary);
}

#baselineScheduleDisplay p {
     font-size: 0.9em;
     color: var(--text-color-primary);
     font-style: italic;
}

.optimization-panel .control-group {
    margin-bottom: 12px;
    display: flex;
    align-items: center;
    gap: 10px;
    font-size: 0.9em;
}

.optimization-panel label {
    flex-basis: 120px; /* Align labels */
    text-align: right;
    color: var(--text-color-secondary);
    font-size: 0.95em;
}

.optimization-panel input[type="number"],
.optimization-panel select {
    flex-grow: 1;
    padding: 6px 8px;
    border: 1px solid var(--border-color);
    border-radius: 4px;
    font-size: 0.95em;
    max-width: 150px; /* Limit width of inputs/selects */
}

.optimization-panel button {
    display: block;
    width: 100%;
    padding: 10px 15px;
    margin-top: 10px;
    background-color: var(--accent-blue);
    color: white;
    border: none;
    border-radius: 5px;
    cursor: pointer;
    font-size: 1em;
    font-weight: 500;
    transition: background-color 0.2s ease;
}

.optimization-panel button:hover {
    background-color: #0056b3;
}

.cost-summary-panel .summary-item {
    display: flex;
    justify-content: space-between;
    padding: 6px 0;
    font-size: 0.9em;
    border-bottom: 1px dashed #eee;
}
.cost-summary-panel .summary-item:last-child {
    border-bottom: none;
}

.cost-summary-panel .summary-item span {
     color: var(--text-color-secondary);
}
.cost-summary-panel .summary-item strong {
    color: var(--text-color-primary);
    font-weight: 600;
}
.cost-summary-panel .summary-item.savings strong {
    color: var(--accent-green);
}
.cost-summary-panel .summary-item #savingsPercentage {
    font-size: 0.9em;
    margin-left: 5px;
    color: var(--accent-green);
}

/* Right Panel Specifics */
.load-chart-container {
    flex-grow: 3; /* Chart takes more space vertically compared to details */
    padding: var(--panel-padding);
    border: 1px solid var(--border-color);
    border-radius: var(--border-radius);
    box-shadow: 0 1px 2px rgba(0,0,0,0.05);
    display: flex; /* Use flex to help canvas resize */
    flex-direction: column;
    height: 500px; /* Suggest a fixed height */
    max-height: 800px; /* Absolute maximum height */
    min-height: 300px; /* Minimum reasonable height */
}

.load-chart-container canvas {
    max-width: 100%;
    /* Let Chart.js handle canvas resizing within the container */
}

.analysis-details-panel {
    flex-grow: 1; /* Details panel takes less space */
    flex-shrink: 0; /* Prevent shrinking too much */
    font-size: 0.85em;
    line-height: 1.6;
    color: var(--text-color-secondary);
    max-height: 500px; /* Also limit details panel height */
    overflow-y: auto;
}
.analysis-details-panel h2 {
     margin-bottom: 10px;
}
.analysis-details-panel ul {
     margin-left: 20px;
     margin-bottom: 10px;
}
.analysis-details-panel p {
    margin-bottom: 10px;
}
#analysisNotes {
    font-style: italic;
    color: var(--text-color-secondary);
}

/* Responsive Adjustments */
@media (max-width: 1100px) {
    .main-content {
        flex-direction: column;
        min-height: auto;
    }
    .config-control-section,
    .visualization-section {
        flex: none;
        width: 100%;
    }
}

@media (max-width: 768px) {
    body {
        padding: 10px;
    }
    .container {
        border-radius: 0;
        border-left: none;
        border-right: none;
    }
    .main-content {
        padding: var(--panel-padding);
    }
    .config-control-section, .visualization-section {
        gap: var(--panel-padding);
    }
     .optimization-panel .control-group {
         flex-direction: column;
         align-items: stretch;
         gap: 5px;
     }
     .optimization-panel label {
         text-align: left;
         margin-bottom: 2px;
     }
     .optimization-panel input[type="number"],
     .optimization-panel select {
        max-width: none;
     }
}

@media (max-width: 480px) {
     .header-bar h1 {
         font-size: 1em;
     }
     .panel h2 {
         font-size: 0.9em;
     }
     body {
         padding: 5px;
     }
}
script.js
document.addEventListener('DOMContentLoaded', () => {
    // --- DOM Elements ---
    const tariffListUl = document.getElementById('tariffList');
    const baselineScheduleDisplay = document.getElementById('baselineScheduleDisplay');
    const shiftLoadAmountInput = document.getElementById('shiftLoadAmount');
    const shiftFromHourSelect = document.getElementById('shiftFromHour');
    const shiftToHourSelect = document.getElementById('shiftToHour');
    const shiftDurationInput = document.getElementById('shiftDuration');
    const optimizeBtn = document.getElementById('optimizeBtn');
    const baselineCostSpan = document.getElementById('baselineCost');
    const optimizedCostSpan = document.getElementById('optimizedCost');
    const costSavingsSpan = document.getElementById('costSavings');
    const savingsPercentageSpan = document.getElementById('savingsPercentage');
    const loadProfileCanvas = document.getElementById('loadProfileChart');
    const analysisNotesP = document.getElementById('analysisNotes');

    // --- Configuration ---
    const config = {
        hoursInDay: 24,
        baseLoadMW: 20, // Base plant load constant throughout the day
        eafLoadMW: 100, // Electric Arc Furnace load when running
        eafBaselineRunHours: [8, 9, 10, 11, 13, 14, 15, 16], // Example peak hours EAF runs
        // Time-of-Use Tariff Structure (Example)
        touTariff: [
            { type: '谷', startHour: 0, endHour: 7, rate: 0.40 },  // 00:00 - 07:59
            { type: '平', startHour: 8, endHour: 11, rate: 0.85 }, // 08:00 - 11:59
            { type: '峰', startHour: 12, endHour: 17, rate: 1.30 }, // 12:00 - 17:59
            { type: '平', startHour: 18, endHour: 21, rate: 0.85 }, // 18:00 - 21:59
            { type: '谷', startHour: 22, endHour: 23, rate: 0.40 }, // 22:00 - 23:59
        ],
        chartColors: {
            baseline: 'rgba(0, 122, 255, 0.8)',
            optimized: 'rgba(255, 149, 0, 0.8)',
            peakBg: 'rgba(255, 59, 48, 0.1)',
            shoulderBg: 'rgba(255, 204, 0, 0.1)',
            offpeakBg: 'rgba(52, 199, 89, 0.1)'
        }
    };

    // --- State ---
    let baselineLoadProfile = []; // Array of 24 hourly load values (MW)
    let optimizedLoadProfile = []; // Array of 24 hourly load values (MW)
    let loadProfileChart = null;

    // --- Helper Functions ---
    function getTariffForHour(hour) {
        for (const period of config.touTariff) {
            // Handle wrap-around for endHour < startHour (e.g.,谷 period spanning midnight)
            if (period.endHour >= period.startHour) {
                if (hour >= period.startHour && hour <= period.endHour) {
                    return period;
                }
            } else { // Period wraps around midnight (e.g., 22:00 - 07:00)
                if (hour >= period.startHour || hour <= period.endHour) {
                    return period;
                }
            }
        }
        return { type: '未知', rate: 1.0 }; // Fallback
    }

    function generateBaselineLoadProfile() {
        const profile = Array(config.hoursInDay).fill(config.baseLoadMW);
        config.eafBaselineRunHours.forEach(hour => {
            if (hour >= 0 && hour < config.hoursInDay) {
                profile[hour] += config.eafLoadMW;
            }
        });
        return profile;
    }

    function calculateCost(loadProfile) {
        let totalCost = 0;
        for (let hour = 0; hour < config.hoursInDay; hour++) {
            const tariff = getTariffForHour(hour);
            const load = loadProfile[hour] || 0;
            // Assuming rate is effectively 元 per MWh for simulation simplicity
            totalCost += load * tariff.rate;
        }
        return totalCost;
    }

    function generateOptimizedLoadProfile(baselineProfile, shiftAmount, fromHour, toHour, duration) {
        const optimized = [...baselineProfile]; // Create a copy
        fromHour = parseInt(fromHour);
        toHour = parseInt(toHour);
        duration = parseInt(duration);
        shiftAmount = parseFloat(shiftAmount);

        if (isNaN(fromHour) || isNaN(toHour) || isNaN(duration) || isNaN(shiftAmount) || duration <= 0 || shiftAmount <= 0) {
            console.error("Invalid optimization parameters");
            analysisNotesP.textContent = "错误:无效的优化参数。";
            return baselineProfile; // Return baseline if params are bad
        }

        analysisNotesP.textContent = `模拟:将 ${fromHour}:00 开始的 ${duration} 小时内,每小时 ${shiftAmount} MW 的负荷转移到 ${toHour}:00 开始的时段。`;

        for (let i = 0; i < duration; i++) {
            const currentFromHour = (fromHour + i) % config.hoursInDay;
            const currentToHour = (toHour + i) % config.hoursInDay;

            // Check if enough load exists at the source hour (above base load)
            const availableLoadToShift = Math.max(0, optimized[currentFromHour] - config.baseLoadMW);
            const actualShift = Math.min(shiftAmount, availableLoadToShift);

            if (actualShift > 0) {
                optimized[currentFromHour] -= actualShift;
                optimized[currentToHour] += actualShift;
            } else {
                 console.warn(`Hour ${currentFromHour}: Not enough shiftable load (${availableLoadToShift.toFixed(1)} MW) to move ${shiftAmount} MW.`);
                  analysisNotesP.textContent += ` (注意:在 ${currentFromHour}:00 时段可转移负荷不足)`;
            }
        }
        return optimized;
    }

    // --- Initialization Functions ---
    function displayTariffInfo() {
        tariffListUl.innerHTML = '';
        config.touTariff.forEach(period => {
            const li = document.createElement('li');
            li.innerHTML = `
                <span class="tariff-type">${period.type}时段</span>
                <span class="tariff-hours">(${String(period.startHour).padStart(2, '0')}:00 - ${String(period.endHour).padStart(2, '0')}:59)</span>
                <span class="tariff-rate">${period.rate.toFixed(2)} 元</span>
            `;
            tariffListUl.appendChild(li);
        });
    }

    function displayBaselineSchedule() {
        baselineScheduleDisplay.innerHTML = `<p>EAF 运行时段: ${config.eafBaselineRunHours.map(h => `${String(h).padStart(2, '0')}:00`).join(', ')}</p>`;
    }

    function populateShiftSelectOptions() {
        shiftFromHourSelect.innerHTML = '';
        shiftToHourSelect.innerHTML = '';
        const peakHours = [];
        const offPeakHours = [];

        for (let hour = 0; hour < config.hoursInDay; hour++) {
            const tariff = getTariffForHour(hour);
            const option = document.createElement('option');
            option.value = hour;
            option.textContent = `${String(hour).padStart(2, '0')}:00`;

            if (tariff.type === '峰') {
                shiftFromHourSelect.appendChild(option);
                peakHours.push(hour);
            } else {
                shiftToHourSelect.appendChild(option.cloneNode(true)); // Clone node for the other select
                offPeakHours.push(hour);
            }
        }
         // Set default selections if possible
         if (shiftFromHourSelect.options.length > 0) shiftFromHourSelect.selectedIndex = 0;
         if (shiftToHourSelect.options.length > 0) shiftToHourSelect.selectedIndex = 0;
    }

    function initializeChart() {
        if (loadProfileChart) {
            loadProfileChart.destroy();
        }
        const ctx = loadProfileCanvas.getContext('2d');
        const labels = Array.from({ length: config.hoursInDay }, (_, i) => `${String(i).padStart(2, '0')}:00`);

        // Prepare background color array based on tariff
        const backgroundColors = labels.map((_, index) => {
            const tariff = getTariffForHour(index);
            switch (tariff.type) {
                case '峰': return config.chartColors.peakBg;
                case '平': return config.chartColors.shoulderBg;
                case '谷': return config.chartColors.offpeakBg;
                default: return 'rgba(0,0,0,0.05)';
            }
        });

        loadProfileChart = new Chart(ctx, {
            type: 'bar', // Use bar chart to better show hourly load and background color
            data: {
                labels: labels,
                datasets: [
                    {
                        label: '基准负荷 (MW)',
                        data: baselineLoadProfile,
                        backgroundColor: config.chartColors.baseline,
                        borderColor: config.chartColors.baseline,
                        borderWidth: 1,
                        type: 'line', // Overlay line for baseline
                        fill: false,
                        tension: 0.1,
                        pointRadius: 1,
                        order: 1 // Draw line on top
                    },
                    {
                        label: '优化负荷 (MW)',
                        data: optimizedLoadProfile,
                         backgroundColor: config.chartColors.optimized,
                         borderColor: config.chartColors.optimized,
                         borderWidth: 1,
                        type: 'line', // Overlay line for optimized
                        fill: false,
                        borderDash: [5, 5],
                        tension: 0.1,
                         pointRadius: 1,
                         order: 0 // Draw optimized line first
                    },
                    {
                        label: '电价时段',
                        data: baselineLoadProfile, // Use any profile data just for positioning bars
                        backgroundColor: backgroundColors,
                        borderColor: 'transparent',
                        borderWidth: 0,
                        type: 'bar', // Background bars
                        order: 2, // Draw bars behind lines
                        barPercentage: 1.0,
                        categoryPercentage: 1.0,
                        grouped: false // Ensure bars occupy the full category width
                    }
                ]
            },
            options: {
                responsive: true,
                maintainAspectRatio: false,
                interaction: { // Optimize hover/tooltip
                    mode: 'index',
                    intersect: false,
                },
                scales: {
                    x: {
                        stacked: true, // Needed for background bars
                        title: { display: true, text: '时间 (小时)' }
                    },
                    y: {
                        beginAtZero: true,
                        stacked: false,
                        title: { display: true, text: '负荷 (MW)' }
                    }
                },
                plugins: {
                    tooltip: {
                        mode: 'index',
                        intersect: false,
                        callbacks: {
                            // Custom tooltip to show load and tariff
                            label: function(context) {
                                let label = context.dataset.label || '';
                                if (label && context.dataset.type === 'line') {
                                     label += `: ${context.parsed.y.toFixed(1)} MW`;
                                }
                                // Add tariff info to tooltip (only once per x-index)
                                if (context.datasetIndex === 0) { // Show only for the first dataset (baseline line)
                                     const hour = context.dataIndex;
                                     const tariff = getTariffForHour(hour);
                                     label += ` (${tariff.type}: ${tariff.rate.toFixed(2)} 元)`;
                                }
                                return label;
                            },
                            // Filter out the background bar dataset from tooltip
                             filter: function(tooltipItem) {
                                 return tooltipItem.dataset.label !== '电价时段';
                             }
                        }
                    },
                    legend: {
                         labels: {
                             // Filter out the background bar dataset from legend
                             filter: function(legendItem, chartData) {
                                 return legendItem.text !== '电价时段';
                             }
                         }
                    }
                }
            }
        });
    }

    // --- Core Calculation and Update ---
    function runOptimizationAnalysis() {
        const shiftAmount = parseFloat(shiftLoadAmountInput.value);
        const fromHour = parseInt(shiftFromHourSelect.value);
        const toHour = parseInt(shiftToHourSelect.value);
        const duration = parseInt(shiftDurationInput.value);

        // Validate inputs
        if (isNaN(shiftAmount) || shiftAmount < 0 || isNaN(fromHour) || isNaN(toHour) || isNaN(duration) || duration <= 0) {
             analysisNotesP.textContent = "错误: 请输入有效的优化参数。";
             baselineCostSpan.textContent = '-- 元';
             optimizedCostSpan.textContent = '-- 元';
             costSavingsSpan.textContent = '-- 元';
             savingsPercentageSpan.textContent = '';
            return;
        }
         // Prevent shifting to the same hour or overlapping significantly (simple check)
         if (fromHour === toHour) {
              analysisNotesP.textContent = "错误: 不能将负荷转移到同一时段。";
              return;
         }

        // 1. Regenerate baseline (in case base config changes in future)
        baselineLoadProfile = generateBaselineLoadProfile();

        // 2. Generate optimized profile
        optimizedLoadProfile = generateOptimizedLoadProfile(baselineLoadProfile, shiftAmount, fromHour, toHour, duration);

        // 3. Calculate costs
        const baselineCost = calculateCost(baselineLoadProfile);
        const optimizedCost = calculateCost(optimizedLoadProfile);
        const savings = baselineCost - optimizedCost;
        const savingsPercent = baselineCost > 0 ? (savings / baselineCost) * 100 : 0;

        // 4. Update UI
        baselineCostSpan.textContent = `${baselineCost.toFixed(0)} 元`;
        optimizedCostSpan.textContent = `${optimizedCost.toFixed(0)} 元`;
        costSavingsSpan.textContent = `${savings.toFixed(0)} 元`;
        savingsPercentageSpan.textContent = savings > 0 ? `(${savingsPercent.toFixed(1)}%)` : '';

        // Update Chart Data
        if (loadProfileChart) {
            loadProfileChart.data.datasets[0].data = baselineLoadProfile;
             loadProfileChart.data.datasets[1].data = optimizedLoadProfile;
             // Update background bar data as well (though it might not change)
             loadProfileChart.data.datasets[2].data = baselineLoadProfile;
            loadProfileChart.update();
        } else {
            initializeChart(); // Initialize if it doesn't exist yet
        }
    }

    // --- Event Listeners ---
    optimizeBtn.addEventListener('click', runOptimizationAnalysis);

    // --- Initial Setup ---
    function initializeApp() {
        displayTariffInfo();
        displayBaselineSchedule();
        populateShiftSelectOptions();
        baselineLoadProfile = generateBaselineLoadProfile();
        optimizedLoadProfile = [...baselineLoadProfile]; // Initially, optimized is same as baseline
        initializeChart();
        runOptimizationAnalysis(); // Run initial analysis to populate costs and chart
         analysisNotesP.textContent = "请调整左侧优化策略参数,点击'执行优化分析'查看结果。"; // Reset notes after initial run

    }

    initializeApp();
});


 被折叠的 条评论
为什么被折叠?
被折叠的 条评论
为什么被折叠?
 到【灌水乐园】发言


