


一:折线图
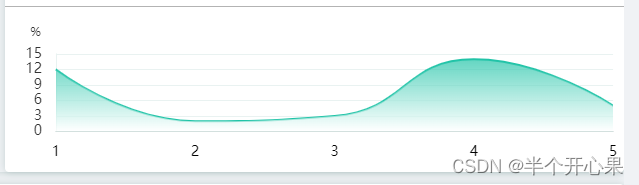
let option = {
						tooltip: {},
						animation: false,
						grid: {
							top: "20%",
							bottom: "33%", //也可设置left和right设置距离来控制图表的大小
							left: '5%',
							right: '5%'
						},
						xAxis: {
              boundaryGap:false,
							data: [1,2,3,4,5],
							axisLine: {
								show: true, //隐藏X轴轴线
								lineStyle: {
									color: 'rgba(10,71,62,0.2)'
								}
							},
							axisTick: {
								show: false //隐藏X轴刻度
							},
							axisLabel: {
								show: true,
								margin: 14,
								fontSize: 14,
								textStyle: {
									color: "rgba(0,0,0,1)" //X轴文字颜色
								}
							},

						},
						yAxis: [
							{
                name:"%",
                nameLocation:"end",
                nameTextStyle:{
                  color:"#333",
                  align:"right",
									padding:[0,15]
                },
								type: "value",
								gridIndex: 0,
								splitNumber: 4,
								splitLine: {
									show: true,
									lineStyle: {
										color: 'rgba(233,242,241,1)',
										width: 1
									},
								},
								axisTick: {
									show: false
								},
								axisLine: {
									show: true,
									lineStyle: {
										color: 'rgba(233,242,241,1)'
									}
								},
								axisLabel: {
									show: true,
									margin: 14,
									fontSize: 14,
									textStyle: {
										color: "#333" //X轴文字颜色
									}
								},
							}
						],
						series: [
            {
              name: 'Fake Data',
              type: 'line',
              symbol: 'none',
              smooth: true,
              sampling: 'lttb',
              itemStyle: {
                color: '#20C3A7'
              },
              areaStyle: {
                color: new echarts.graphic.LinearGradient(0, 0, 0, 1, [
                  {
                    offset: 1,
                    color: 'rgba(255,255,255,1)'
                  },
                  {
                    offset: 0,
                    color: 'rgb(32,195,167)'
                  }
                ])
              },
              data: [12,2,3,14,5]
            }

						]
					};
第二种:柱形渐变图

let workOrderTjChartoption = {
						tooltip: {},
						color:["#FFAE00","#2AADD3","#20C3A7"],
						animation: false,
						grid: {
							top: "23%",
							bottom: "21%", //也可设置left和right设置距离来控制图表的大小
							left: '11%',
							right: '5%'
						},
						xAxis: {
							data: ['周一','周二'],
							axisLine: {
								show: true, //隐藏X轴轴线
								lineStyle: {
									color: 'rgba(10,71,62,0.2)'
								}
							},
							axisTick: {
								show: false //隐藏X轴刻度
							},
							axisLabel: {
								show: true,
								margin: 14,
								fontSize: 14,
								textStyle: {
									color: "rgba(0,0,0,1)" //X轴文字颜色
								}
							},

						},
						yAxis: [
							{
								type: "value",
								gridIndex: 0,
								// min: min1,
								// max: max1,
								// interval: (max1 - min1) / 4,
								splitNumber: 4,
								splitLine: {
									show: true,
									lineStyle: {
										color: 'rgba(233,242,241,1)',
										width: 1
									},
								},
								axisTick: {
									show: false
								},
								axisLine: {
									show: true,
									lineStyle: {
										color: 'rgba(233,242,241,1)'
									}
								},
								axisLabel: {
									show: true,
									margin: 14,
									fontSize: 14,
									textStyle: {
										color: "#333" //X轴文字颜色
									}
								},
							}
						],
						legend: {
							top: '0%',
							itemWidth:10,
							itemHeight:10,
							data: ["核查测点数", "严重越上限测点数", "越下限测点数"],

						},
						series: [
							{
								name: "越下限测点数",
								type: "bar",
								barWidth: 8,
								itemStyle: {
									normal: {
										color: new echarts.graphic.LinearGradient(0, 0, 0, 1, [{
											offset: 0,
											color: "rgba(29,218,182,1)"
										},
										{
											offset: 1,
											color: "rgba(34,183,160,1)"
										}
										])
									}
								},
								data: [1,2],
								// z: 10,
								// zlevel: 0,

							},
							{
								name: "严重越上限测点数",
								type: "bar",
								barWidth: 8,
								// barGap: '-100%',
								itemStyle: {
									normal: {
										color: new echarts.graphic.LinearGradient(0, 0, 0, 1, [{
											offset: 0,
											color: "rgba(31,224,247,1)"
										},
										{
											offset: 1,
											color: "rgba(42,173,211,1)"
										}
										])
									}
								},
								data: [1,2],
								// z: 11,
								// zlevel: 1,

							},

							{
								name: '核查测点数',
								type: 'bar',
								barWidth: 8,
								// smooth: true, //是否平滑曲线显示
								// 			symbol:'circle',  // 默认是空心圆(中间是白色的),改成实心圆


								itemStyle: {
									normal: {
										color: new echarts.graphic.LinearGradient(0, 0, 0, 1, [{
											offset: 0,
											color: "rgba(255,222,0,1)"
										},
										{
											offset: 1,
											color: "rgba(255,174,0,1)"
										}
										])
									}
								},
								// z: 12,
								// zlevel: 2,

								data:[2,3],
							}
						]
					};
第三种:柱形图

let option = {
						tooltip: {
							trigger: 'axis',
							axisPointer: {
								type: 'shadow'
							}
						},
						legend: {
							top: '5%',
							itemWidth:10,
							itemHeight:10,
							data: ["7%~10%", "10%~15%", "15以上","-10~-20","-20及以下"],
						},
						grid: {
							left: '3%',
							right: '4%',
							bottom: '3%',
							containLabel: true
						},
						xAxis: [
							{
								type: 'category',
								data: ['Mon', 'Tue', 'Wed', 'Thu', 'Fri', 'Sat', 'Sun'],
								axisLine: {
									show: true, //隐藏X轴轴线
									lineStyle: {
										color: 'rgba(10,71,62,0.2)'
									}
								},
								axisTick: {
									show: false //隐藏X轴刻度
								},
								axisLabel: {
									show: true,
									margin: 14,
									fontSize: 14,
									textStyle: {
										color: "rgba(0,0,0,1)" //X轴文字颜色
									}
								},
							}
						],
						yAxis: [
							{
								type: 'value'
							}
						],
						series: [

							{
								name: '-20及以下',
								type: 'bar',
								barWidth:15,
								stack: 'Ad',
								emphasis: {
									focus: 'series'
								},
								itemStyle:{
									color:"#20C3A7"
								},
								data: [120, 132, 101, 134, 90, 230, 210]
							},
							{
								// 分隔
								type: "pictorialBar",
								itemStyle: {
									normal: {
										color: "#fff"
									}
								},
								symbolRepeat: "true",
								symbolMargin: 2,
								symbol: "rect",
								symbolClip: true,
								symbolSize: [15, 2],
								symbolPosition: "start",
							// 	symbolOffset: [0, -15],
								symbolBoundingData: [1000, 1000, 1000, 1000, 1000, 1000, 1000],
								data:  [1000, 1000, 1000, 1000, 1000, 1800, 1800],
								width: 25,
								z: 0,
								zlevel: 1,
							},
							{
								name: '-10~-20',
								type: 'bar',
								barWidth:15,
								stack: 'Ad',
								emphasis: {
									focus: 'series'
								},
								itemStyle:{
									color:"#249AEC"
								},
								data: [220, 182, 191, 234, 290, 330, 310]
							},

							{
								name: '15以上',
								type: 'bar',
								barWidth:15,
								stack: 'Ad',
								emphasis: {
									focus: 'series'
								},
								itemStyle:{
									color:"#35C03F"
								},
								data: [150, 232, 201, 154, 190, 330, 410]
							},
							{
								name: '10%~15%',
								type: 'bar',
								barWidth:15,
								stack: 'Ad',
								emphasis: {
									focus: 'series'
								},
								itemStyle:{
									color:"#FFAE00"
								},
								data: [150, 232, 201, 154, 190, 330, 410]
							},
							{
								name: '7%~10%',
								type: 'bar',
								barWidth:15,
								stack: 'Ad',
								emphasis: {
									focus: 'series'
								},
								itemStyle:{
									color:"#FF7214"
								},
								data: [150, 132, 101, 254, 190, 330, 410]
							},


						]
					};
第四种:柱形图
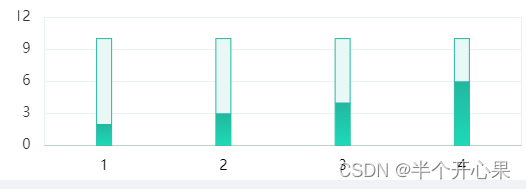
let option = {
						tooltip: {},
						animation: false,
						grid: {
							top: "25%",
							bottom: "16%", //也可设置left和right设置距离来控制图表的大小
							left: '5%',
							right: '5%'
						},
						xAxis: {
							data: [1,2,3,4],
							axisLine: {
								show: true, //隐藏X轴轴线
								lineStyle: {
									color: 'rgba(10,71,62,0.2)'
								}
							},
							axisTick: {
								show: false //隐藏X轴刻度
							},
							axisLabel: {
								show: true,
								margin: 14,
								fontSize: 14,
								textStyle: {
									color: "rgba(0,0,0,1)" //X轴文字颜色
								}
							},

						},
						yAxis: [
							{
								type: "value",
								gridIndex: 0,
								// min: min1,
								// max: max1,
								// interval: (max1 - min1) / 4,
								splitNumber: 4,
								splitLine: {
									show: true,
									lineStyle: {
										color: 'rgba(233,242,241,1)',
										width: 1
									},
								},
								axisTick: {
									show: false
								},
								axisLine: {
									show: true,
									lineStyle: {
										color: 'rgba(233,242,241,1)'
									}
								},
								axisLabel: {
									show: true,
									margin: 14,
									fontSize: 14,
									textStyle: {
										color: "#333" //X轴文字颜色
									}
								},
							},
							{
								name: "%",
								type: "value",
								gridIndex: 0,
								// min: min2,
								// max: max2,
								// interval: (max2 - min2) / 4,
								splitNumber: 4,
								splitLine: {
									show: true,
									lineStyle: {
										color: 'rgba(233,242,241,1)',
										width: 1
									},
								},
								axisTick: {
									show: false
								},
								axisLine: {
									show: true,
									lineStyle: {
										color: 'rgba(233,242,241,1)'
									}
								},
								axisLabel: {
									show: true,
									margin: 14,
									fontSize: 14,
									textStyle: {
										color: "#333" //X轴文字颜色
									}
								},
							},
						],
						legend: {
							top: '5%',
							data: ["总数", "越限"],
							itemWidth:10,
							itemHeight:10,
							itemGap:20
						},
						series: [
							{
								name: "总数",
								type: "bar",
								barWidth: 15,
								itemStyle: {
									normal: {
										color: "#E8F8F5",
										borderColor: '#22B7A0'
									}
								},
								data: [10,10,10,10],
								z: 10,
								zlevel: 0,

							},
							{
								name: "越限",
								type: "bar",
								barWidth: 15,
								barGap: '-100%',
								itemStyle: {
									normal: {
										color: new echarts.graphic.LinearGradient(0, 0, 0, 1, [{
											offset: 0,
											color: "rgba(34,183,160,1)"
										},
										{
											offset: 1,
											color: "rgba(29,218,182,1)"
										}
										])
									}
								},
								data: [2,3,4,6],
								z: 11,
								zlevel: 1,

							},


						]
					};


 386
386


 被折叠的 条评论
为什么被折叠?
被折叠的 条评论
为什么被折叠?
 到【灌水乐园】发言


