


像素点的梯度计算
引文来自:https://blog.csdn.net/huanhuanq1209/article/details/79845061
Sobel算子依然是一种过滤器,只是其是带有方向的。在OpenCV-Python中,使用Sobel的算子的函数原型如下:
dst = cv2.Sobel(src, ddepth, dx, dy[, dst[, ksize[, scale[, delta[, borderType]]]]])
参数介绍
- src:需要处理的图片,一般是由*cv2.imread()*得到的img。
- 第二个参数是图像的深度,-1表示采用的是与原图像相同的深度。目标图像的深度必须大于等于原图像的深度。
- dx和dy表示的是求导的阶数,0表示这个方向上没有求导,一般为0、1、2。这里我们仅需用到1阶即可。
中括号后面的内容是可选参数,其中:
- dst输出与src具有相同大小和相同通道数的图像。
- ksize是Sobel算子的大小,必须为1、3、5、7。
- scale是缩放导数的比例常数,默认情况下没有伸缩系数;
- delta是一个可选的增量,将会加到最终的dst中,同样,默认情况下没有额外的值加到dst中;
- borderType是判断图像边界的模式。这个参数默认值cv2.BORDER_DEFAULT。
补充说明
在Sobel函数的第二个参数这里使用了cv2.CV_16S。因为OpenCV文档中对Sobel算子的介绍中有这么一句:“in the case of 8-bit input images it will result in truncated derivatives”。即Sobel函数求完导数后会有负值,还有会大于255的值。而原图像是uint8,即8位无符号数,所以Sobel建立的图像位数不够,会有截断。因此要使用64位有符号的数据类型,即cv2.CV_64F。
关于图片的位数可参考博客:图像位数的去别
在经过处理后,别忘了用convertScaleAbs()函数将其转回原来的uint8形式。否则将无法显示图像,而只是一副灰色的窗口。convertScaleAbs()的原型为:
dst = cv2.convertScaleAbs(src[, dst[, alpha[, beta]]])
其中可选参数alpha是伸缩系数,beta是加到结果上的一个值。结果返回uint8类型的图片。
由于Sobel算子是在两个方向计算的,最后还需要用*cv2.addWeighted(…)*函数将其组合起来。其函数原型为:
dst = cv2.addWeighted(src1, alpha, src2, beta, gamma[, dst[, dtype]])
其中alpha是第一幅图片中元素的权重,beta是第二个的权重,gamma是加到最后结果上的一个值。
这里是原代码:
#######################################
#create by Ming 2020.1.15
#Sobel test
#to figure out how to deal with Sobel
#######################################
def Sobelmake(img):
    x=cv2.Sobel(img,cv2.CV_64F,1,0,ksize=1)
    y=cv2.Sobel(img,cv2.CV_64F,0,1,ksize=1)

    absX=cv2.convertScaleAbs(x)#convertScaleAbs()该函数可以缩放,取绝对值,转为uint8,这里仅转换格式
    absY=cv2.convertScaleAbs(y)
    dst = cv2.addWeighted(absX,0.5,absY,0.5,0)
    cv2.imshow("raw",img)
    cv2.imshow("absX",absX)
    cv2.imshow("absY",absY)
    cv2.imshow("Result",dst)
    cv2.waitKey(0)
    cv2.destroyAllWindows()
图像分析:
原图像为:

Cell的梯度计算
在计算完每个像素点的梯度大小和方向后,我们需要将cell中所有像素点的梯度大小和方向做一个直方图统计。
在Hog中,一个图像首先根据需求划分出一个block,可以想象为从一个风景照中,用block框住待识别的人。cell则是更小的单元,一般一个cell的大小为8*8像素,即cell_size=8。之后根据cell中每一个像素的梯度大小和方向,将每个像素的梯度放入统计直方图的bin中。这里读者可能就要问bin是什么了。我用一个例子来说明。首先大家知道一个圆是360度,即全方向为360,而我们将其分为9个不同的统计单元,即分为了9个bin,第一个bin是0~40度,第二个bin是40 ~60度…以此类推。
bin
| 序号 | 1 | 2 | 3 | 4 | 5 | 6 | 7 | 8 | 9 |
|---|---|---|---|---|---|---|---|---|---|
| 梯度大小 | |||||||||
| 角度 | 0~40 | 40 ~80 | 80 ~ 120 | 120 ~160 | 160 ~200 | 200~240 | 240~280 | 280~320 | 320~360 |
你可以将bin想象为上图
例:像素点的梯度为35,角度为45度
很明显,这个点的梯度落在了序号为1,和2的bin之间,那么它的梯度大小35则需要被分散统计到1号bin和2号bin中去。具体如何操作见代码:
#######################################
#create by Ming 2020.1.15
#CaculateGradient 计算梯度
#函数作用:计算每个像素的梯度
#######################################
def caculateGrandient(img,cell_size,bin_size):
    height,width=img.shape
    dst,angle=Sobelmake(img)#获取图片的梯度大小和方向
    print("dst:",dst.shape)
    angle_unit=360/bin_size#360度分为bin_size个直方图的刻度
    absDst=abs(dst)#求梯度长度的绝对值
    print("absDst:",absDst.shape)
    cell_gradient_vector=np.zeros((int(height/cell_size),int(width/cell_size),bin_size),dtype=float)
    print ("初始化的cell_gradient_vector",cell_gradient_vector.shape)
    for i in range(cell_gradient_vector.shape[0]):#  i 遍历height方向上的cell
        for j in range(cell_gradient_vector.shape[1]):#  j 遍历 width方向的cell
            cell_magnitude = absDst[i * cell_size:(i + 1) * cell_size,j * cell_size:(j + 1) * cell_size]#举例:i=0,j=1时,cell_magnitude=absDst[0:8,8:16]
            cell_angle = angle[i * cell_size:(i + 1) * cell_size,j * cell_size:(j + 1) * cell_size]
            #print (cell_angle.max())
            cell_gradient_vector[i][j] = cell_gradient(cell_magnitude, cell_angle,bin_size,angle_unit)
    return cell_gradient_vector
函数返回的 cell_gradient_vector 类型为: ( h e i g h t c e l l _ s i z e , w i d t h c e l l _ s i z e , b i n _ s i z e ) \left( \frac{height}{cell\_size}, \frac{width}{cell\_size} ,bin\_size \right) (cell_sizeheight,cell_sizewidth,bin_size)
重新构造可视化Cell直方图
上述统计结束后,我们将每个cell的梯度直方图绘出,得到原图像的特征图。具体代码如下:
######################################
#create by Ming 2020.2.16
#rebuildImage
#重新构造可视化cell直方图
######################################
def rebuildImage(img,cell_gradient_vector,cell_size):
cell_gradient=cell_gradient_vector#直方图向量
height,width=img.shape
hog_image=np.zeros([height,width])#初始化图片长宽高
cell_width=cell_size/2#宽度是cell_size的一半
max_mag=np.array(cell_gradient).max()#max_mag保存向量中最大的那个数
for x in range(cell_gradient.shape[0]):
for y in range(cell_gradient.shape[1]):
cell_grad = cell_gradient[x][y]
cell_grad /= max_mag #猜测是归一化操作,/=运算好像只能用在for循环中
angle = 0 #初始化angle 变量
angle_gap = 360/bin_size #其实就是angle_unit
for magnitude in cell_grad:
angle_radian = math.radians(angle)#将angle从角度转变为弧度
#以(x,y)为中点,(x1,y1)和(x2,y2)为端点,angle_radian为角度,math.sqrt(magnitude)为颜色。在一个cell中画bin_size条线
                x1 = int(x * cell_size + magnitude * cell_width * math.cos(angle_radian))
                y1 = int(y * cell_size + magnitude * cell_width * math.sin(angle_radian))
                x2 = int(x * cell_size - magnitude * cell_width * math.cos(angle_radian))
                y2 = int(y * cell_size - magnitude * cell_width * math.sin(angle_radian))
                cv2.line(hog_image, (y1, x1), (y2, x2), int(255 * math.sqrt(magnitude)))
                angle += angle_gap
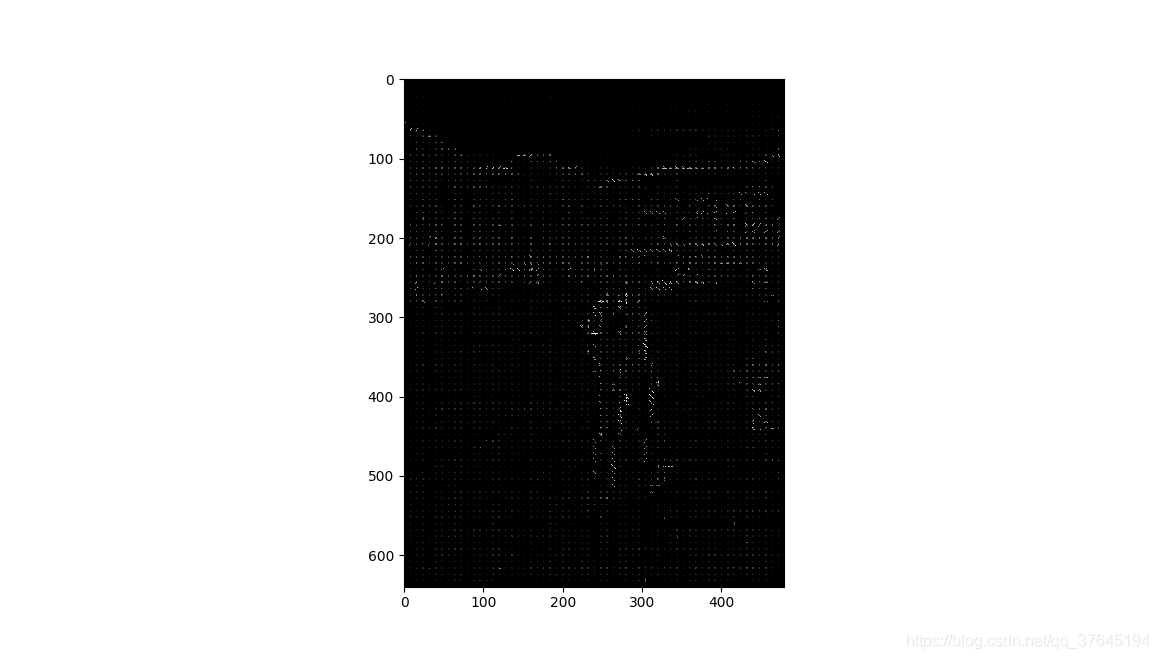
plt.imshow(hog_image, cmap=plt.cm.gray)
plt.show()
在这里解释一下下面几行代码的作用:
x1 = int(x * cell_size + magnitude * cell_width * math.cos(angle_radian))
y1 = int(y * cell_size + magnitude * cell_width * math.sin(angle_radian))
x2 = int(x * cell_size - magnitude * cell_width * math.cos(angle_radian))
y2 = int(y * cell_size - magnitude * cell_width * math.sin(angle_radian))
cv2.line(hog_image, (y1, x1), (y2, x2), int(255 * math.sqrt(magnitude)))
angle += angle_gap
易知x,y为cell在横轴方向和纵轴方向的序号,以cell的左上角作为线段中点,为每个bin画一条线段,线段以(x1,y1)和(x2,y2)为端点,该bin的梯度大小为颜色灰度值。
画出的图像为:


 8869
8869

 被折叠的 条评论
为什么被折叠?
被折叠的 条评论
为什么被折叠?
 到【灌水乐园】发言


