


vue配合gojs实现工业组态绘制
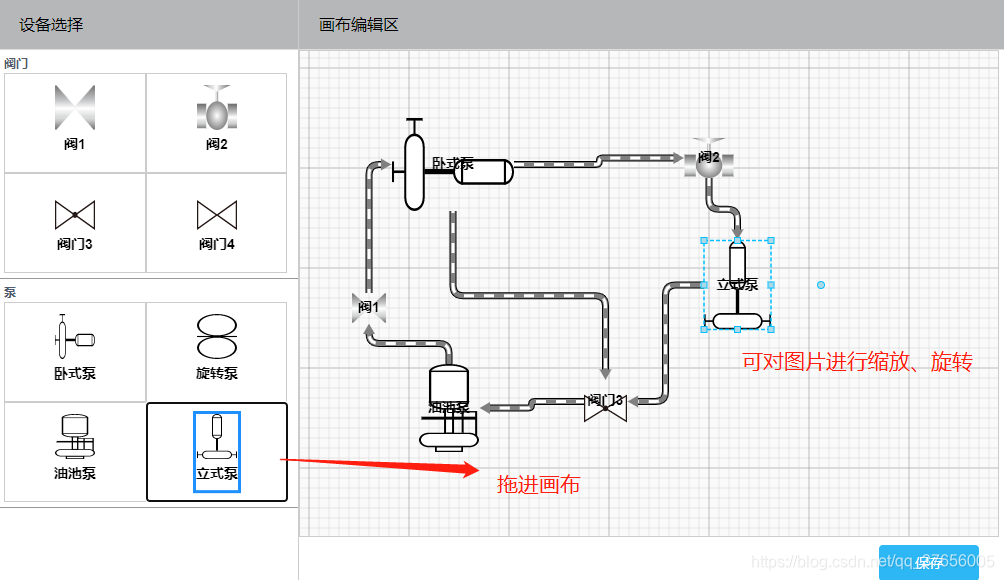
通过从左侧拖拽区拖拽图片到中间画布区,之后可对此图标进行大小尺寸调整,旋转,删除,绑定等操作进行合理布局
亦可以在它里面添加各种交互行为,包括:拖拽、复制、粘贴、选择、鼠标右键事件、剪切、文本编辑、删除、撤销、查看信息、模板、数据源绑定、事件处理程序、调色板、自动布局、添加画布或者节点的监听事件等操作
效果图
实现思路:
1.页面左右两侧布局
左侧拖拽区采用for循环列表实现,列表内包含多组图源
<div class="paletteLeft fl inner-layout" >
    <ul>
      <li class="paletteLi" v-for="(panelItem,index) in panelList" :key="'pal-' + index">
        <span class="panelTitle">{{panelItem.name}}</span>
        <div class="paletteDiv" v-for="(panelTypeItem,panelTypeIndex) in panelItem.children" :key="'panelType-'+panelTypeIndex">
          <div style="width: 100%;height: 100%" :id="'myPaletteDiv_'+panelTypeItem.cid" ></div>
        </div>
      </li>
    </ul>
  </div>
中间画布区定义一个div,设id
 <div class="centerArea">
      <div id="myDiagramDiv" class="exampleConfigContent"></div>
      <Button type="info" size="large"  @click="saveGOJS" class="fr" style="width: 100px;z-index: 1000;position: absolute; right: 20px;bottom: 6px;">保存</Button>
    </div>
这样简单的页面布局就设置好啦
2.绘制画布区域
定义画布样式、模板节点样式、连接线样式等等,当然里面有好多自己封装的方法,后面有完整代码可参考
let myDiagram =
          $(go.Diagram, 'myDiagramDiv',  // 必须命名或引用div HTML元素
            configDiagram(),
            diagramDefined()
          );

        myDiagram.nodeTemplate = //定义模板的类型
          $(go.Node, "Spot",
            $(go.Panel, "Vertical",
              //设置节点的图片
              $(go.Picture, pictureStyle(),{desiredSize: new go.Size(40, 45)},
                new go.Binding("source","source",findHeadShot),
              ),
              //节点的文本说明
              $(go.TextBlock, textBlockStyle())
            )
          );

        //连线
        myDiagram.linkTemplate =
          $(go.Link, linkStyle(),
            $(go.Shape, { isPanelMain: true, stroke: "black", strokeWidth: 7 }),
            $(go.Shape, { isPanelMain: true, stroke: "gray", strokeWidth: 5 }),
            $(go.Shape, { isPanelMain: true, stroke: "white", strokeWidth: 3, name: "PIPE", strokeDashArray: [10, 10] }),
            $(go.Shape, { toArrow: "Triangle", scale: 1.3, fill: "gray", stroke: null }),
            _this.$refs.linkChild.deleteLinkComponent()
          );
定义图片节点样式
 //定义图片模板的类型
        var pictureComponent =
          $(go.Node, 'Spot',nodeStyle(),
            {locationSpot: go.Spot.Center},
            //设置节点的图片
            $(go.Picture, pictureStyle(),
              new go.Binding("source","source",findHeadShot),
            ),
            //节点的文本说明
            $(go.TextBlock, textBlockStyle()),
            makePortCopy()
            // {contextMenu:commandsAdornmentTextOrPicture},
          );
把上述节点挂载到画布上
 //挂载默认节点模板到画布
        let tempMapNode = new go.Map();
        tempMapNode.add("pictureTemplate", pictureComponent);
        tempMapNode.add("", myDiagram.nodeTemplate);
        myDiagram.nodeTemplateMap = tempMapNode;
保存方法,导出字符串,可供之后导入用
  saveGOJS() {
        console.log("保存", this.myDiagram.model.toJson())
      }
保存的数据格式为
saveData:{ “class”: “GraphLinksModel”,“nodeDataArray”: [],“linkDataArray”:[]}
3.绘制左侧拖拽区,要点在于:定义左侧节点模板要引用定义画布区的节点模板,也就是nodeTemplate: diagram.nodeTemplate,diagram代表画布区域的diagram,通过组件prop引入
 _this.palette[j] =
              $(go.Palette, cid,
                {
                  //节点模板
                  nodeTemplate: diagram.nodeTemplate,
                  contentAlignment: go.Spot.Center
                });
            _this.palette[j].model = new go.GraphLinksModel([
              { key: "pictureNode",category: "pictureTemplate",text: componentText,  source: imgShow, loc: "0 0"}
            ]);
以上只是简单介绍了一下实现思路,具体实现代码在文章后面
下面介绍一些封装方法
封装节点,可旋转,可选择,可缩放,以及定义其他一些属性
function nodeStyle() {
  return [
    new go.Binding("location", "loc", go.Point.parse).makeTwoWay(go.Point.stringify),
    {alignment: go.Spot.Center, desiredSize: new go.Size(50, 55)},
    {selectable: true, selectionAdornmentTemplate: nodeSelectionAdornmentTemplate},
    {resizable: true, resizeObjectName: "Picture", resizeAdornmentTemplate: nodeResizeAdornmentTemplate},
    {rotatable: true, rotateAdornmentTemplate: nodeRotateAdornmentTemplate},
    new go.Binding("angle").makeTwoWay(),
    new go.Binding("desiredSize", "size", go.Size.parse).makeTwoWay(go.Size.stringify)
  ];
}
定义鼠标进入节点方位内,显示8个小端口,用于连线
function makePortCopy() {
  return [
    makePort("T", go.Spot.Top, true, true),
    makePort("TL", go.Spot.TopLeft, true, true),
    makePort("L", go.Spot.Left, true, true),
    makePort("BL", go.Spot.BottomLeft, true, true),
    makePort("R", go.Spot.Right, true, true),
    makePort("TR", go.Spot.TopRight, true, true),
    makePort("BR", go.Spot.BottomRight, true, true),
    makePort("B", go.Spot.Bottom, true, true),
    { // 处理鼠标进入/离开事件以显示/隐藏端口
      mouseEnter: function (e, node) {
        showSmallPorts(node, true);
      },
      mouseLeave: function (e, node) {
        showSmallPorts(node, false);
      }
    }
  ]
}
还有很多封装方法,都在后面的具体代码中,就不一一介绍了
如果想了解更多关于gojs的相关知识,可查看我其他相关文章哦~
具体云盘代码链接
链接:https://pan.baidu.com/s/1Pz-NlPpHzY5XANs55GE6ug
提取码:y817
使用方法:
1.安装依赖cnpm install
2.运行npm run dev


 1万+
1万+


 被折叠的 条评论
为什么被折叠?
被折叠的 条评论
为什么被折叠?
 到【灌水乐园】发言


