


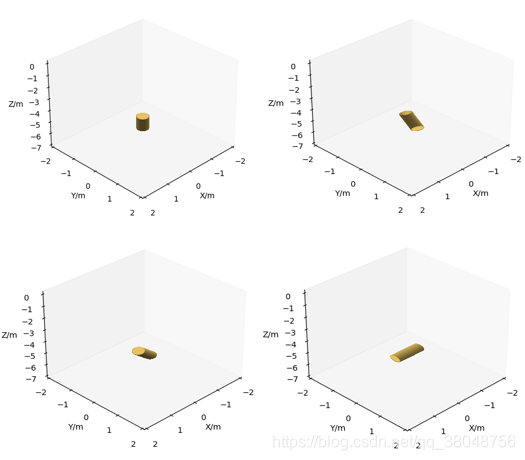
介绍下需求:使用matplotlib在一个3D坐标轴下绘制任意位置、任意姿态的圆柱体。
分析:可以看出这里主要解决的问题有两个,一个是绘制圆柱体,另一个是圆柱体的姿态控制。其中对于姿态的控制,需要用到欧拉旋转矩阵。
核心思想:
- 首先绘制中心坐标为(0,0,0)的半径为1、高为1的圆柱面(相当于是单位1的圆柱面),注意此时绘制出来的没有上底和下底,圆柱面的绘制主要通过将高度坐标1分为两份(-0.5,0.5)即底边和顶边的高度对应z坐标,将2*pi的角度u平分成若干份,sin(u)对应x坐标,cos(u)对应y坐标(此处利用圆心为(0,0)的极坐标公式)
- 将每个高度z与x,y分别对应,此时即得到圆柱体上底与下底的三维坐标,此时对x,y,z坐标进行相应调整即可构造出不同位置,不同姿态,不同大小的圆柱体的上底和下底的三维坐标
- 利用matplotlib中的plot_surface方法即可绘制出圆柱面,此时绘制的仅仅为圆柱曲面,另外需要把两个底面补上,利用上面得到的上底与下底的3维坐标,利用add_collection3d方法即可将底面和顶面补上。
关于圆柱体的绘制
plot_surface函数的定义如下:
def plot_surface(self, X, Y, Z, *args, norm=None, vmin=None,
                 vmax=None, lightsource=None, **kwargs):
    """
    Create a surface plot.
    Parameters
    ----------
    X, Y, Z : 2d arrays

    color : color-like
    Color of the surface patches.可以设置16进制的rgb颜色

    rstride=1,  # rstride(row)指定行的跨度
    cstride=1,  # cstride(column)指定列的跨度
add_collection3d函数的定义
def add_collection3d(self, col, zs=0, zdir='z'):
    """
    Add a 3D collection object to the plot.

    2D collection types are converted to a 3D version by
    modifying the object and adding z coordinate information.

    Supported are:
        - PolyCollection
        - LineCollection
        - PatchCollection
    """
PolyCollection表示3维多边形的集合类,可以通过该类对平面多边形给出正确的填充外观,该类的定义如下:
def __init__(self, verts, *args, zsort='average', **kwargs):

    """
    Parameters
    ----------
    verts : list of array-like Nx3
        Each element describes a polygon as a sequence of ``N_i`` points
        ``(x, y, z)``.
    facecolors:可以为平面设置16进制的rgb颜色
    """
Notes:
关于圆柱面的绘制可以参考https://blog.csdn.net/weixin_41494909/article/details/86257870
PolyCollection类中的verts参数为包含表示多边形的坐标的元组的list,进而通过add_collection3d函数在3D坐标轴下绘制填充颜色的平面。多边形填充这部分参考:https://stackoverflow.com/questions/64029288/plotting-poly3dcollection-using-add-collection3d
圆柱的姿态问题
解释一下欧拉角:
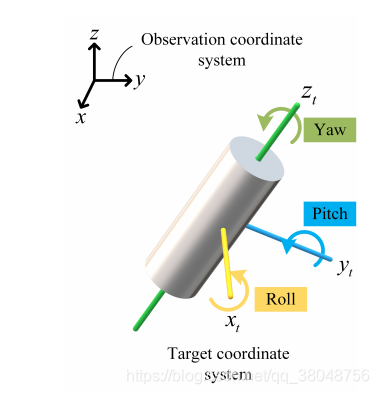
如上图所示欧拉角Yaw,Pitch以及Roll,这三个角度的可以决定物体的姿态,由这3个角度可计算欧拉旋转矩阵,而相对于观察坐标系,物体的姿态发生变化时,只需要通过原位置坐标乘以欧拉旋转矩阵即可得到姿态变化后的物体在观测坐标系下的坐标。
更详细的内容可以参考:https://www.cnblogs.com/flyinggod/p/8144100.html
由上面的图,可以看出来,对于圆柱体而言,无论Yaw角度如何变化,物体的姿态是不变化的,所以对于圆柱体而言,只有pitch和Roll角度控制着物体的姿态。
欧拉旋转矩阵的实现代码如下:
def RotationMatrix(theta, phi, psi):
    '''将观测坐标系中的向量v转换成物体坐标系中向量v'或者将向量(坐标)绕原点旋转.

    Notes
    -----
    此程序旋转顺序(z->y->x),内旋.
    .每种特定顺序的外旋等价于其相反顺序的内旋,反之亦然.
    .坐标系绕原点旋转的旋转矩阵与向量(坐标)绕原点旋转的旋转矩阵互为转置.
    .世界坐标系向目标坐标系旋转的旋转矩阵与目标坐标系向世界坐标系旋转的旋转矩阵互为转置.
    '''

    theta, phi, psi = theta * pi / 180, phi * pi / 180, psi * pi / 180

    Rz = np.mat([[cos(psi), sin(psi), 0],
                 [-sin(psi), cos(psi), 0],
                 [0, 0, 1]])

    Ry = np.mat([[cos(theta), 0, -sin(theta)],
                 [0, 1, 0],
                 [sin(theta), 0, cos(theta)]])

    Rx = np.mat([[1, 0, 0],
                 [0, cos(phi), sin(phi)],
                 [0, -sin(phi), cos(phi)]])

    return Rx * Ry * Rz
代码示例
示例:
import numpy as np
from math import *
from mpl_toolkits.mplot3d.art3d import Poly3DCollection
import matplotlib.pyplot as plt
class Target(object):
"""Refer in particular to cylinder targets.
Attributes
----------
radius: float
The radius of the base of a cylinder
pitch: float
the pitch angle of the cylinder
roll: float
the roll angle of the cylinder
yaw:float
the roll angle of the cylinder
length: float
the length of the target
position: list
the position of the target, [x, y, z]
"""
def __init__(self, radius, pitch, roll, yaw, length, position_x, position_y, position_z, **kwargs):
self.radius = radius
self.pitch = pitch
self.roll = roll
self.yaw = yaw
self.length = length
self.position = [position_x, position_y, position_z]
def RotationMatrix(theta, phi, psi):
'''将观测坐标系中的向量v转换成物体坐标系中向量v'或者将向量(坐标)绕原点旋转.
Notes
-----
此程序旋转顺序(z->y->x),内旋.
.每种特定顺序的外旋等价于其相反顺序的内旋,反之亦然.
.坐标系绕原点旋转的旋转矩阵与向量(坐标)绕原点旋转的旋转矩阵互为转置.
.世界坐标系向目标坐标系旋转的旋转矩阵与目标坐标系向世界坐标系旋转的旋转矩阵互为转置.
'''
theta, phi, psi = theta * pi / 180, phi * pi / 180, psi * pi / 180
Rz = np.mat([[cos(psi), sin(psi), 0],
[-sin(psi), cos(psi), 0],
[0, 0, 1]])
Ry = np.mat([[cos(theta), 0, -sin(theta)],
[0, 1, 0],
[sin(theta), 0, cos(theta)]])
Rx = np.mat([[1, 0, 0],
[0, cos(phi), sin(phi)],
[0, -sin(phi), cos(phi)]])
return Rx * Ry * Rz
def show_cylinder(fig, target):
"""在3D坐标轴下展示一个任意位置,任意姿态的圆柱体
Parameters
----------
fig : matplotlib.figure.Figure
传入一个空白的fig
target : class Target
一个圆柱体
"""
fig.clf() # Clear the figure in different detection scene
# show the metal cylinder
u = np.linspace(0, 2 * np.pi, 50) # 把圆划分50等份
h = np.linspace(-0.5, 0.5, 2) # 把高(1m)划分两等份,对应上底和下底
x = target.radius * np.sin(u)
y = target.radius * np.cos(u)
x = np.outer(x, np.ones(len(h))) # 20*2
y = np.outer(y, np.ones(len(h))) # 20*2
z = np.outer(np.ones(len(u)), h) # 20*2
z = z * target.length
x_rotation = np.ones(x.shape) # 旋转后的坐标 20*2
y_rotation = np.ones(y.shape)
z_rotation = np.ones(z.shape)
th1 = target.pitch
th2 = target.roll
th3 = target.yaw
a = np.array(RotationMatrix(th1, th2, th3)) # 3*3 pitch,roll
for i in range(2):
r = np.c_[x[:, i], y[:, i], z[:, i]] # 20*3
rT = r @ a # 20*3
x_rotation[:, i] = rT[:, 0]
y_rotation[:, i] = rT[:, 1]
z_rotation[:, i] = rT[:, 2]
ax = fig.add_subplot(projection='3d')
ax.view_init(30, 45)
ax.plot_surface(x_rotation + target.position[0], y_rotation + target.position[1], z_rotation + target.position[2],
color='#E7C261', alpha=1, antialiased=False)
verts = [list(zip(x_rotation[:, 0] + target.position[0], y_rotation[:, 0] + target.position[1],
z_rotation[:, 0] + target.position[2]))]
ax.add_collection3d(Poly3DCollection(verts, facecolors='#E7C261'))
verts = [list(zip(x_rotation[:, 1] + target.position[0], y_rotation[:, 1] + target.position[1],
z_rotation[:, 1] + target.position[2]))]
ax.add_collection3d(Poly3DCollection(verts, facecolors='#E7C261'))
ax.set_xticks(np.arange(-2, 3, 1))
ax.set_yticks(np.arange(-2, 3, 1))
ax.set_xlabel('X/m')
ax.set_ylabel('Y/m')
ax.set_zlabel('Z/m')
ax.set_xlim(-2, 2)
ax.set_ylim(-2, 2)
ax.set_zlim(target.position[2] - 2, 0.1)
ax.grid(None) # delete the background grid
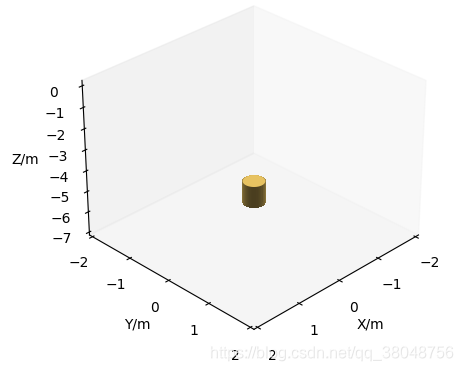
target = Target(0.2, 0, 0, 0, 1, 0, 0, -5)
fig = plt.figure()
show_cylinder(fig, target)
plt.show()
运行结果:


 被折叠的 条评论
为什么被折叠?
被折叠的 条评论
为什么被折叠?
 到【灌水乐园】发言


