


示例图:
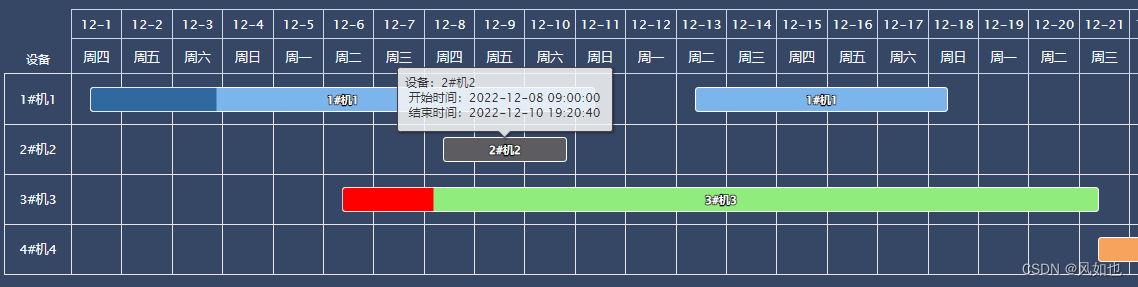
官方文档参考:highcharts gantt
甘特图示例
使用示例:
<template>
  <div id="container"></div>
</template>

<script>
export default {
  mounted() {
    let month = "2022-12";
    const moment = this.$moment;
    const WEEKS = {
      0: "日",
      1: "一",
      2: "二",
      3: "三",
      4: "四",
      5: "五",
      6: "六",
    };
    const data = [
      {
        name: "1#机1",
        start: new Date("2022-12-01 09:00:00").getTime(),
        end: new Date("2022-12-11 09:00:00").getTime(),
        completed: 0.25,
        y: 0,
      },
      {
        name: "1#机1",
        start: new Date("2022-12-13 09:00:00").getTime(),
        end: new Date("2022-12-18 09:00:00").getTime(),
        y: 0,
      },
      {
        name: "2#机2",
        start: new Date("2022-12-08 09:00:00").getTime(),
        end: new Date("2022-12-10 19:20:40").getTime(),
        y: 1,
      },
      {
        name: "3#机3",
        start: new Date("2022-12-06 09:00:00").getTime(),
        end: new Date("2022-12-21 09:00:00").getTime(),
        completed: {
          amount: 0.12,
          fill: "red",
        },
        y: 2,
      },
      {
        name: "4#机4",
        start: new Date("2022-12-21 09:00:00").getTime(),
        end: new Date("2022-12-31 09:00:00").getTime(),
        y: 3,
      },
    ];
    // 自定义主题
    const my_skin = {
      //颜色数组,默认从数组第一个元素取色
      // colors: [
      //   "#33FF33",
      //   "#f45b5b",
      //   "#7798BF",
      //   "#aaeeee",
      //   "#ff0066",
      //   "#eeaaee",
      //   "#55BF3B",
      //   "#DF5353",
      //   "#7798BF",
      //   "#aaeeee",
      // ],
      //背景
      chart: {
        backgroundColor: "#364766",
      },
      xAxis: {
        labels: {
          style: {
            color: "#f5f7fa",
          },
        },
      },
      yAxis: {
        title: {
          style: { color: "#f5f7fa" },
        },
        markable: { enabled: false }, //不显示每一个点的实心
        labels: {
          style: {
            color: "#f5f7fa",
          },
        },
      },
      global: {
        useUTC: false, // 不使用utc时间
      },
      lang: {
        noData: "暂无数据",
      },
    };
    // 全局配置,需要在图标初始化之前配置
    this.$highcharts.setOptions(my_skin, {
      global: {
        useUTC: false, // 不使用utc时间
      },
      lang: {
        noData: "暂无数据",
      },
    });
    let max = moment(this.queryForm.plan_date2).add(1, "days");
    this.$highcharts.ganttChart("container", {
      xAxis: [
        {
          min: moment(month).valueOf(),
          // max: moment(max).valueOf(), // 根据时间区间选择
          max: moment(month).endOf("month").valueOf(), // 根据每个月选择
          gridLineEidth: 1,
          minTickInterval: 1000 * 60 * 60 * 24,
          currentDateIndicator: true,
          tickPixelInterval: 70,
          grid: {
            borderWidth: 1, // 右侧表头边框宽度
            cellHeight: 35, // 右侧日期表头高度
          },
          labels: {
            align: "center",
            formatter: function () {
              return `周${WEEKS[moment(this.value).day()]}`;
            },
          },
        },
        {
          gridLineWidth: 1,
          minTickInterval: 1000 * 60 * 60 * 24,
          tickPixelInterval: 100,
          grid: {
            borderWidth: 1, // 右侧表头边框宽度
            cellHeight: 30, // 右侧日期表头高度
          },
          labels: {
            align: "center",
            formatter: function () {
              return `${moment(this.value).format("M-D")} `;
            },
          },
        },
      ],
      yAxis: {
        type: "category",
        grid: {
          enabled: true,
          borderColor: "#e6e6e6",
          borderWidth: 1,
          columns: [
            {
              title: {
                text: "设备",
              },
              labels: {
                format: "{point.name}",
              },
            },
          ],
        },
      },
      tooltip: {
        formatter: function () {
          return `<div>
            设备:${this.point.name}
            <br />
            开始时间:${moment(this.point.start).format("YYYY-MM-DD HH:mm:ss")}
            <br />
            结束时间:${moment(this.point.end).format("YYYY-MM-DD HH:mm:ss")}
          </div>`;
        },
      },
      series: [
        {
          data,
        },
      ],
      plotOptions: {
        series: {
          animation: false, // Do not animate dependency connectors
          dragDrop: {
            draggableX: false, // 横向拖拽
            draggableY: false, // 纵向拖拽
            dragMinY: 0, // 纵向拖拽下限
            dragMaxY: 3, // 纵向拖拽上限
            dragPrecisionX: 3600000, // 横向拖拽精度,单位毫秒
          },
          dataLabels: {
            enabled: true,
            format: "{point.name}",
            style: {
              cursor: "default",
              pointerEvents: "none",
              color: "#ffffff",
            },
          },
          allowPointSelect: true,
        },
      },
      exporting: {
        sourceWidth: 1000,
      },
      credits: {
        // 去掉右下角版权信息
        enabled: false,
      },
      chart: {
        spacingLeft: 10,
        spacingTop: 10,
      },
      pane: {
        background: [
          {
            backgroundColor: "red",
          },
        ],
      },
    });
  },
};
</script>


 296
296

 被折叠的 条评论
为什么被折叠?
被折叠的 条评论
为什么被折叠?
 到【灌水乐园】发言


