


1 创建项目
1.1.1 vue create vision


1. 2 删除无关代码
修改 App.vue 中的代码,将布局和样式删除
删除 components/HelloWorld.vue 这个文件
删除 views/About.vue 和 views/Home.vue 这两个文件
修改 router/index.js 中的代码,去除路由配置和 Home 组件导入的代码
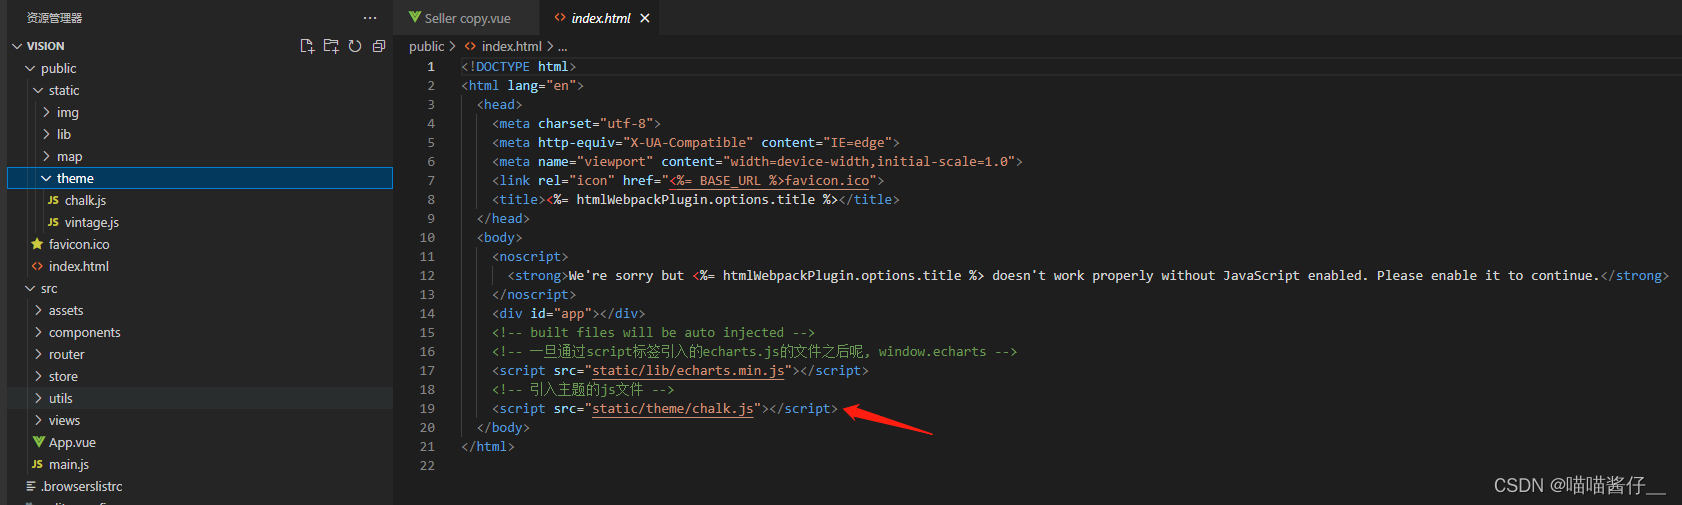
1.3 静态资源的引入
放在public目录下!!!!

1.4 项目的基本配置
在项目根目录下创建 vue.config.js 文件 在文件中增加代码:
// 使用vue-cli创建出来的vue工程, Webpack的配置是被隐藏起来了的

// 如果想覆盖Webpack中的默认配置,需要在项目的根路径下增加vue.config.js文件

module.exports = {
  devServer: {
    port: 8999, // 端口号的配置

    open: true // 自动打开浏览器

 }
}
1.5 全局echarts 对象的挂载

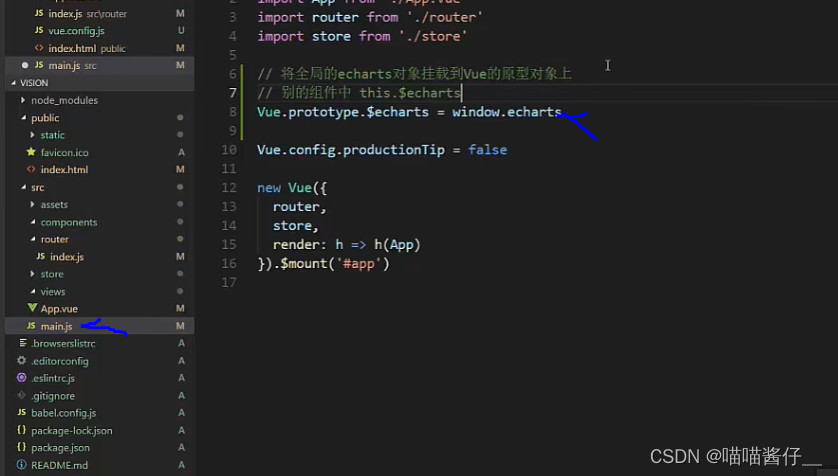
2 挂载到 Vue 原型上
在 src/main.js 文件中挂载 由于在 index.html 中已经通过script标签引入了 echarts.js 文件夹, 故在 window 全局对象中是 存在 echarts 全局对象, 将其挂载到 Vue 的原型对象上
1.6 axios的封装与挂载
1安装
npm install axios
2封装 axios 对象

单独图标组件的开发
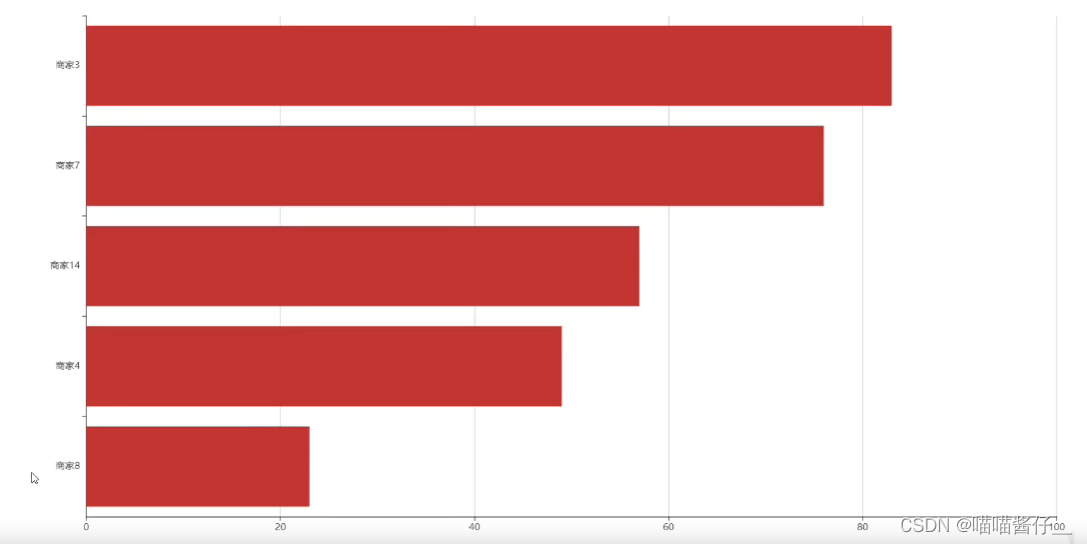
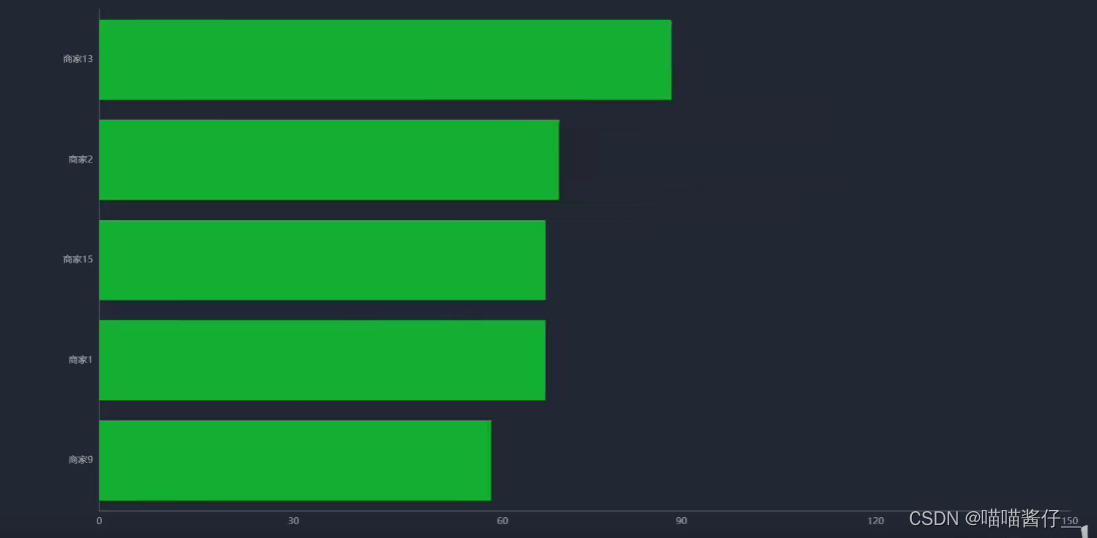
2 商家销售统计(横向柱状图)

2.1组件结构的设计


最终呈现在seller.vue当中(全屏展示的图)
2.2 布局
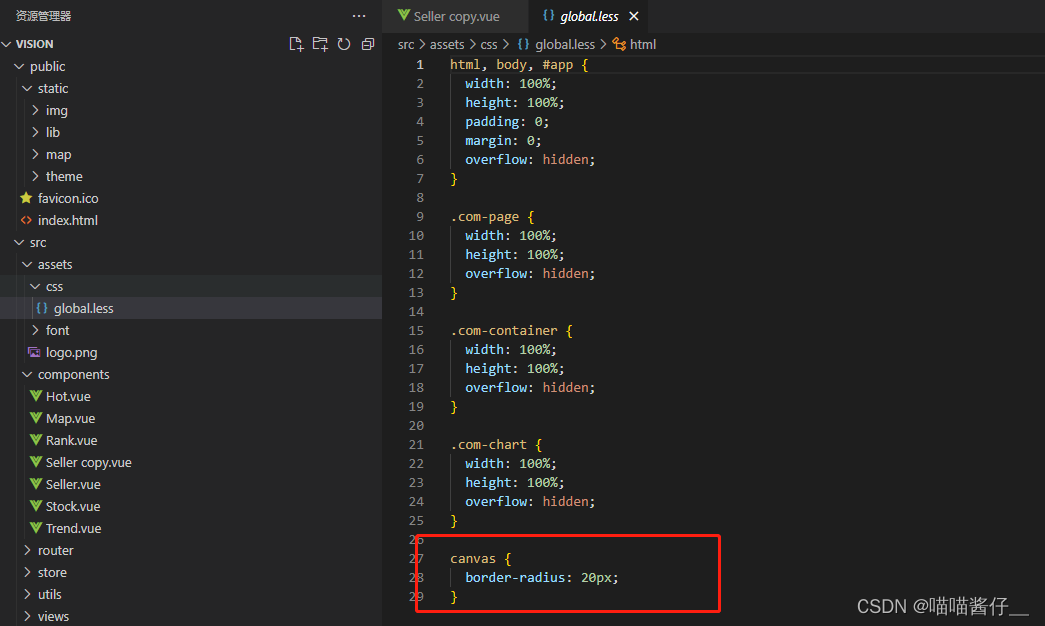
1 创建全局样式 globa.csss
编写全局样式globa.csss,并引入到 min.js当中

2.3 图标基本功能

1基本架子
<script>
export default {
data () {
return {
chartInstance: null,
allData: null // 服务器返回的数据
}
},
mounted () {
this.initChart()
this.getData()
},
methods: {
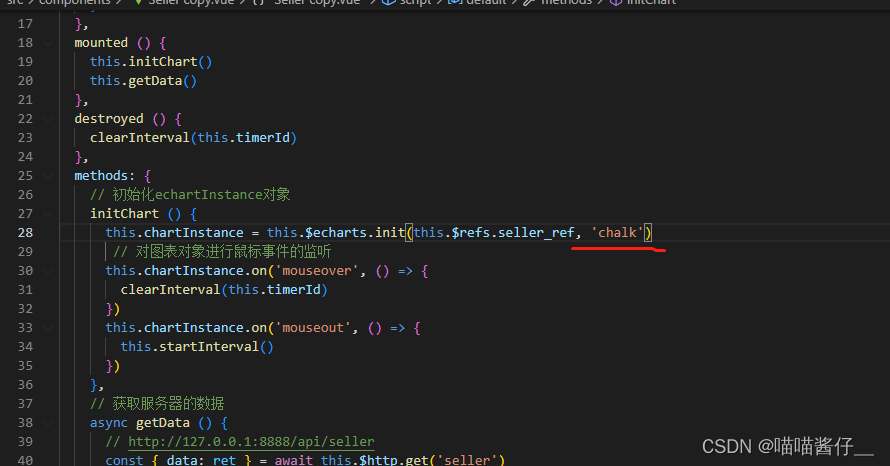
// 初始化echartInstance对象
initChart () {
this.chartInstance = this.$echarts.init(this.$refs.seller_ref, 'chalk')
},
// 获取服务器的数据
async getData () {
// http://127.0.0.1:8888/api/seller
const { data: ret } = await this.$http.get('seller')
this.allData = ret
this.updateChart()
}
},
// 更新图表
updateChart () {
// 对图表初始化配置的控制
const initOption = {}
this.chartInstance.setOption(initOption)
}
}
</script>2 编写option

设置option时候,要进行数据的转换


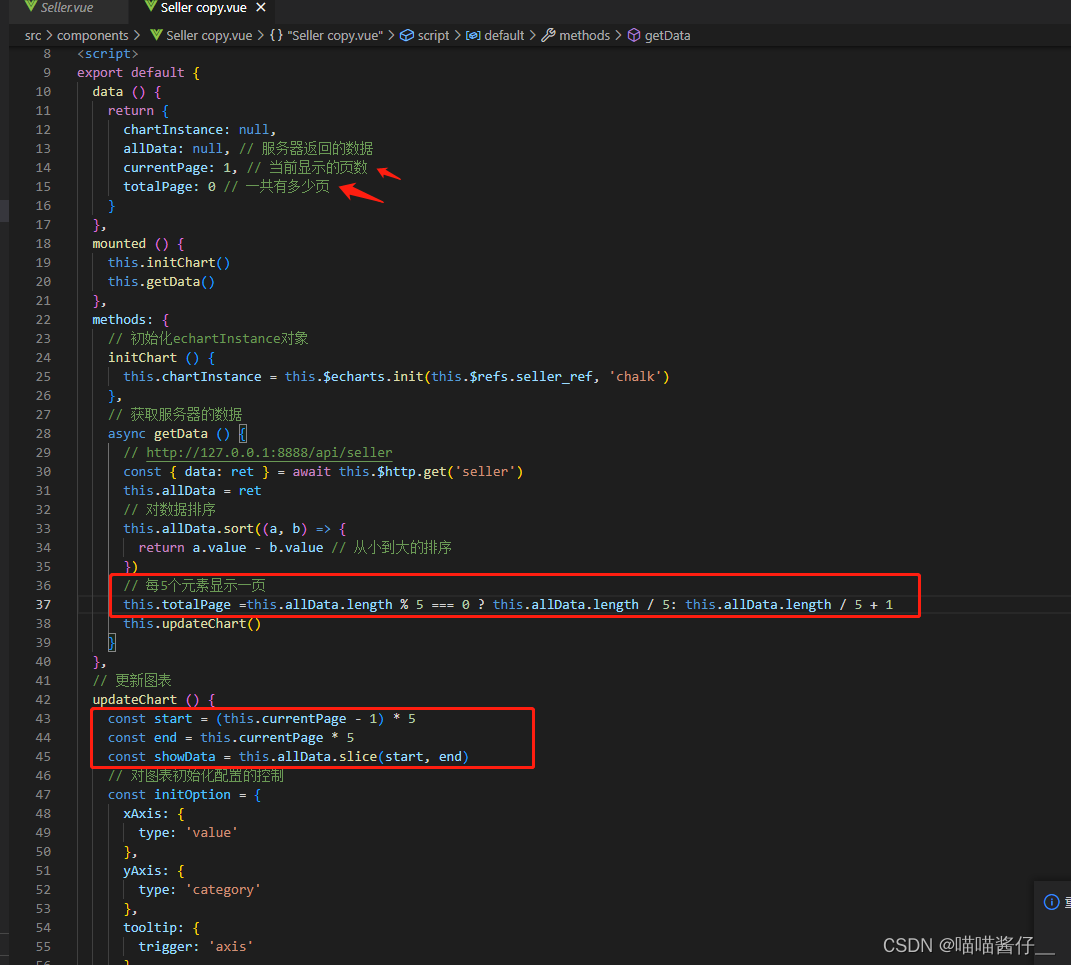
2.4 动态刷新的实现
分页进行展示的,每一页展示5条。 通过动态刷新的方式进行数据的切换
1 数据的处理
从小到大的排序
每5个元素展示一页
1 从小到大排序


2每5个元素展示一页
2 定时器 实现自动的变化


还有鼠标移入,移除时候也会 进行定时器的变化:移入的时候可能是用户要聚焦查看数据

2.5 ui的调整
1使用主题
2 图表的圆角

3 图标的标题


4 坐标轴的配置


紧贴边缘了,因为left:3% 不包括文字,只是坐标轴发生了移动
解决:


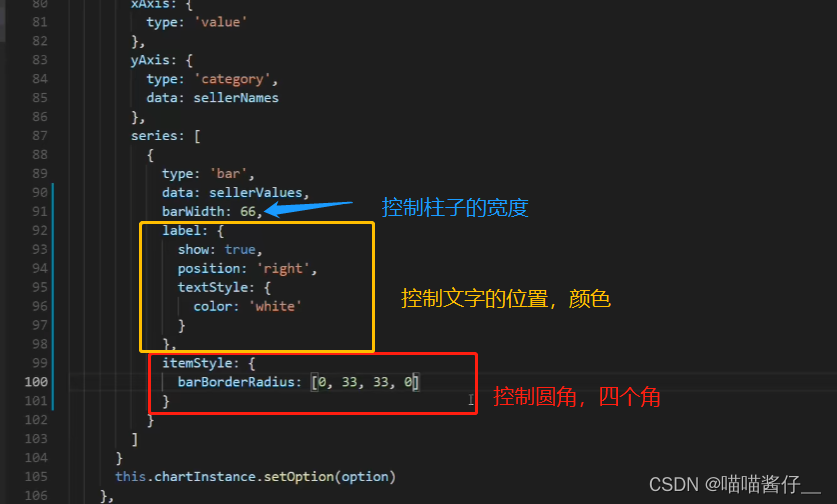
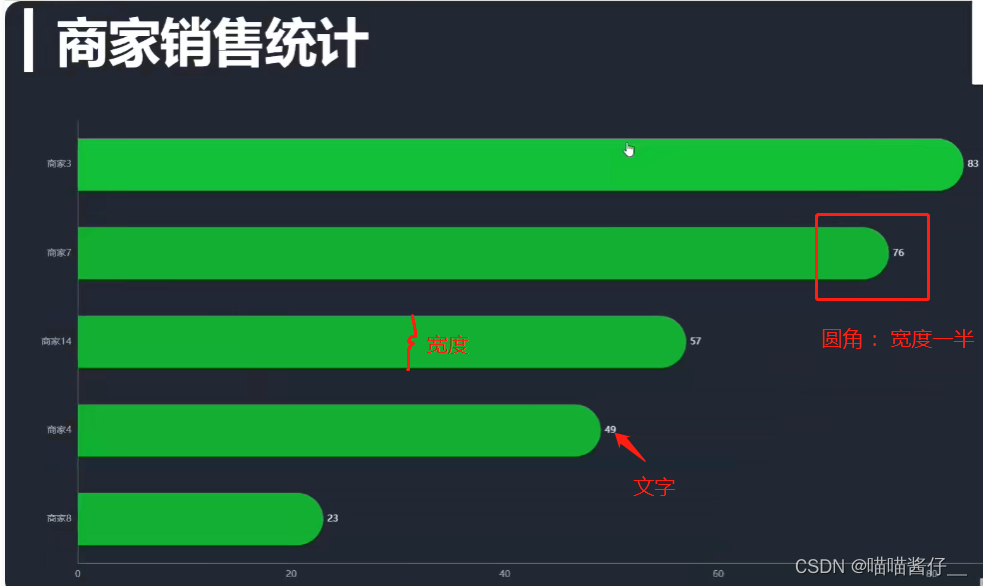
5 柱状图条目的控制
宽度, 文字,右边圆角, 颜色渐变, 背景

1宽度, 文字,右边圆角
2 颜色渐变

  color: new this.$echarts.graphic.LinearGradient(0, 0, 1, 0, [
                // 百分之0状态之下的颜色值
                {
                  offset: 0,
                  color: '#5052EE'
                },
                // 百分之100状态之下的颜色值
                {
                  offset: 1,
                  color: '#AB6EE5'
                }
              ])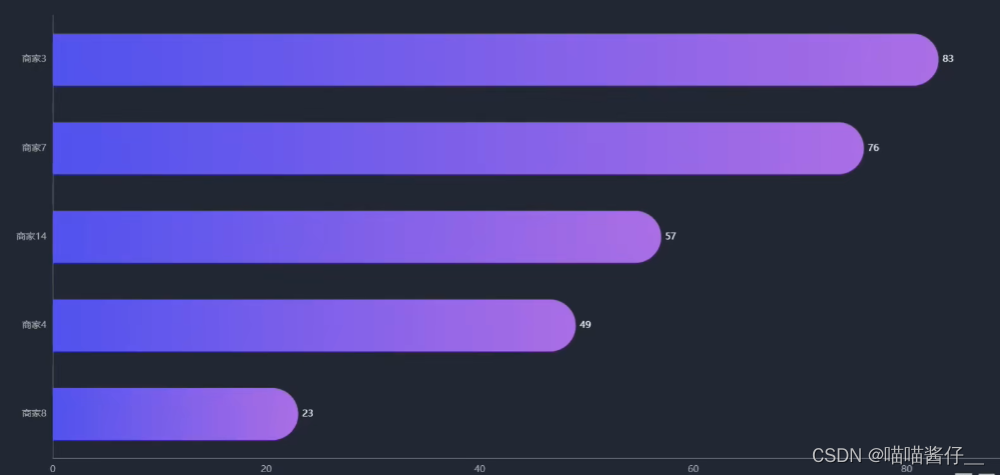
3背景


     const initOption = {
        title: {
          text: '▎商家销售统计',
          left: 20,
          top: 20
        },
        grid: {
          top: '20%',
          left: '3%',
          right: '6%',
          bottom: '3%',
          containLabel: true // 距离是包含坐标轴上的文字
        },
        xAxis: {
          type: 'value'
        },
        yAxis: {
          type: 'category'
        },
        tooltip: {
          trigger: 'axis',
          axisPointer: {
            type: 'line',
            z: 0,
            lineStyle: {
              color: '#2D3443'
            }
          }
        },
        series: [
          {
            type: 'bar',
            label: {
              show: true,
              position: 'right',
              textStyle: {
                color: 'white'
              }
            },
            itemStyle: {
              // 指明颜色渐变的方向
              // 指明不同百分比之下颜色的值
              color: new this.$echarts.graphic.LinearGradient(0, 0, 1, 0, [
                // 百分之0状态之下的颜色值
                {
                  offset: 0,
                  color: '#5052EE'
                },
                // 百分之100状态之下的颜色值
                {
                  offset: 1,
                  color: '#AB6EE5'
                }
              ])
            }
          }
        ]
      }
2.6 拆分图标的option
updateChart:对数据图标的更新,option 不能都写在updateChart方法里边,我们要进行拆分


2.7 分辨率适配
随着浏览器的大小而自适应的变化


3代码
<!-- 商家销量统计的横向柱状图 -->
<template>
  <div class="com-container">
    <div class="com-chart" ref="seller_ref"></div>
  </div>
</template>

<script>
export default {
  data () {
    return {
      chartInstance: null,
      allData: null, // 服务器返回的数据
      currentPage: 1, // 当前显示的页数
      totalPage: 0, // 一共有多少页
      timerId: null // 定时器的标识
    }
  },
  mounted () {
    this.initChart()
    this.getData()
    window.addEventListener('resize', this.screenAdapter)
    // 在页面加载完成的时候, 主动进行屏幕的适配
    this.screenAdapter()
  },
  destroyed () {
    clearInterval(this.timerId)
    // 在组件销毁的时候, 需要将监听器取消掉
    window.removeEventListener('resize', this.screenAdapter)
  },
  methods: {
    // 初始化echartInstance对象
    initChart () {
      this.chartInstance = this.$echarts.init(this.$refs.seller_ref, 'chalk')
      // 对图表初始化配置的控制
      const initOption = {
        title: {
          text: '▎商家销售统计',
          left: 20,
          top: 20
        },
        grid: {
          top: '20%',
          left: '3%',
          right: '6%',
          bottom: '3%',
          containLabel: true // 距离是包含坐标轴上的文字
        },
        xAxis: {
          type: 'value'
        },
        yAxis: {
          type: 'category'
        },
        tooltip: {
          trigger: 'axis',
          axisPointer: {
            type: 'line',
            z: 0,
            lineStyle: {
              color: '#2D3443'
            }
          }
        },
        series: [
          {
            type: 'bar',
            label: {
              show: true,
              position: 'right',
              textStyle: {
                color: 'white'
              }
            },
            itemStyle: {
              // 指明颜色渐变的方向
              // 指明不同百分比之下颜色的值
              color: new this.$echarts.graphic.LinearGradient(0, 0, 1, 0, [
                // 百分之0状态之下的颜色值
                {
                  offset: 0,
                  color: '#5052EE'
                },
                // 百分之100状态之下的颜色值
                {
                  offset: 1,
                  color: '#AB6EE5'
                }
              ])
            }
          }
        ]
      }
      this.chartInstance.setOption(initOption)
      // 对图表对象进行鼠标事件的监听
      this.chartInstance.on('mouseover', () => {
        clearInterval(this.timerId)
      })
      this.chartInstance.on('mouseout', () => {
        this.startInterval()
      })
    },
    // 获取服务器的数据
    async getData () {
      // http://127.0.0.1:8888/api/seller
      const { data: ret } = await this.$http.get('seller')
      this.allData = ret
      // 对数据排序
      this.allData.sort((a, b) => {
        return a.value - b.value // 从小到大的排序
      })
      // 每5个元素显示一页
      this.totalPage = this.allData.length % 5 === 0 ? this.allData.length / 5 : this.allData.length / 5 + 1
      this.updateChart()
      // 启动定时器
      this.startInterval()
    },
    // 更新图表
    updateChart () {
      const start = (this.currentPage - 1) * 5
      const end = this.currentPage * 5
      const showData = this.allData.slice(start, end)
      const sellerNames = showData.map((item) => {
        return item.name
      })
      const sellerValues = showData.map((item) => {
        return item.value
      })
      const dataOption = {
        yAxis: {
          data: sellerNames
        },
        series: [
          {
            data: sellerValues
          }
        ]
      }
      this.chartInstance.setOption(dataOption)
    },
    startInterval () {
      if (this.timerId) {
        clearInterval(this.timerId)
      }
      this.timerId = setInterval(() => {
        this.currentPage++
        if (this.currentPage > this.totalPage) {
          this.currentPage = 1
        }
        this.updateChart()
      }, 3000)
    },
    // 当浏览器的大小发生变化的时候, 会调用的方法, 来完成屏幕的适配
    screenAdapter () {
      // console.log(this.$refs.seller_ref.offsetWidth)
      const titleFontSize = this.$refs.seller_ref.offsetWidth / 100 * 3.6
      // 和分辨率大小相关的配置项
      const adapterOption = {
        title: {
          textStyle: {
            fontSize: titleFontSize
          }
        },
        tooltip: {
          axisPointer: {
            lineStyle: {
              width: titleFontSize
            }
          }
        },
        series: [
          {
            barWidth: titleFontSize,
            itemStyle: {
              barBorderRadius: [0, titleFontSize / 2, titleFontSize / 2, 0]
            }
          }
        ]
      }
      this.chartInstance.setOption(adapterOption)
      // 手动的调用图表对象的resize 才能产生效果
      this.chartInstance.resize()
    }
  }
}
</script>

<style lang="less" scoped>
</style>


 3961
3961


 被折叠的 条评论
为什么被折叠?
被折叠的 条评论
为什么被折叠?
 到【灌水乐园】发言


