


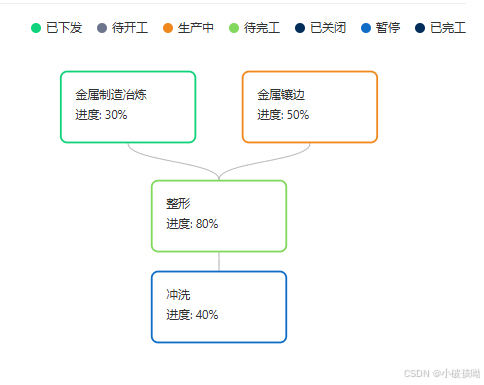
效果图:
最近项目开发时有一个流程图的功能,需要做流程节点的展示,就搜到了 Vue Flow 这个插件,这个插件总得来说还可以,简单已使用,下边就总结一下使用的方法:
Vue Flow官网:https://vueflow.dev/
1、安装插件:
npm i --save @vue-flow/core2、页面引入使用:
<template>
  <div style="width: 100%; height: 300px;">
     <VueFlow :nodes="nodes" :edges="edges" @node-click="onNodeClick" fit-view-on-init>
         <!-- 自定义节点插槽 -->
         <template #node-custom="nodeProps">
             <div>{{ nodeProps.data.label }}</div>
             <div style="margin-top: 5px;">进度: {{ nodeProps.data.value }}%</div>
         </template>
     </VueFlow>
  </div>
</template>
<script>
import { VueFlow } from '@vue-flow/core'
export default {
    components: {
        VueFlow
    },
    data () {
        return{
            // 节点数据
            nodes: [
                // 默认节点,可以省略`type:'Default'`
                { id: '1', type: 'custom', data: { label: '金属制造冶炼', value: 30 }, position: { x: 300, y: 30 },
                    style: {
                        width: '150px',height: '80px',padding: '15px', fontSize: '13px',
                        border: '2px solid #10D27A', borderRadius: '8px'
                    },
                },
                { id: '2',type: 'custom', data: { label: '金属镶边',value: 50 }, position: { x: 500, y: 30 },
                    style: {
                        width: '150px',height: '80px',padding: '15px', fontSize: '13px',
                        border: '2px solid #F1881C', borderRadius: '8px'
                    },
                },
                { id: '3',type: 'custom', data: { label: '整形', value: 80 }, position: { x: 400, y: 150 },
                    style: {
                        width: '150px',height: '80px',padding: '15px', fontSize: '13px',
                        border: '2px solid #81D85D', borderRadius: '8px'
                    },
                },
                { id: '4',type: 'custom', data: { label: '冲洗', value: 40 }, position: { x: 400, y: 250 },
                    style: {
                        width: '150px',height: '80px',padding: '15px', fontSize: '13px',
                        border: '2px solid #0F6DC6', borderRadius: '8px'
                    },
                },
            ],
            // 节点连线(就是哪个节点到那个节点)
            edges: [
                { id: 'e1-1', source: '1', target: '3'},
                { id: 'e1-2', source: '2', target: '3' },
                { id: 'e1-3', source: '3', target: '4' },
            ],
        }
    },
    created() {

    },
    mounted() {

    },
    methods: {
        // 节点点击事件
        onNodeClick(node) {
            console.log('Node clicked:', node);
        },
    }
}

</script>
<style>
    /* 这些是vue-flow的必备样式 */
    @import "@vue-flow/core/dist/style.css";
    /* 这包含默认主题,这些是可选样式 */
    @import "@vue-flow/core/dist/theme-default.css";
</style>
解析:
- nodes里边的data数据可以自定义配置,但需要设置 type: 'custom',
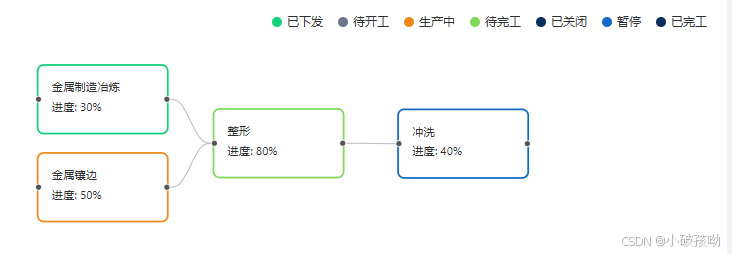
附加1:上图是从左到右展示的,如果需要修改方向,方法如下:
<div style="width: 100%; height: 200px;">
    <VueFlow :nodes="newNodes" :edges="newEdges" @node-click="onNodeClick" fit-view-on-init>
        <!-- 自定义节点插槽 -->
        <template #node-custom="nodeProps">
             <!-- 开始节点的位置 -->
             <Handle type="source" position="right" />
             <div>{{ nodeProps.data.label }}</div>
             <div style="margin-top: 5px;">进度: {{ nodeProps.data.value }}%</div>
             <!-- 结束节点的位置 -->
             <Handle type="target" position="left" :connectable="false" />
        </template>
    </VueFlow>
</div>
附加2:假如展示流程图的时候不知道节点坐标,而后端又没有给,那么这个时候就需要自己去动态生成,方法如下:
// 以下用的模拟数据还是用最上边的模拟数据,只是需要删除节点中的坐标,改成使用以下方法动态生产
mounted() {
  this.calculateNodePositions();
  this.newNodes = this.nodes;
  this.newEdges = this.edges;
},
methods: {
        // 计算节点的坐标
        calculateNodePositions() {
            const positionMap = {}; // 用于存储每个节点的位置
            const processedNodes = new Set(); // 用于标记已经计算过位置的节点
            let yPosition = 100; // 初始的 Y 坐标设置
            // 遍历 edges 数组中的每个边来设置起始节点的位置
            this.edges.forEach(edge => {
                // 获取源节点和目标节点的数据
                const sourceNode = this.nodes.find(node => node.id === edge.source);
                const targetNode = this.nodes.find(node => node.id === edge.target);
                // 1. 给源节点分配位置
                if (!processedNodes.has(edge.source)) {
                    positionMap[edge.source] = { x: 100, y: yPosition };  // 初始位置
                    yPosition += 100;  // 增加 y 值,避免节点重叠
                    processedNodes.add(edge.source);
                }
                // 2. 根据源节点的位置来计算目标节点的位置
                const sourcePosition = positionMap[edge.source];
                if (sourcePosition && !processedNodes.has(edge.target)) {
                    // 给目标节点分配位置
                    positionMap[edge.target] = {
                        x: sourcePosition.x + 200,  // 横向偏移
                        y: sourcePosition.y + 50   // 纵向偏移
                    };
                    processedNodes.add(edge.target);
                }
            });
            // 更新节点位置
            this.nodes.forEach(node => {
                if (positionMap[node.id]) {
                    node.position = positionMap[node.id];
                }
            });
        },
}
3、更多配置项:
3.1、节点点击事件
<!--绑定-->
<VueFlow :nodes="nodes" :edges="edges" @node-click="onNodeClick" />

// 方法
onNodeClick(node) {
  console.log('Node clicked:', node);
},
3.2、节点拖拽事件
<!--绑定-->
<VueFlow :nodes="nodes" :edges="edges" @node-drag="onNodeDrag" />

// 方法
onNodeDrag({ node, position }) {
  console.log('Node dragged:', node.id, 'New position:', position);
},
3.3、连接边事件
<!--绑定-->
<VueFlow :nodes="nodes" :edges="edges" @connect="onConnect" />

// 方法
onConnect(edge) {
  console.log('Edge connected:', edge);
},
3.4、节点双击事件
<!--绑定-->
<VueFlow :nodes="nodes" :edges="edges" @node-dblclick="onNodeDoubleClick" />

// 方法
onNodeDoubleClick(node) {
  console.log('Node double clicked:', node);
},
3.5、画布缩放和拖动事件
<!--绑定-->
<VueFlow :nodes="nodes" :edges="edges" @zoom-change="onZoomChange" @canvas-click="onCanvasClick" />

// 方法
onZoomChange(event) {
  console.log('Zoom changed:', event);
},
onCanvasClick(event) {
  console.log('Canvas clicked:', event);
},
4、常用节点连接线样式示例
4.1、普通直线
const edges = [
  { id: 'e1-1', source: '1', target: '2', style: { stroke: '#10D27A', strokeWidth: 2 } },
];
4.2、虚线
const edges = [
  { id: 'e1-1', source: '1', target: '2', style: { stroke: '#F1881C', strokeWidth: 2, strokeDasharray: '5,5' } },
];
4.3、带箭头
const edges = [
  { id: 'e1-1', source: '1', target: '2',
    style: { stroke: '#4682b4', strokeWidth: 2, markerEnd: 'url(#arrow)', },
  },
];
4.4、带圆角
const edges = [
  { id: 'e1-1', source: '1', target: '2', style: { stroke: '#FF6347', strokeWidth: 4, strokeLinecap: 'round' } },
];
4.5、自定义边颜色和宽度
const edges = [
  { id: 'e1-1', source: '1', target: '2', style: { stroke: '#000', strokeWidth: 6 } },
  { id: 'e1-2', source: '2', target: '3', style: { stroke: '#FF0000', strokeWidth: 3 } },
];
4.6、带动效的连接线
const edges = [
  { id: 'e1-1', source: '1', target: '2, animated: true,},
];
至此完成!!!
测试有效!!!感谢支持!!!


 399
399

 被折叠的 条评论
为什么被折叠?
被折叠的 条评论
为什么被折叠?
 到【灌水乐园】发言


