


文章目录

⭐前言
大家好,我是yma16,本文分享selenuim联合echarts——可视化分析csdn新星赛道选手城市和参赛信息的有效性。
该系列文章:
python爬虫_基本数据类型
python爬虫_函数的使用
python爬虫_requests的使用
python爬虫_selenuim可视化质量分
python爬虫_django+vue3可视化csdn用户质量分
python爬虫_正则表达式获取天气预报并用echarts折线图显示
python爬虫_requests获取bilibili锻刀村系列的字幕并用分词划分可视化词云图展示
python爬虫_selenuim登录个人markdown博客站点
python爬虫_requests获取小黄人表情保存到文件夹
python_selenuim获取csdn新星赛道选手所在城市用echarts地图显示
⭐selenuim打开赛道报名界面获取新星赛道选手主页
目标网址仍然是个人新开赛道的报名页:https://bbs.csdn.net/topics/616574177
直奔主题:思路分析+实现
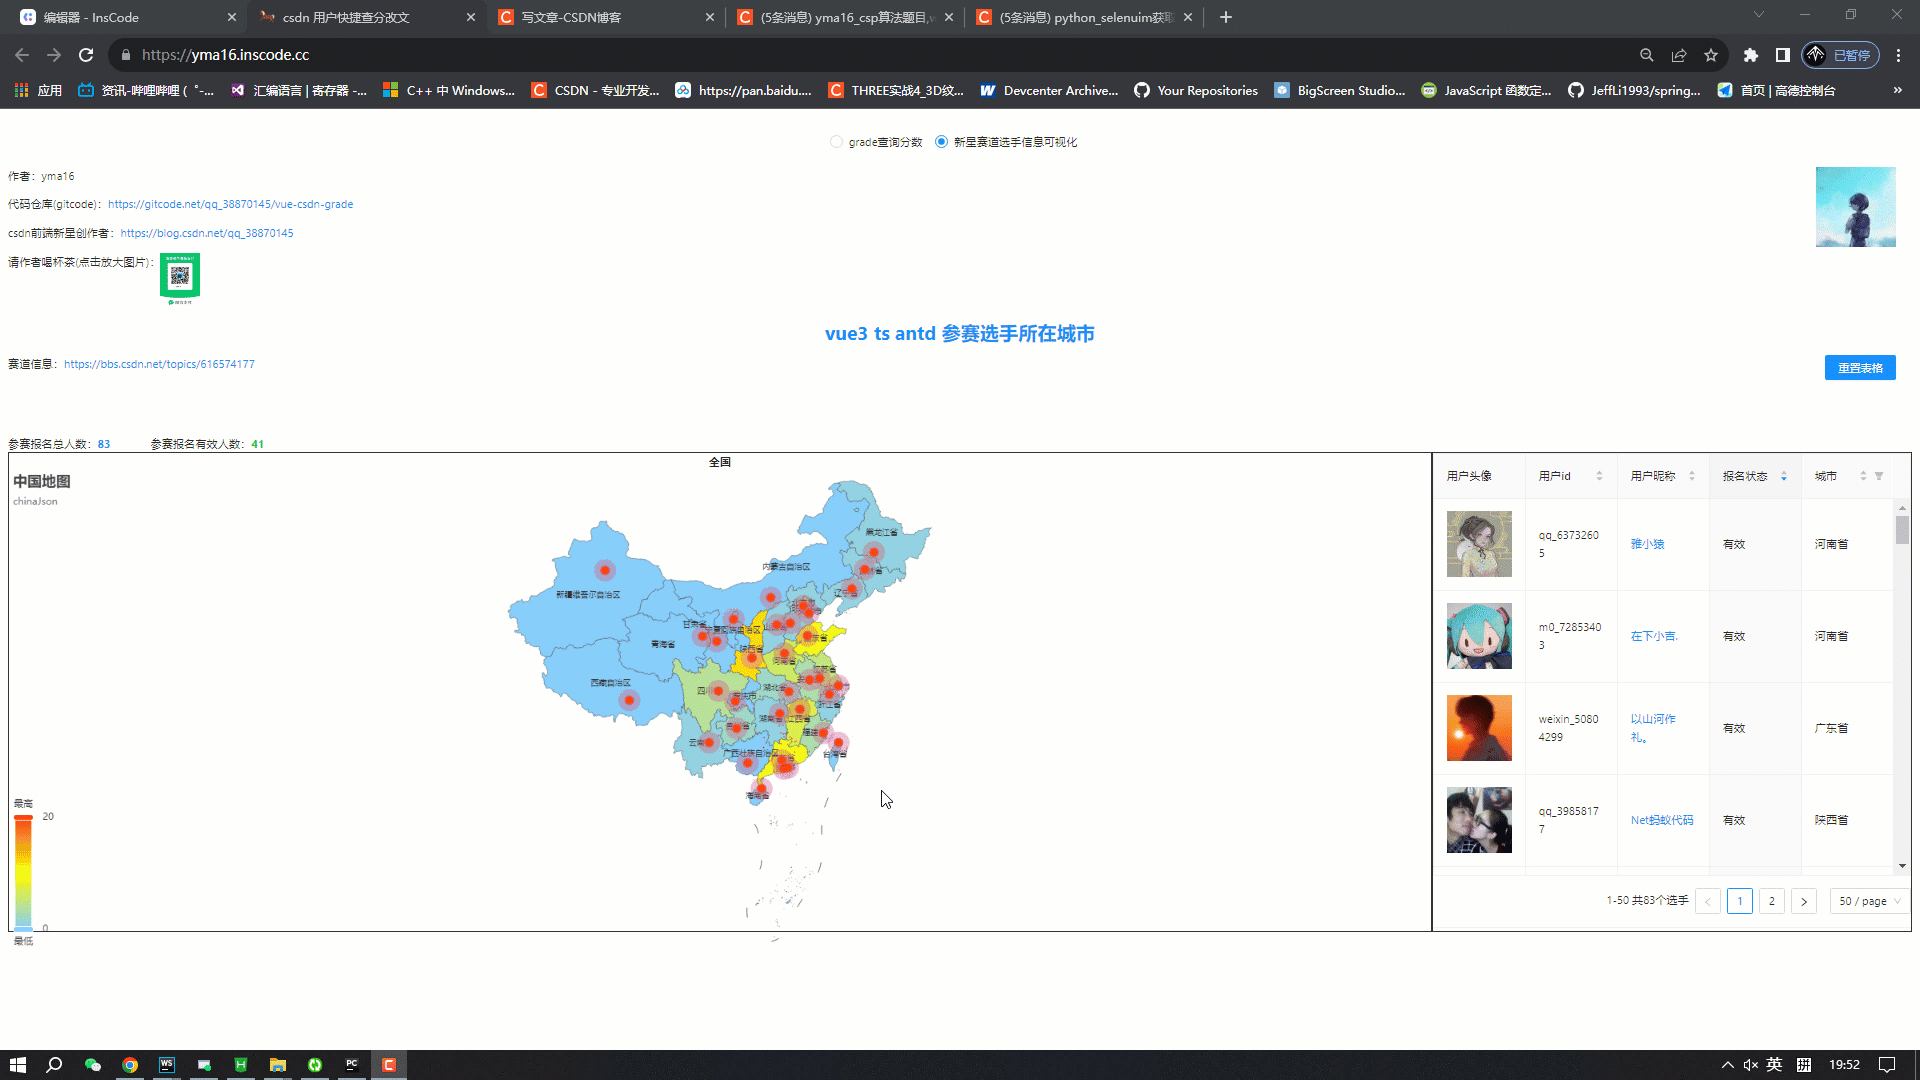
实现效果:https://yma16.inscode.cc/
💖 获取参赛选手主页思路分析
基本逻辑:
- 获取表格行的元素
- 获取行行内的用户id和提交内容
- 获取完之后点击下一页按钮
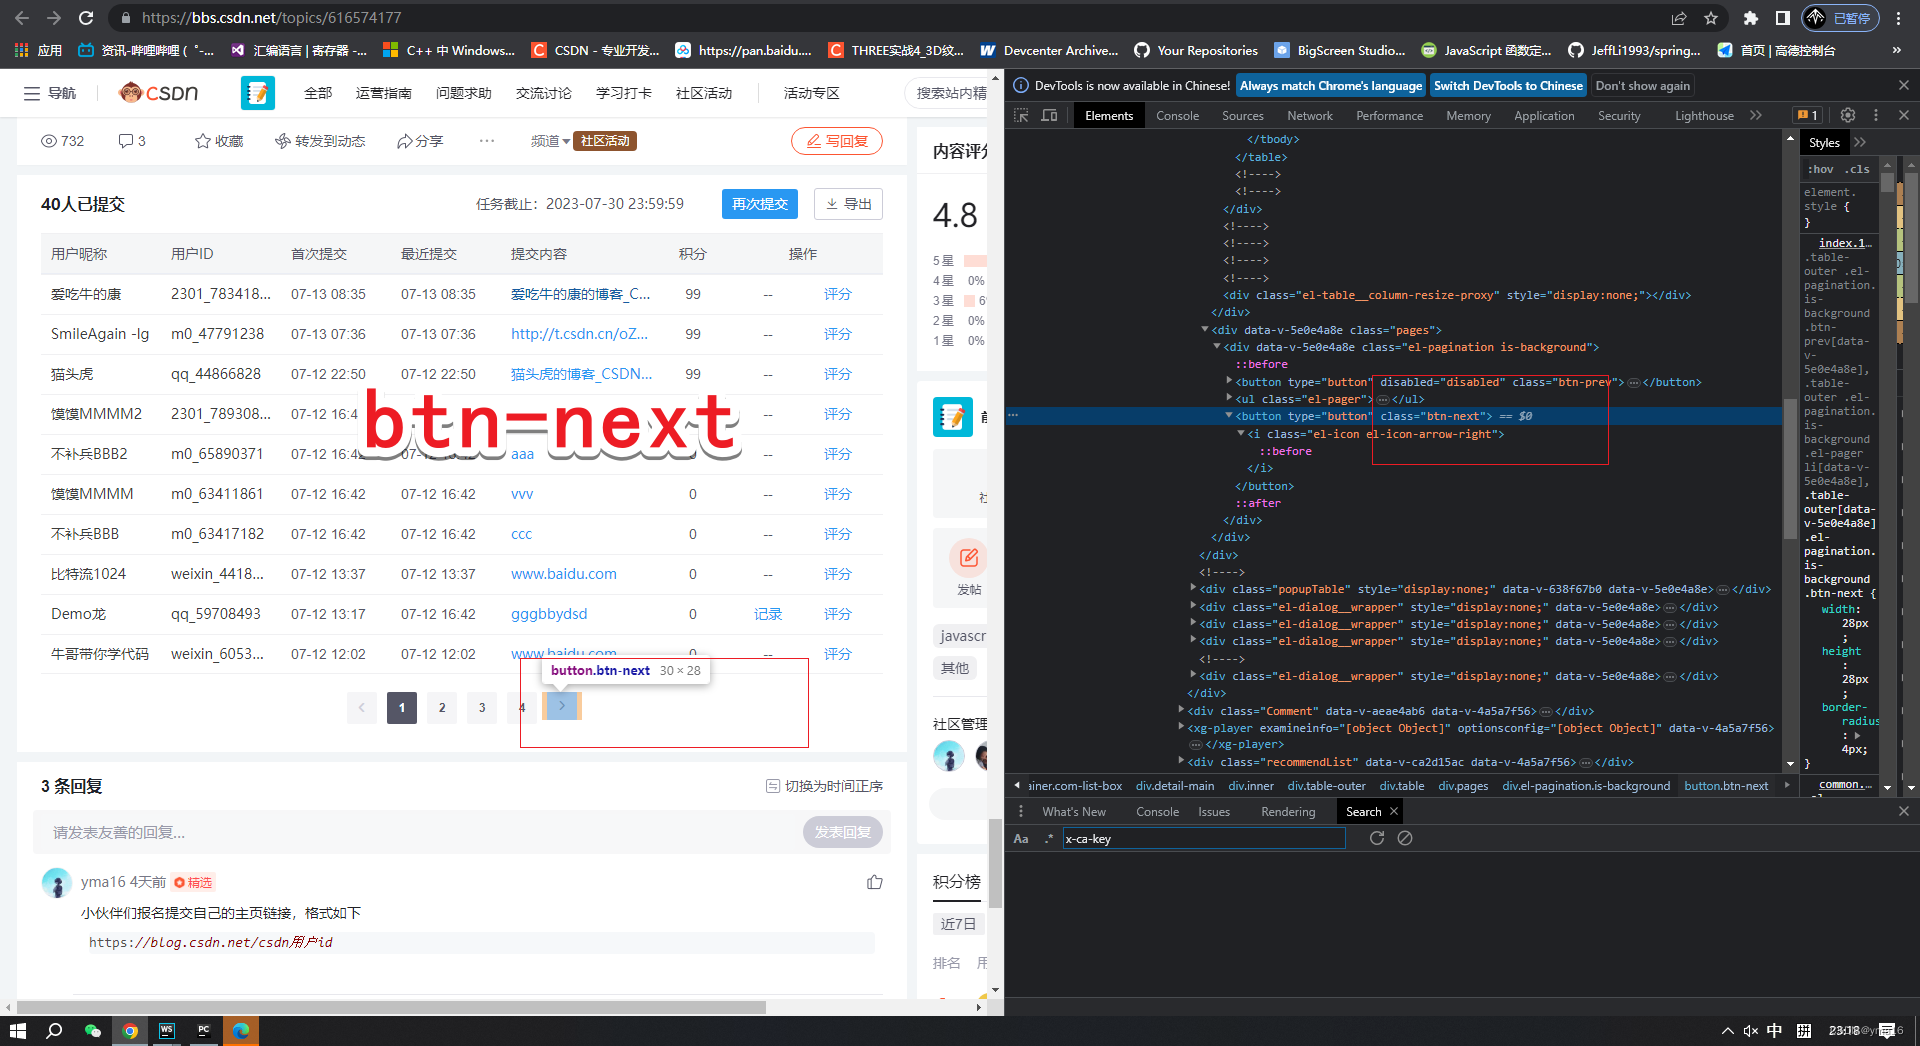
实现:根据className获取父级元素(表格单行),单行元素分别提取用户id和用户提交记录
表格行
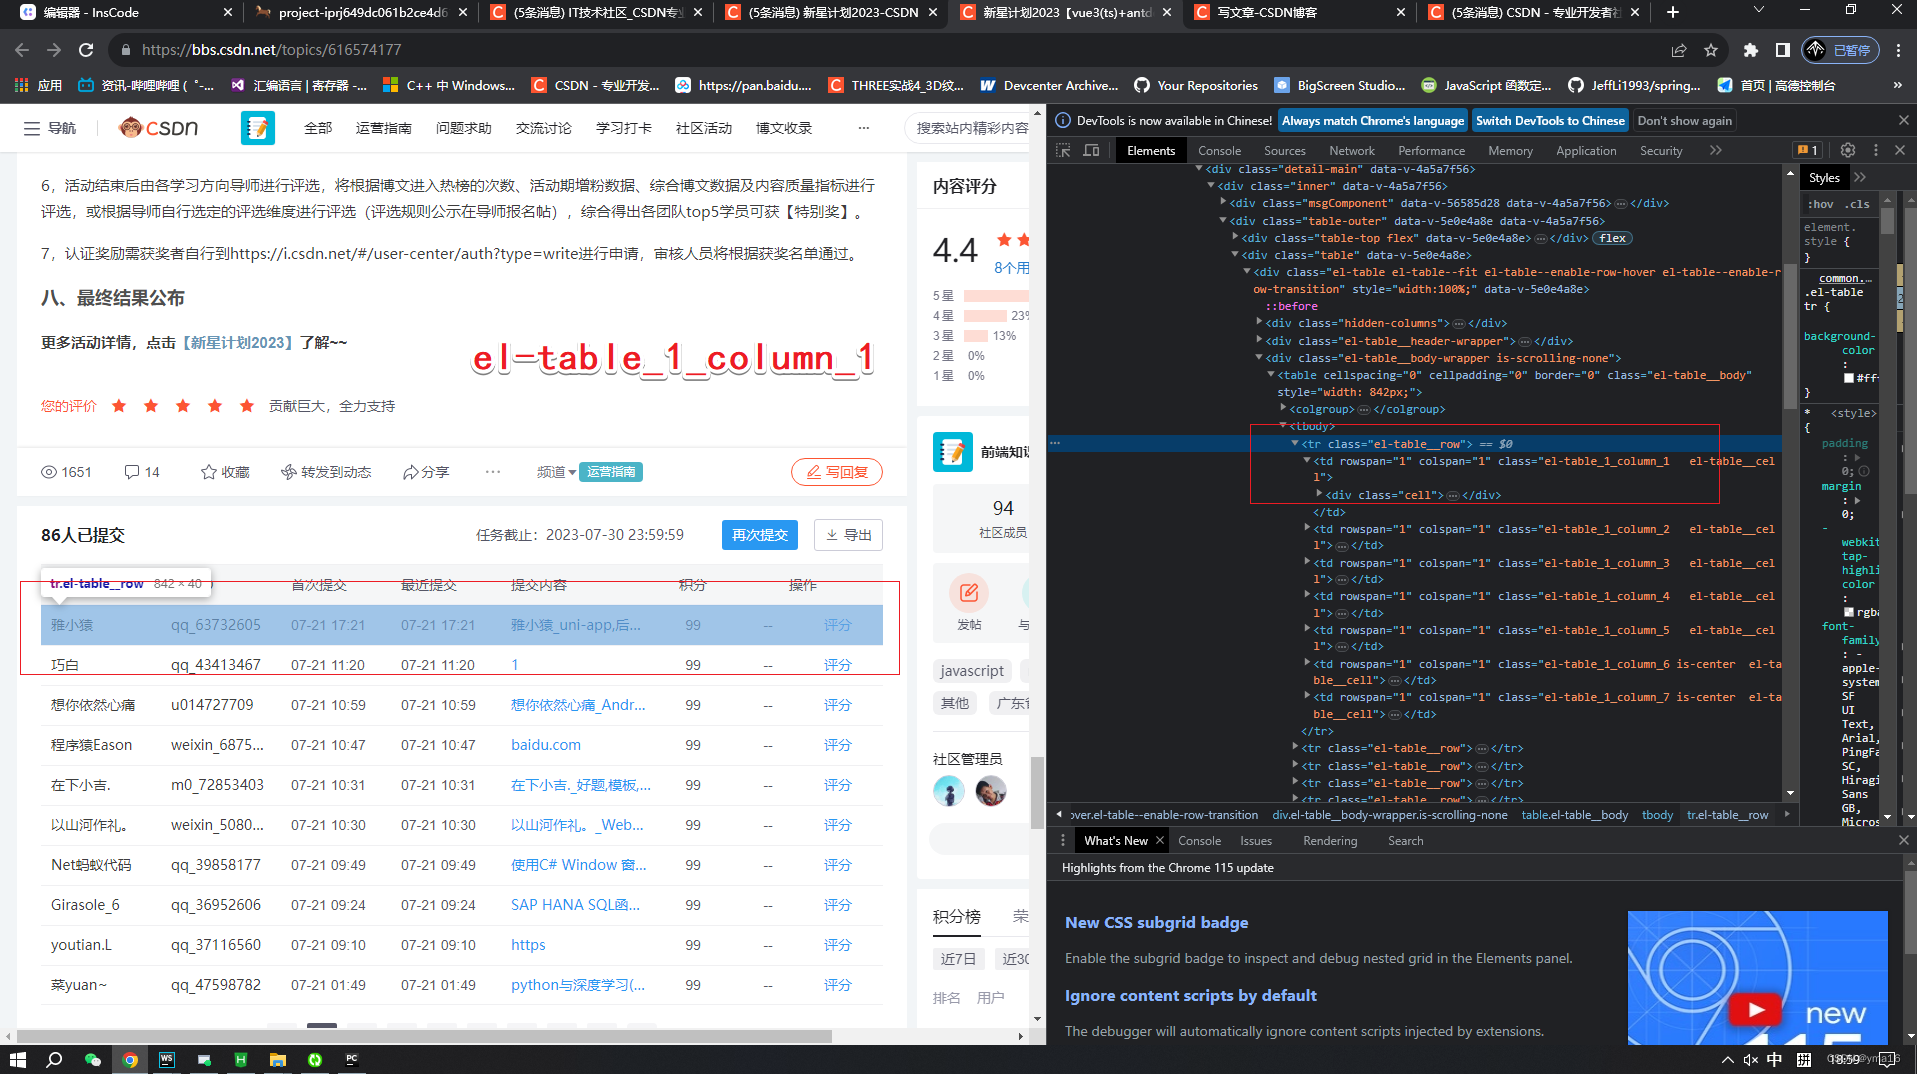
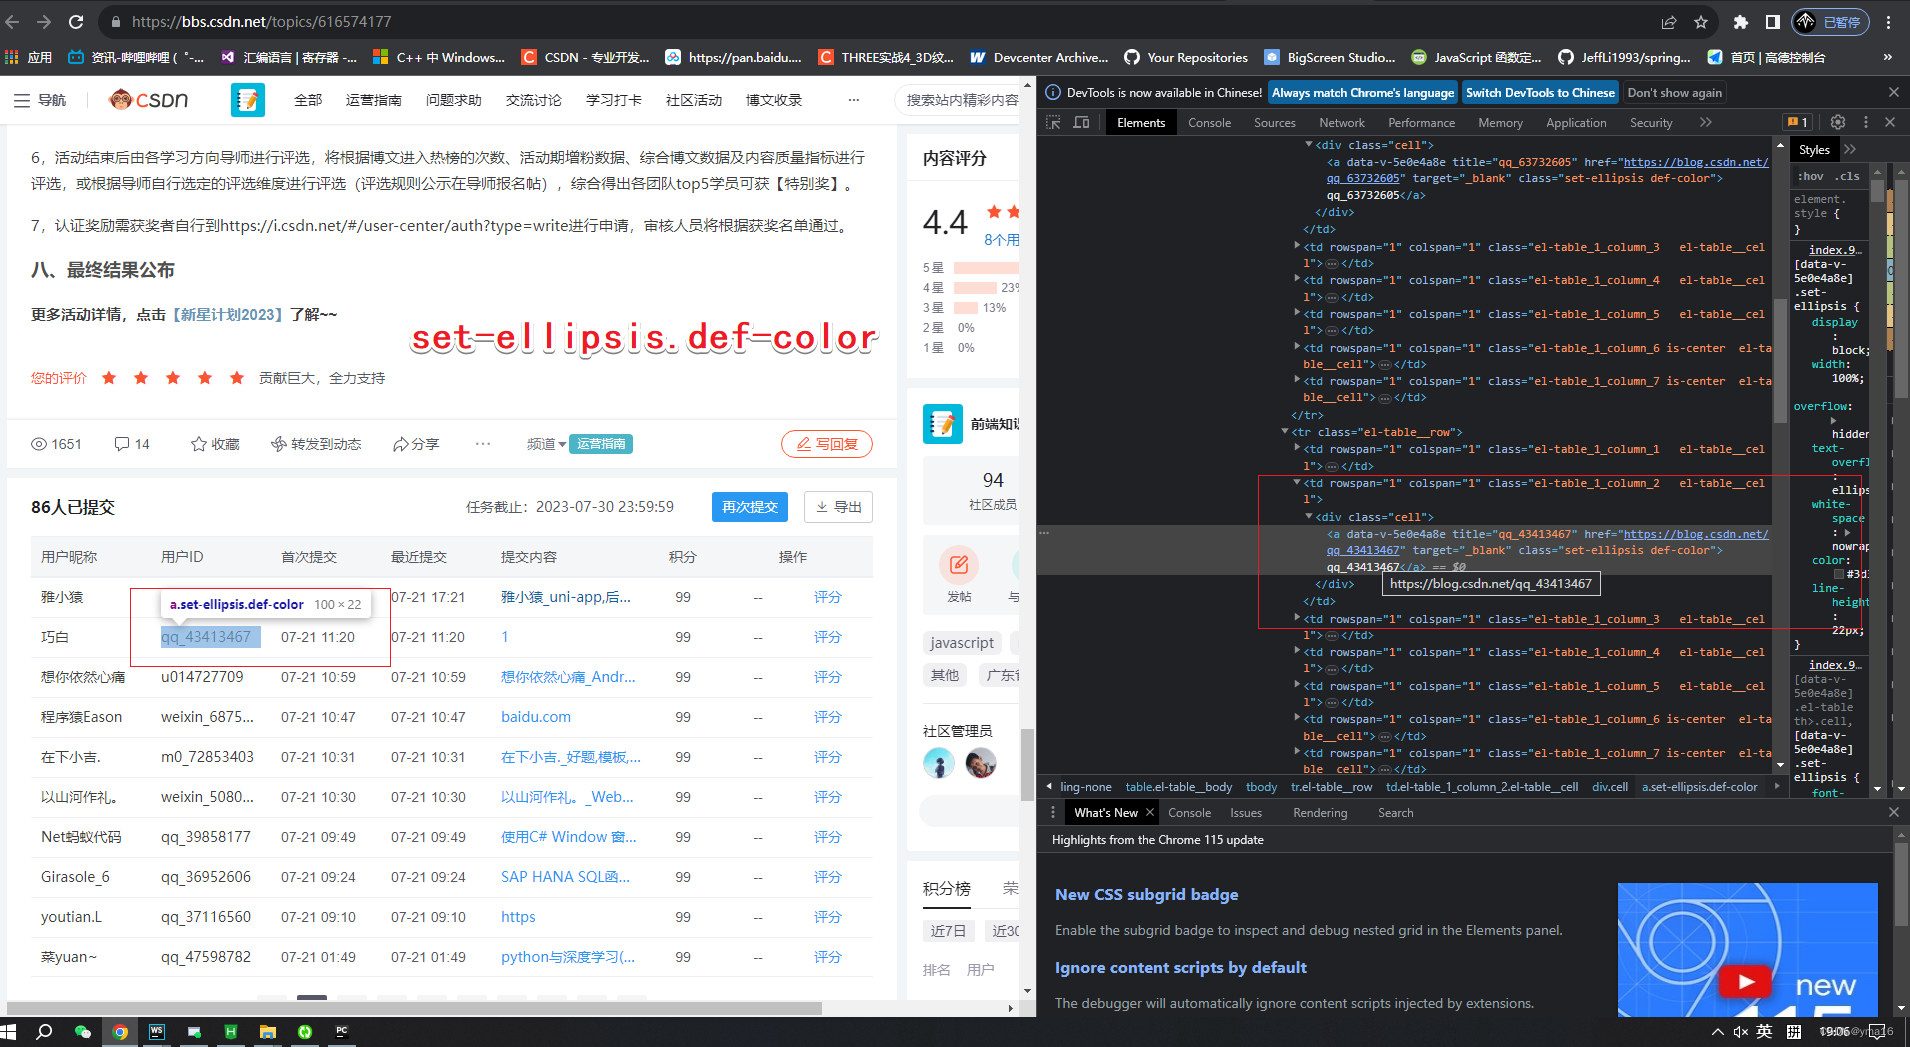
用户id元素class
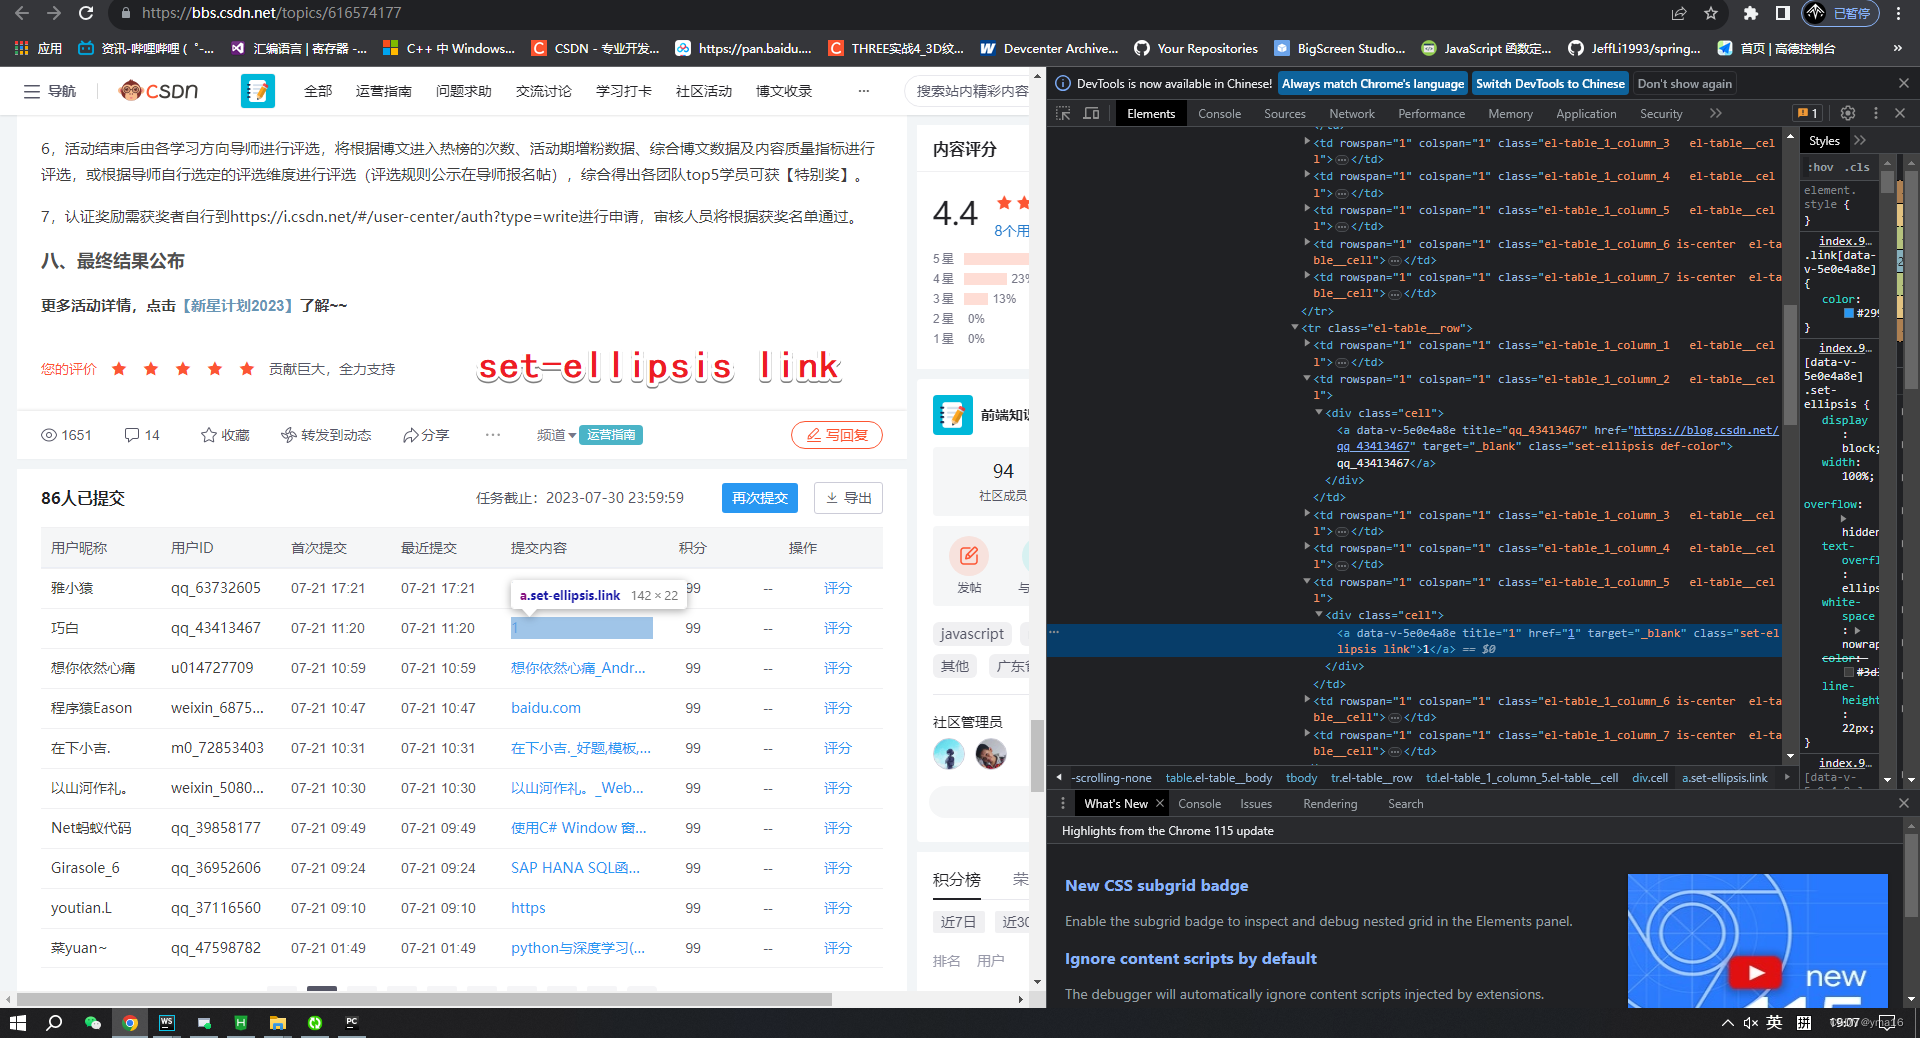
用户提交记录class
下一个按钮class
💖 selenuim获取参数选手代码块
from selenium import webdriver
import time,json,re


dir_path='C:\\Users\MY\PycharmProjects\Spider_python\study2021\day07\dirver\msedgedriver.exe'
driver=webdriver.Edge(executable_path=dir_path)
url='https://bbs.csdn.net/topics/616574177'
driver.get(url)
now_url=driver.current_url
userUrlObj={}
userUidArray=[]
# get uid
def getUid():
    # 表格行数据
    cells=driver.find_elements_by_xpath('//tr[@class="el-table__row"]')
    for i in cells:
        uid=''
        aDom=i.find_elements_by_tag_name('a')
        realUrl=''
        postUrl=''
        for aItem in aDom:
            print(aItem.text)
            print(aItem.get_attribute('class'))
            aItemClassName=aItem.get_attribute('class')
            # 用户id
            if aItemClassName == 'set-ellipsis def-color':
                realUrl=aItem.get_attribute('href')
                uid=aItem.text
            # 用户提交
            elif aItemClassName == 'set-ellipsis link':
                postUrl=aItem.get_attribute('href')
        userItem={
            'uid':uid,
            'realUrl':realUrl,
            'postUrl':postUrl,
        }
        userUidArray.append(userItem)
        userUrlObj[uid]=userItem
        print(userUrlObj[uid],len(userUidArray))
    time.sleep(5)

# next
def nextBtn():
    try:
        nextBtnDom=driver.find_element_by_xpath('//button[@class="btn-next"]')
        print(nextBtnDom,nextBtnDom.text)
        disabled=nextBtnDom.get_attribute('disabled')
        print(disabled,'disabled')
        print(type(disabled),'disabled')
        print('str(disabled)',str(disabled))
        if nextBtnDom and str(disabled)!='true':
            nextBtnDom.click()
            return True
        return False
    except Exception as e:
        print(e)
        return False

def work():
    time.sleep(2)
    getUid()
    nextFlag=nextBtn()
    # return
    if nextFlag is True:
        time.sleep(1)
        return work()
    else:
        # end
        return writeJson()

def writeJson():
    with open("./joinUserProfile.json", 'w', encoding='utf-8') as write_f:
        write_f.write(json.dumps(userUrlObj, indent=4, ensure_ascii=False))
if __name__=='__main__':
    work()
    driver.close()
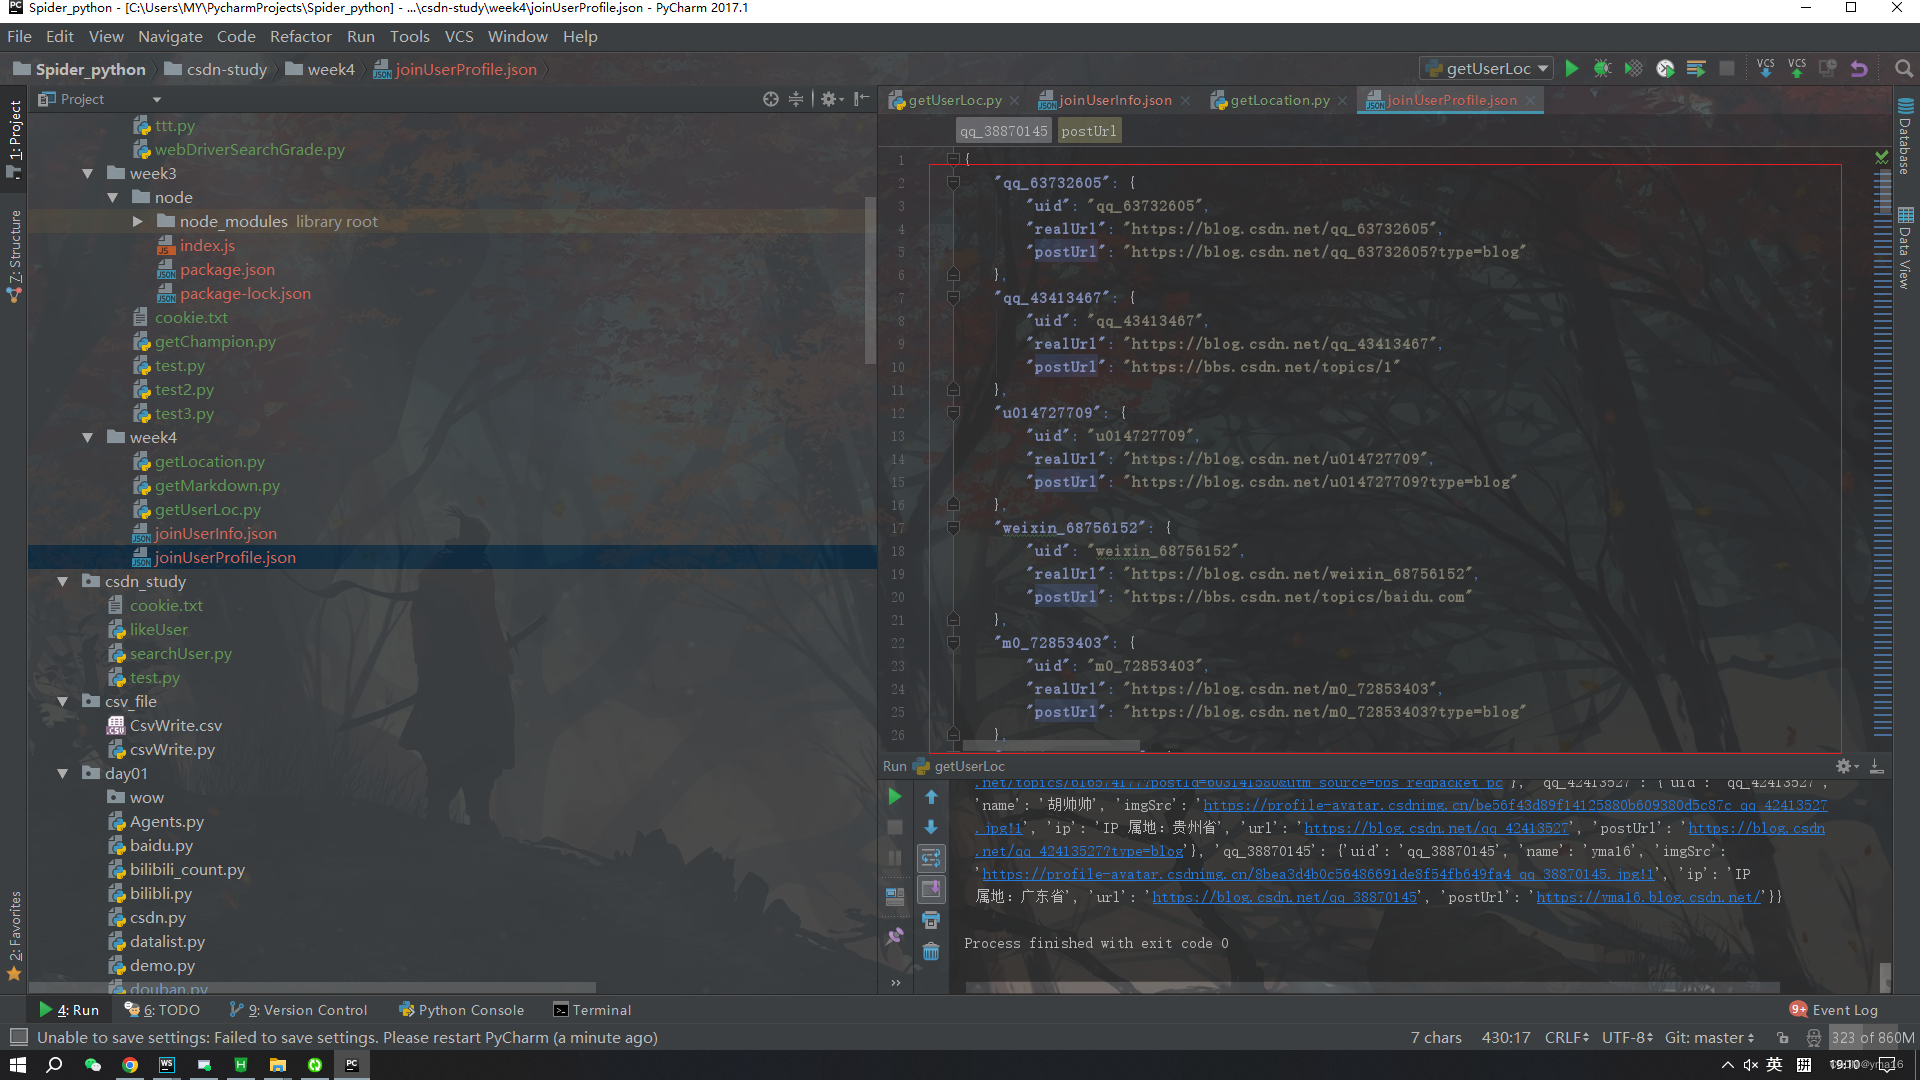
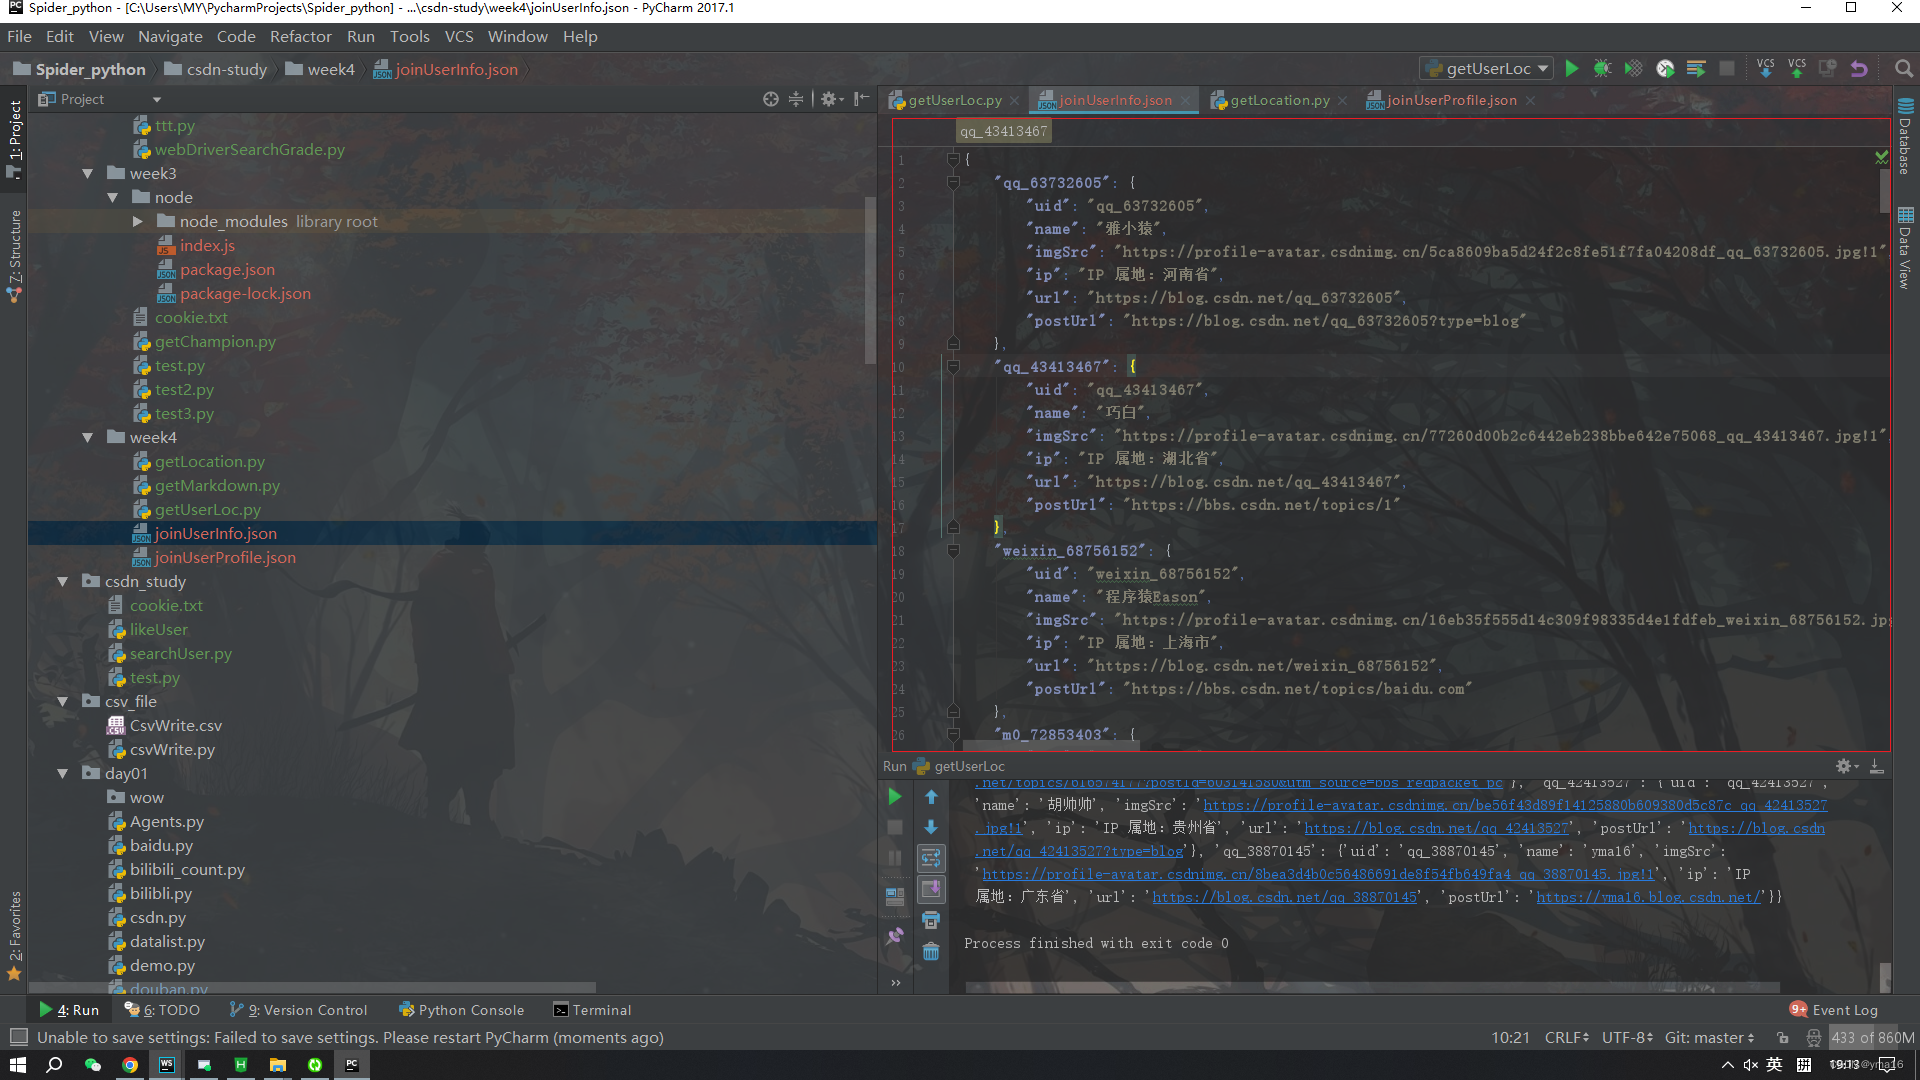
获取用户JSON结果:
💖 selenuim获取参数选手主页城市
实现逻辑分析:
- 主页ip属地获取:通过类名
- 用户头像:className
- 用户昵称:className
个人主页html渲染图如下:
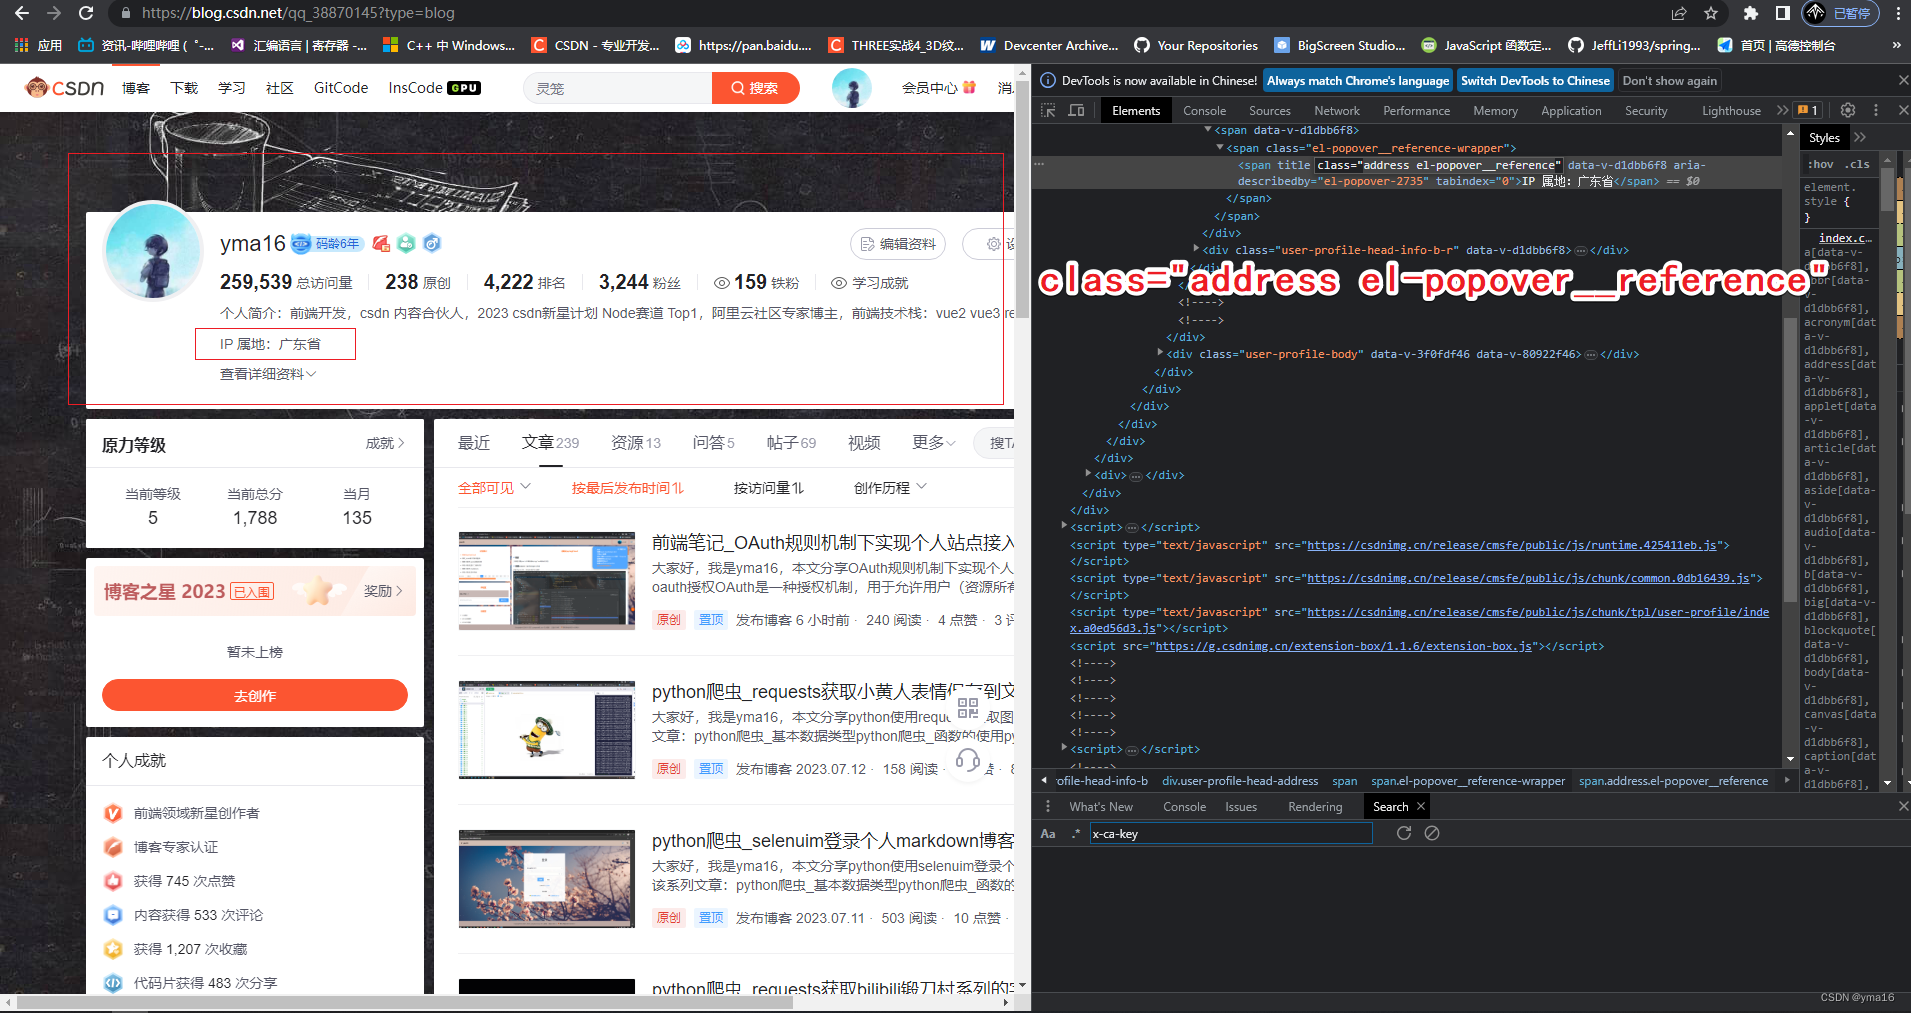
用户头像html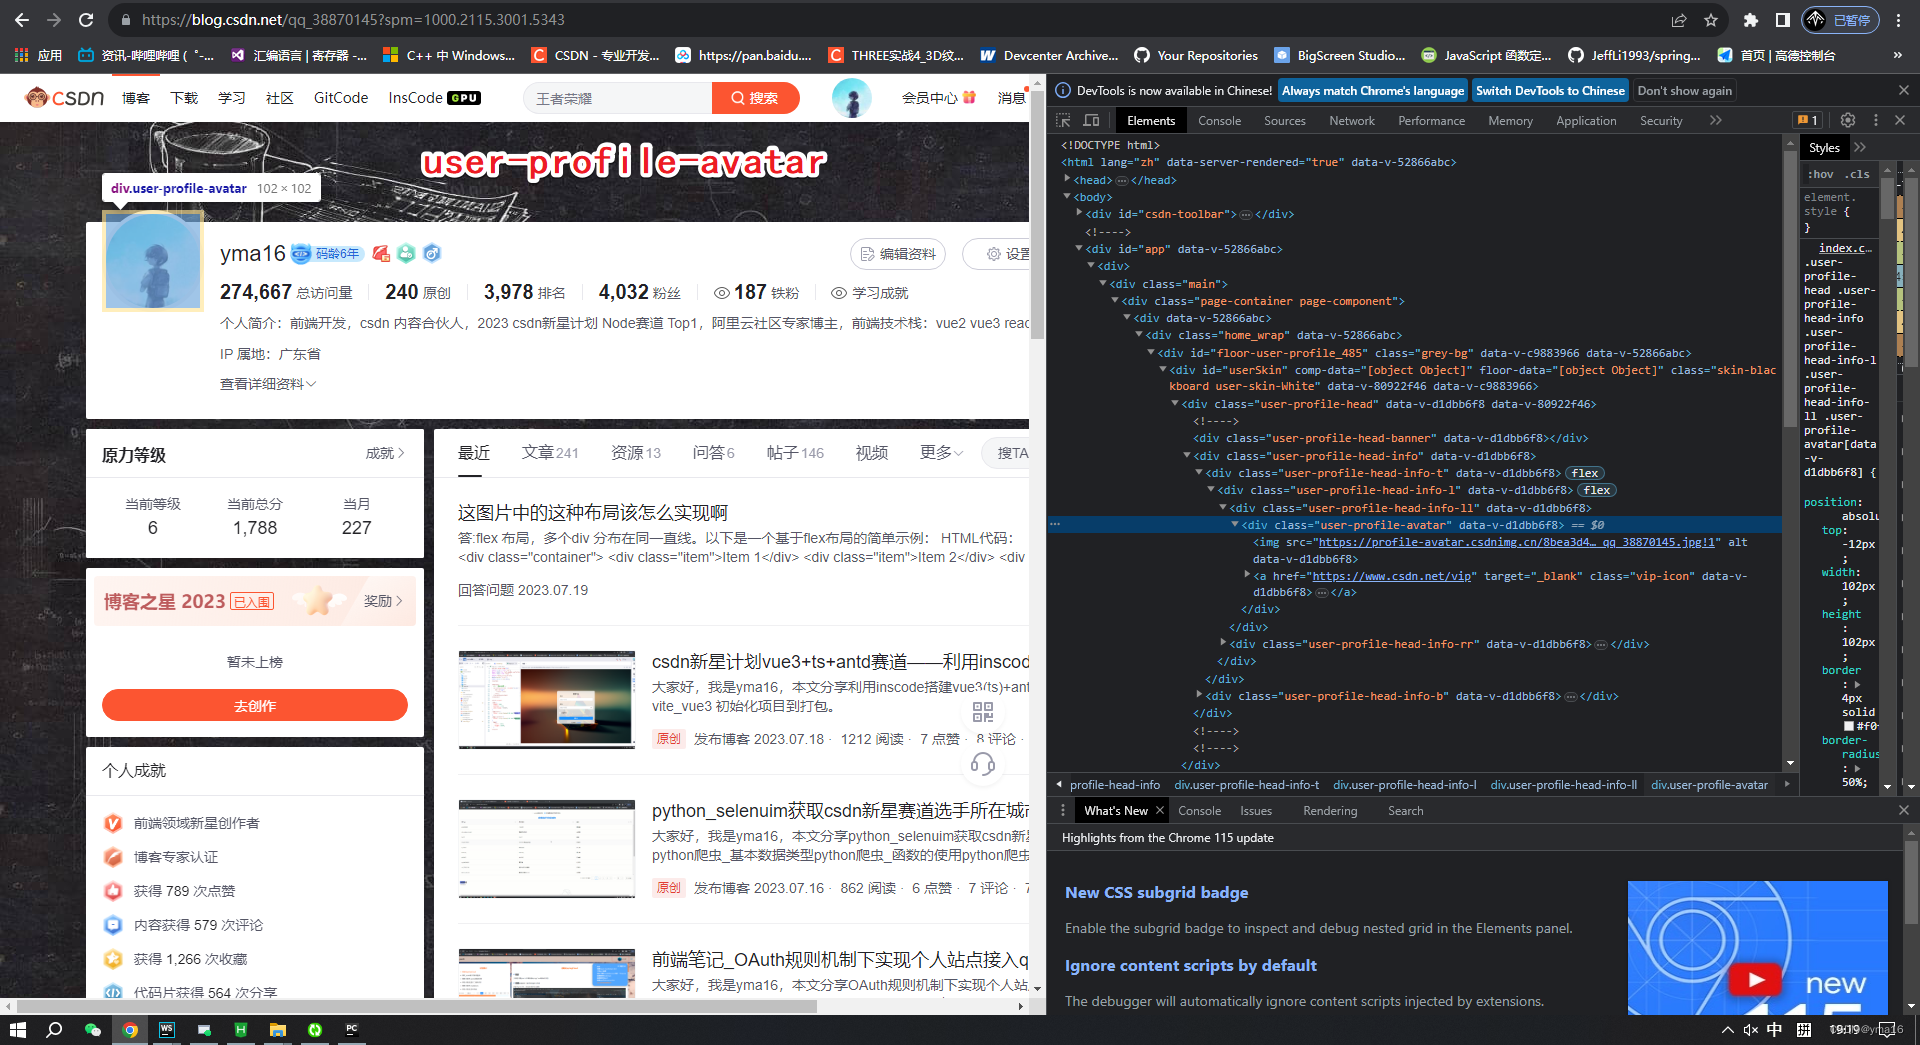
python代码块实现数据扫描:
from selenium import webdriver
import time,json
dir_path='C:\\Users\MY\PycharmProjects\Spider_python\study2021\day07\dirver\msedgedriver.exe'
driver=webdriver.Edge(executable_path=dir_path)
f = open('joinUserProfile.json', 'r')
content = f.read()
f.close()
joinJson = json.loads(content)
userIpInfo={}
userIpInfoArray=[]
def getUserInfo():
    for key in joinJson.keys():
        print(key,'userIpInfo')
        requestUserInfo(key,joinJson[key]['realUrl'])

    writeJson()
# open url
def requestUserInfo(key,url):
    time.sleep(3)
    try:
        userIpInfoItem = {}
        driver.get(url)
        imgDom = driver.find_element_by_xpath('//div[@class="user-profile-avatar"]')
        imgSrc = imgDom.find_element_by_tag_name('img').get_attribute('src')
        nameDom = driver.find_element_by_xpath('//div[@class="user-profile-head-name"]')
        # first
        nickName = nameDom.find_element_by_tag_name('div').text
        ip = driver.find_element_by_xpath('//span[@class="address el-popover__reference"]').text
        userIpInfoItem['uid'] = key
        userIpInfoItem['name'] = nickName
        userIpInfoItem['imgSrc'] = imgSrc
        userIpInfoItem['ip'] = ip
        userIpInfoItem['url'] = url
        userIpInfoItem['postUrl'] = joinJson[key]['postUrl']
        userIpInfo[key] = userIpInfoItem
        userIpInfoArray.append(userIpInfoItem)
    except Exception as e:
        print(e)
    print(userIpInfo,len(userIpInfoItem))
def writeJson():
    with open("./joinUserInfo.json", 'w', encoding='utf-8') as write_f:
        write_f.write(json.dumps(userIpInfo, indent=4, ensure_ascii=False))
if __name__=='__main__':
    getUserInfo()
    driver.close()
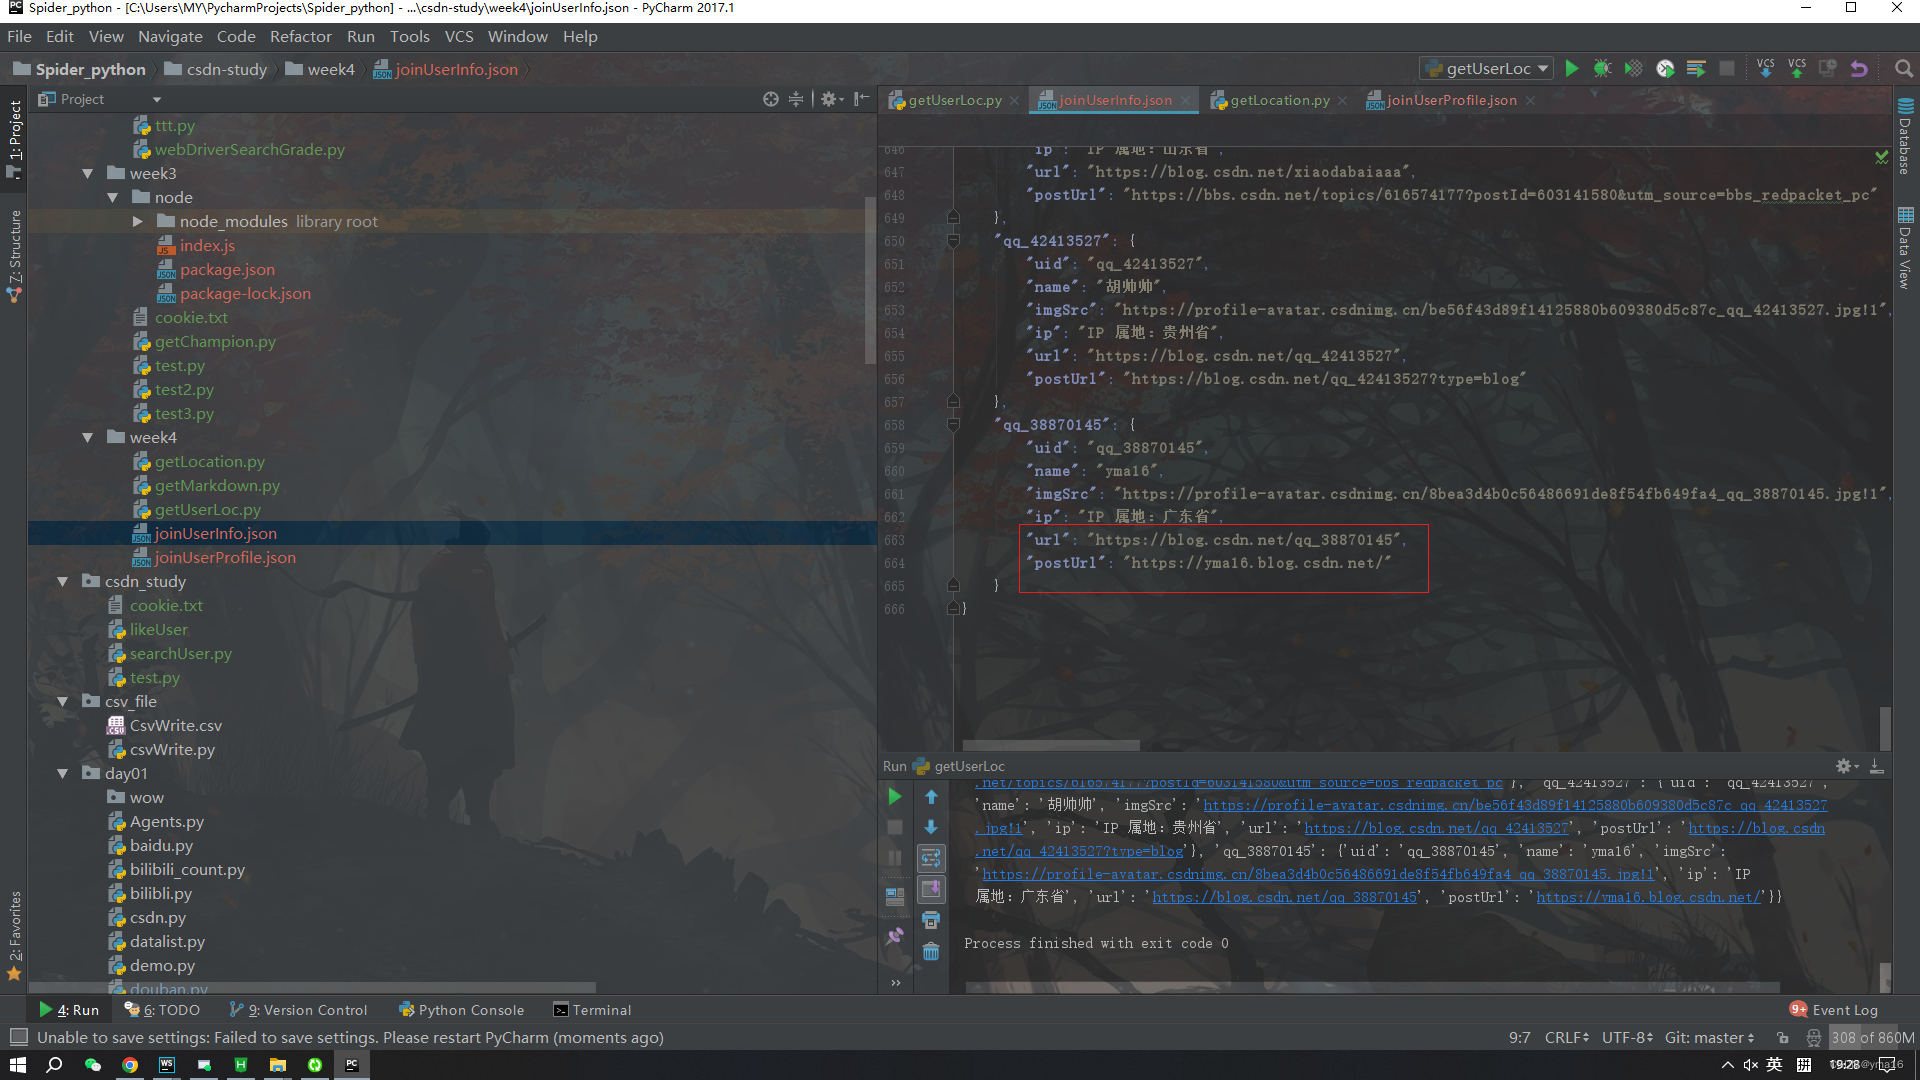
获取结果:
💖echarts分析选手参数信息
断言参赛信息的有效性:
判断逻辑:
- 提交url记录和个人主页对比,不包含个人主页前缀则参赛选手提交无效。
gameJson 为 扫描获取的用户参数数据
const isTruth=gameJson[uid].postUrl.includes(gameJson[uid].url)
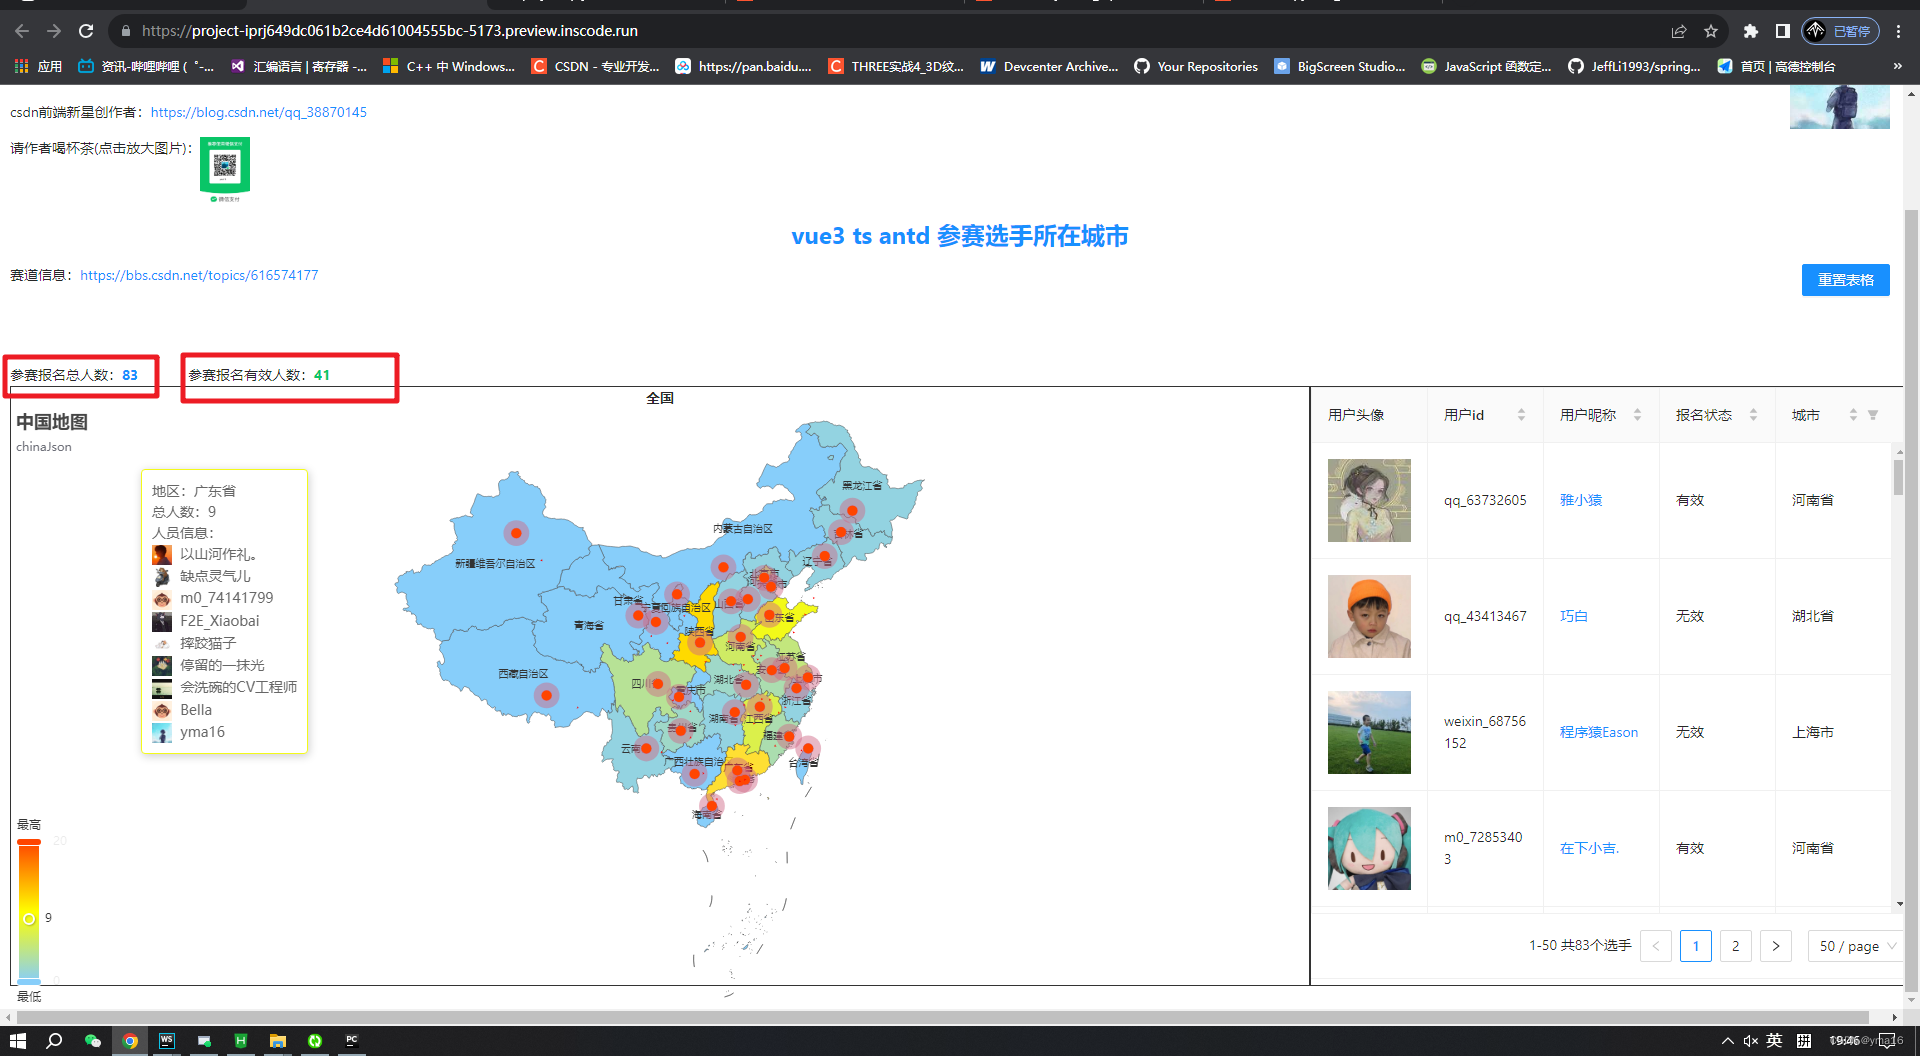
vue3+echarts显示:
<template>
<div>
<div style="text-align: center;">
<a style="font-size: 24px;font-weight:bolder;">{{ state.title }}</a>
</div>
</div>
<Author />
<div style="display: flex;height: 100px;margin:10px 0 0 0">
<div style="width: 600px;">
赛道信息:<a href="https://bbs.csdn.net/topics/616574177" target="_blank">https://bbs.csdn.net/topics/616574177</a>
</div>
<div style="width: 100%;text-align: right;margin-right: 20px;">
<a-button @click="initDataSource" type="primary">
重置表格
</a-button>
</div>
</div>
<div style="margin:0 auto;display: flex;">
<div>
参赛报名总人数:<span style="font-weight: bold;color:rgba(24, 144, 255)">{{ state.totlaNum }}</span>
</div>
<div style="width: 50px;">
</div>
<div>
参赛报名有效人数:<span style="font-weight: bold;color:rgba(9, 197, 103)">{{ state.totalRealNum }}</span>
</div>
</div>
<div style="display:flex;justify-content: space-between;">
<div style="flex:1; min-width:600px;height:600px;border: 1px solid #333;">
<div style="width: 100%;min-width:600px;font-weight: 600;text-align: center;">{{ state.clickCity }}</div>
<div id="barChartId" style="min-width:600px;height:600px;margin: 0 auto;">
</div>
</div>
<div style="width: 600px;height:600px;border: 1px solid #333;">
<a-table :scroll="{ x: 600, y: 450 }" :columns="state.columns" :data-source="state.dataSource"
:loading="state.loading" :pagination="state.pagination" bordered style="border-bottom:1px solid #f0f0f0;">
<template #bodyCell="{ column, record }">
<template v-if="column.key === 'imgSrc'">
<a-image :src="record.imgSrc" height="50" :alt="record.imgSrc" />
</template>
<template v-else-if="column.key === 'name'">
<a :href="record.url" target="_blank">
{{ record.name }}
</a>
</template>
</template>
</a-table>
</div>
</div>
</template>
<script setup>
import chinaJson from './chinaGeo.js';
import Author from './Author.vue'
import gameJson from './gameJson.js';
import { tableGameColumns } from './const.js'
import * as echarts from 'echarts';
import { defineProps, reactive, onBeforeMount, onUnmounted, onMounted } from 'vue';
const props = defineProps({
tableData: []
})
const state = reactive({
title: 'vue3 ts antd 参赛选手所在城市',
clickCity: '全国',
maxCityNum: 0,
totalRealNum: 0,
totlaNum: '',
linesCoord: [],
focusCity: '广东省',
locationGis: [],
centerLoction: [],
aimPointData: [],
airData: [],
exportLoading: false,
columns: tableGameColumns,
dataSource: [],
echartInstance: undefined,
pagination: {
total: 0,
current: 1,
pageSize: 50,
pageSizeOptions: ['50', '100', '200'],
showTotal: (total, range) => {
return range[0] + '-' + range[1] + ' 共' + total + '个选手';
},
onShowSizeChange: changePageSize, // 改变每页数量时更新显示
onChange: changePage,//点击页码事件
}
})
function initDataSource() {
state.clickCity = '全国'
state.dataSource = []
state.total = 0
Object.keys(gameJson).forEach(uid => {
const isTruth = gameJson[uid].postUrl.includes(gameJson[uid].url)
state.dataSource.push({
uid: gameJson[uid].uid,
name: gameJson[uid].name,
imgSrc: gameJson[uid].imgSrc,
url: gameJson[uid].url,
ip: gameJson[uid].ip.split(':')[1],
status: isTruth ? '有效' : '无效'
})
// 有效人数
if (isTruth) {
state.totalRealNum += 1
}
state.total += 1
})
state.pagination.current = 1
state.totlaNum = state.total
}
function filterName(name) {
state.clickCity = name
state.dataSource = []
state.total = 0
Object.keys(gameJson).forEach(uid => {
const locName = gameJson[uid].ip.split(':')[1]
if (name.includes(locName)) {
state.dataSource.push({
uid: gameJson[uid].uid,
imgSrc: gameJson[uid].imgSrc,
name: gameJson[uid].name,
ip: locName
})
state.total += 1
}
})
state.pagination.current = 1
}
function filterMapName(name) {
const res = []
Object.keys(gameJson).forEach(uid => {
const locName = gameJson[uid].ip.split(':')[1]
if (name.includes(locName)) {
res.push({
uid: gameJson[uid].uid,
imgSrc: gameJson[uid].imgSrc,
name: gameJson[uid].name,
ip: locName
})
}
})
return res
}
onBeforeMount(() => {
echarts.registerMap('chinaJson', chinaJson)
})
function initMap() {
let itemData = chinaJson.features
let length = itemData.length
state.aimPointData = []
state.airData = []
state.linesCoord = []
for (let loc = 0; loc < length; ++loc) {
let name = itemData[loc].properties.name
state.aimPointData.push({
value: name
})
let center = itemData[loc].properties.center
// 中心位置
if (name.includes(state.focusCity)) {
state.centerLoction = center
}
}
for (let loc = 0; loc < length; ++loc) {
let name = itemData[loc].properties.name
console.log('name', name)
let number = 0
let center = itemData[loc].properties.center
Object.keys(gameJson).forEach(uid => {
const locName = gameJson[uid].ip.split(':')[1]
if (name && name.includes(locName)) {
number += 1
}
})
state.locationGis.push({
value: center
})
// eslint-disable-next-line eqeqeq
if (name && !name.includes(state.focusCity)) {
if (center && state.centerLoction) {
state.linesCoord.push([center, state.centerLoction])
}
}
// eslint-disable-next-line eqeqeq
if (name) {
let temp = {
name: name,
value: Number(number)
}
state.airData.push(temp)
}
if (state.maxCityNum < number) {
state.maxCityNum = number
}
continue
}
console.log('state.maxCityNum', state.maxCityNum)
renderEchartBar()
}
// storage
function changePage(page, pageSize) {
state.pagination.current = page
state.pagination.pageSize = pageSize
}
function changePageSize(current, pageSize) {
state.pagination.current = current
state.pagination.pageSize = pageSize
}
function renderEchartBar() {
// 基于准备好的dom,初始化echarts实例
const domInstance = document.getElementById('barChartId')
if (domInstance) {
domInstance.removeAttribute('_echarts_instance_')
}
else {
return
}
const myChart = echarts.init(domInstance);
const option = {
backgroundColor: 'rgba(0,0,0,0)',//背景色
title: {
text: '中国地图',
subtext: 'chinaJson',
color: '#fff'
},
visualMap: { // 设置视觉映射
min: 0,
max: 20,
text: ['最高', '最低'],
realtime: true,
calculable: true,
inRange: {
color: ['lightskyblue', 'yellow', 'orangered']
}
},
geo: {
// 经纬度中心
// center: state.centerLoction,
type: 'map',
map: 'chinaJson', // 这里的值要和上面registerMap的第一个参数一致
roam: false, // 拖拽
nameProperty: 'name',
geoIndex: 1,
aspectScale: 0.75, // 长宽比, 默认值 0.75
// 悬浮标签
label: {
type: 'map',
map: 'chinaJson', // 这里的值要和上面registerMap的第一个参数一致
// roam: false, // 拖拽
// nameProperty: 'name',
show: true,
color: '#333',
formatter: function (params) {
return params.name
},
// backgroundColor: '#546de5',
align: 'center',
fontSize: 10,
width: (function () {
// let n = parseInt(Math.random() * 10)
return 110
})(),
height: 50,
shadowColor: 'rgba(0,0,0,.7)',
borderRadius: 10
},
zoom: 1.2
},
tooltip: {
show: true,
position: ['10%', '10%'],
formatter: (params) => {
const { name } = params.data
const filterData = filterMapName(name)
const strInfo = filterData.map(item => {
return `<img src=${item.imgSrc} width='20' height='20'/> ${item.name}`
}).join('<br>')
const value = filterData.length
return `地区:${name}<br>
总人数:${value} <br>
人员信息:<br>${strInfo}`
}
},
series: [
// 坐标点的热力数据
{
data: state.airData,
geoIndex: 0, // 将热力的数据和第0个geo配置关联在一起
type: 'map',
roam: false,
itemStyle: {
normal: {
areaColor: "rgba(0, 0, 0, 0)",
borderWidth: 8, //设置外层边框
borderColor: "rgba(135,235, 45, 1)",
shadowColor: "rgba(135,235, 45, 1)",
shadowBlur: 40, //地图外层光晕
},
},
},
{
type: 'effectScatter',
// 渲染显示
zlevel: 3,
showEffectOn: 'render',
data: state.locationGis, // 配置散点的坐标数据
coordinateSystem: 'geo', // 指明散点使用的坐标系统
rippleEffect: {
// 缩放
scale: 4,
// 涟漪的颜色
color: '#cf6a87',
// 波纹数量
number: 2,
// 扩散方式 stroke(线条) fill(区域覆盖)
brushType: 'fill'
},
// 形状
symbol: 'circle'
},
// 飞线层
{
// name: '贵阳市飞线',
type: 'lines',
coordinateSystem: 'geo',
polyline: true,
zlevel: 3,
effect: {
show: true,
period: 10,
trailLength: 0, // 拖尾
symbol: 'arrow', // 箭头
color: 'red', // 样式颜色
symbolSize: 2
},
lineStyle: {
color: '#000',
width: 2,
type: 'solid',
dashOffset: 1
},
// 飞线层数据
data: state.linesCoord
}
],
}
// 使用刚指定的配置项和数据显示图表。
myChart.setOption(option, true);
// 监听
state.echartInstance = myChart;
myChart.on('click', function (params) {
console.log('params', params)
filterName(params.name)
});
window.onresize = myChart.resize;
}
onUnmounted(() => {
window.onresize = null
})
onMounted(() => {
initDataSource()
initMap()
})
</script>
可视化地图表格展示:
得出结论当前有效报名人数41人
⭐结束
本文分享到这结束,如有错误或者不足之处欢迎指出!

👍 点赞,是我创作的动力!
⭐️ 收藏,是我努力的方向!
✏️ 评论,是我进步的财富!
💖 感谢你的阅读!


 4万+
4万+


 被折叠的 条评论
为什么被折叠?
被折叠的 条评论
为什么被折叠?
 到【灌水乐园】发言


