


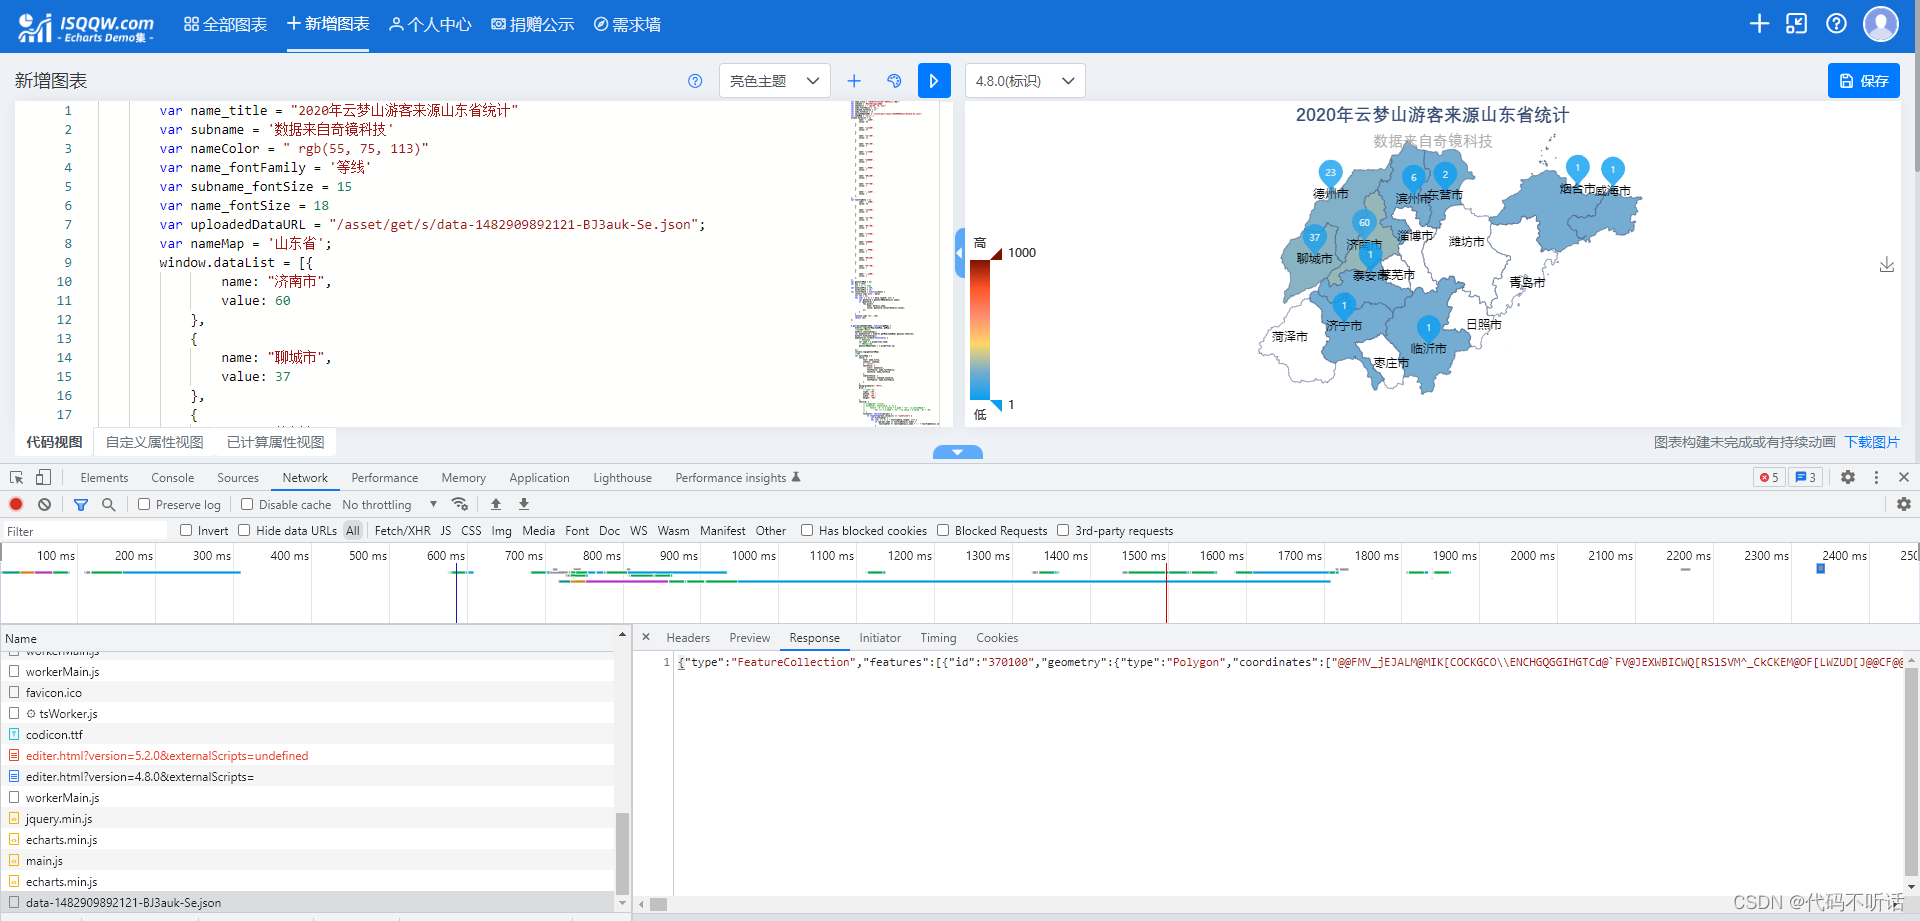
根据echarts资源网站复制到自己vue项目中并运行
echarts资源网站地址:echart
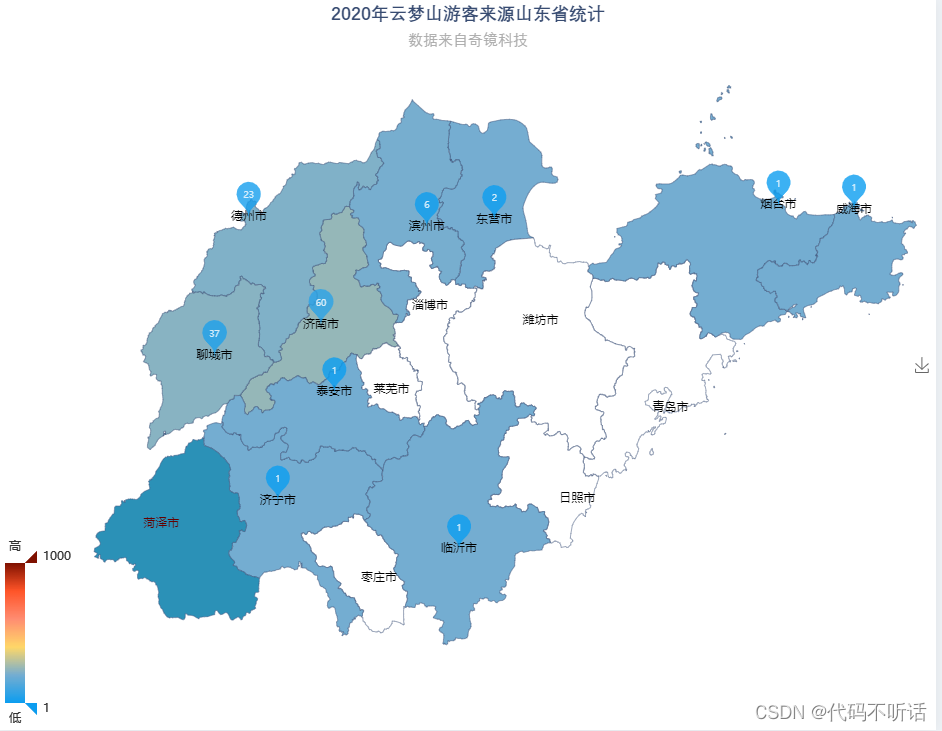
本次使用的echarts实例地址 : [2020年云梦山游客来源山东省统计](https://www.isqqw.com/add?from=20844
效果图:
资源源码
		var name_title = "2020年云梦山游客来源山东省统计"
		var subname = '数据来自奇镜科技'
		var nameColor = " rgb(55, 75, 113)"
		var name_fontFamily = '等线'
		var subname_fontSize = 15
		var name_fontSize = 18
		var uploadedDataURL = "/asset/get/s/data-1482909892121-BJ3auk-Se.json";
		var nameMap = '山东省';
		window.dataList = [{
		        name: "济南市",
		        value: 60
		    },
		    {
		        name: "聊城市",
		        value: 37
		    },
		    {
		        name: "德州市",
		        value: 23
		    },
		    {
		        name: "滨州市",
		        value: 6
		    },
		    {
		        name: "东营市",
		        value: 2
		    },
		    {
		        name: "威海市",
		        value: 1
		    },
		    {
		        name: "烟台市",
		        value: 1
		    },
		    {
		        name: "泰安市",
		        value: 1
		    },
		    {
		        name: "临沂市",
		        value: 1
		    },
		    {
		        name: "济宁市",
		        value: 1
		    },
		];
		var toolTipData = [{
		        name: "济南市",
		        value: 60
		    },
		    {
		        name: "聊城市",
		        value: 37
		    },
		    {
		        name: "德州市",
		        value: 23
		    },
		    {
		        name: "滨州市",
		        value: 6
		    },
		    {
		        name: "东营市",
		        value: 2
		    },
		    {
		        name: "威海市",
		        value: 1
		    },
		    {
		        name: "烟台市",
		        value: 1
		    },
		    {
		        name: "泰安市",
		        value: 1
		    },
		    {
		        name: "临沂市",
		        value: 1
		    },
		    {
		        name: "济宁市",
		        value: 1
		    },
		];
		var geoCoordMap = {};
		var max = 2000,
		    min = 1; // todo
		var maxSize4Pin = 100,
		    minSize4Pin = 40;
		var convertData = function(data) {
		    console.log('data', data)
		    var res = [];
		    for (var i = 0; i < data.length; i++) {
		        var geoCoord = geoCoordMap[data[i].name];
		        if (geoCoord) {
		            res.push({
		                name: data[i].name,
		                value: geoCoord.concat(data[i].value),
		            });
		        }
		    }
		    console.log('res', res)
		    return res;
		};


		$.get(uploadedDataURL, function(gdMap) {
		    echarts.registerMap(nameMap, gdMap);
		    /*获取地图数据*/
		    myChart.showLoading();
		    var mapFeatures = echarts.getMap(nameMap).geoJson.features;
		    myChart.hideLoading();
		    mapFeatures.forEach(function(v) {
		        // 地区名称
		        var name = v.properties.name;
		        // 地区经纬度
		        geoCoordMap[name] = v.properties.cp;

		    });
		    console.log(geoCoordMap)
		    //GDP
		    var optionMap = {
		        title: {
		            text: name_title,
		            subtext: subname,
		            x: 'center',
		            textStyle: {
		                color: nameColor,
		                fontFamily: name_fontFamily,
		                fontSize: name_fontSize
		            },
		            subtextStyle: {
		                fontSize: subname_fontSize,
		                fontFamily: name_fontFamily
		            }
		        },
		        backgroundColor: "#fff",
		        grid: {
		            // left:'2%',
		            right: '10%',
		            bottom: '3%',
		            width: '20%',
		            height: '50%'
		        },
		        tooltip: {

		            formatter: function(params) {
		                if (typeof(params.value)[2] == "undefined") {
		                    var toolTiphtml = ''
		                    for (var i = 0; i < toolTipData.length; i++) {
		                        if (params.name == toolTipData[i].name) {
		                            toolTiphtml += toolTipData[i].name + ':' + toolTipData[i].value + '人'
		                        }
		                    }
		                    return toolTiphtml;
		                } else {
		                    var toolTiphtml = ''
		                    for (var i = 0; i < toolTipData.length; i++) {
		                        if (params.name == toolTipData[i].name) {
		                            toolTiphtml += toolTipData[i].name + ':' + toolTipData[i].value + '人'
		                        }
		                    }
		                    return toolTiphtml;
		                }
		            }
		        },

		        visualMap: [
					{
		                show: false,
		                min: 1,
		                max: 1000,
		                left: 'left',
		                top: 'bottom',
		                text: ['高', '低'], // 文本,默认为数值文本
		                calculable: true,
		                seriesIndex: [0],
		                inRange: {
		                    color: ['#74add1', '#ffd768', '#ff8c71', '#ff5428', '#7f1100']

		                },
		            },
		            {
		                show: false,
		                min: 1,
		                max: 1000,
		                left: 'left',
		                top: 'bottom',
		                text: ['高', '低'], // 文本,默认为数值文本
		                calculable: true,
		                seriesIndex: [1],
		                inRange: {
		                    color: ['#0b9df0', '#74add1', '#ffd768', '#ff8c71', '#ff5428', '#7f1100']

		                },
		            }
		        ],
		        toolbox: {
		            show: true,
		            orient: 'vertical',
		            left: 'right',
		            top: 'center',
		            feature: {
		                saveAsImage: {}
		            }
		        },
		        geo: {
		            show: true,
		            map: nameMap,
		            label: {
		                normal: {
		                    show: true
		                },
		                emphasis: {
		                    show: false,
		                }
		            },
		            roam: true,
		            itemStyle: {
		                normal: {
		                    areaColor: '#ffffff',
		                    borderColor: '#3B5077',
		                },
		                emphasis: {
		                    areaColor: '#2B91B7',
		                }
		            }
		        },
		        series: [{
		                name: "十一游客来源",
		                type: 'map',
		                map: nameMap,
		                // aspectScale: 0.75, //长宽比
		                // left: '2%',
		                // // right: '35%',
		                // top: 10,
		                // width: '90%',
		                // height: '90%',
		                roam: false,
		                // itemStyle: {
		                //     normal: {
		                //         areaColor: '#fff',
		                //         borderColor: '#00effc',
		                //         borderWidth: 1.5,
		                //         label: {
		                //             show: true,
		                //             color: '#fff',
		                //         },

		                //         emphasis: {
		                //             label: {
		                //                 show: true
		                //             }
		                //         }
		                //     }
		                // },
		                geoIndex: 0,
		                data: window.dataList
		            },
		            {
		                name: '点',
		                type: 'scatter',
		                coordinateSystem: 'geo',
		                symbol: 'pin', //气泡
		                symbolSize: function(val) {
		                    var a = (maxSize4Pin - minSize4Pin) / (max - min);
		                    var b = minSize4Pin - a * min;
		                    b = maxSize4Pin - a * max;
		                    // return  val[2] ;
		                    return a * val[2] + b;
		                },
		                label: {
		                    normal: {
		                        formatter: function(obj) {
		                            return obj.data.value[2];
		                        },
		                        show: true,
		                        textStyle: {
		                            color: '#fff',
		                            fontSize: 9,
		                        }
		                    }
		                },
		                itemStyle: {
		                    normal: {
		                        color: '#F62157', //标志颜色
		                    }
		                },
		                zlevel: 6,
		                data: convertData(window.dataList),
		            },
		        ]

		    };
		    myChart.setOption(optionMap, true);
		});
获取json数据
var uploadedDataURL = "/asset/get/s/data-1482909892121-BJ3auk-Se.json";
打开控制台刷新页面
将json请求中的Respone全部复制放到json中,地址:json
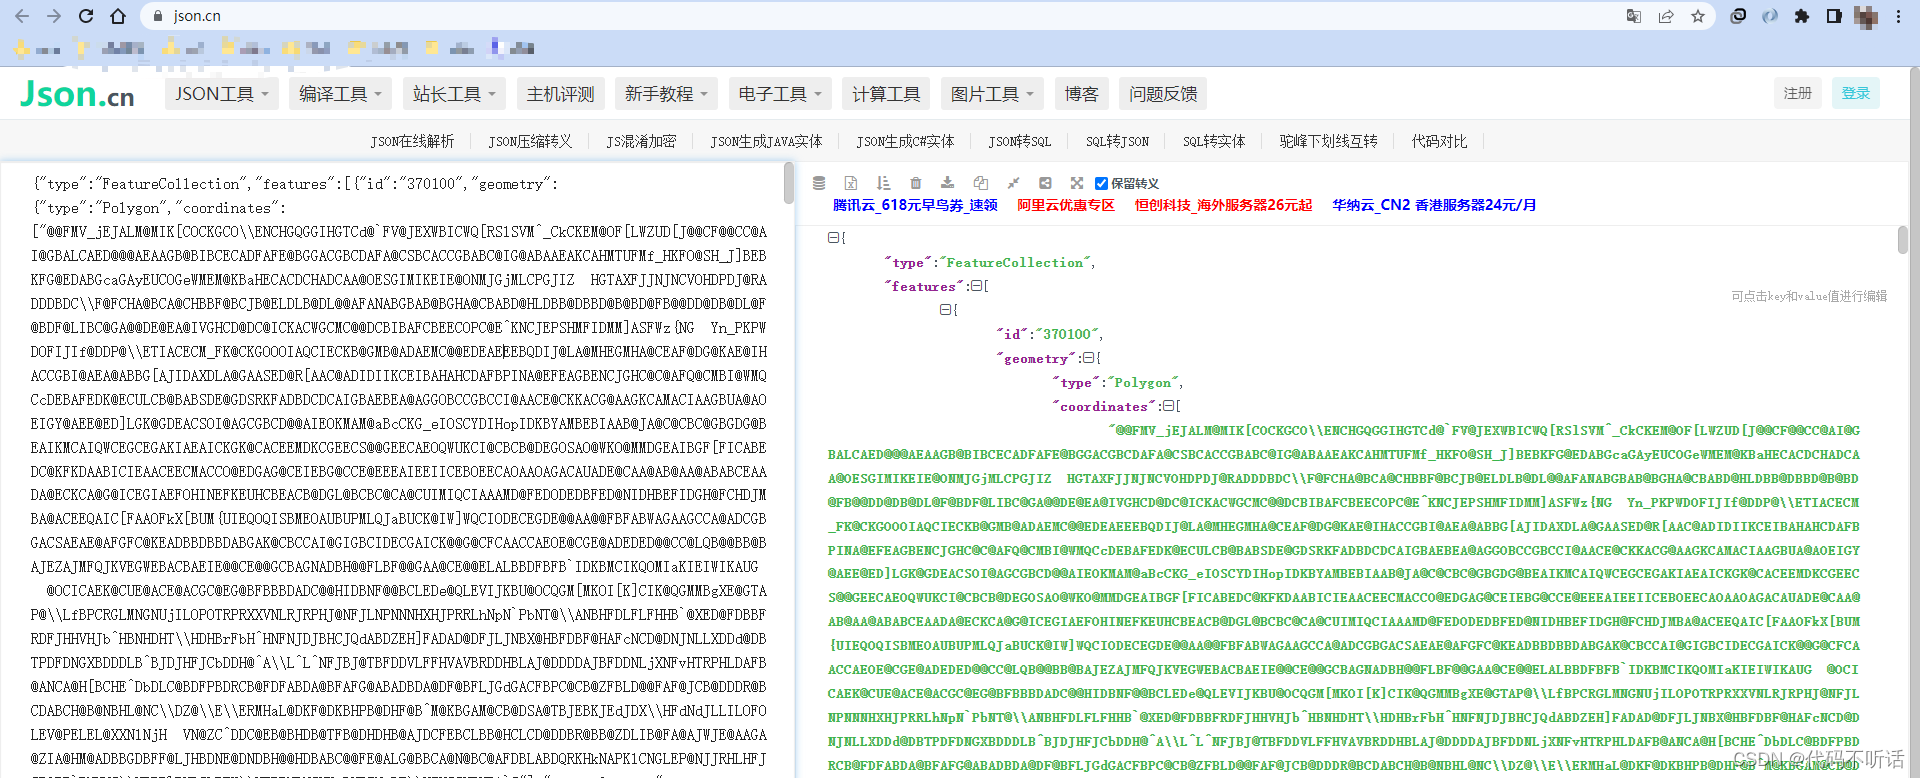
将转换后的json串复制,在vue中创建json文件,粘贴
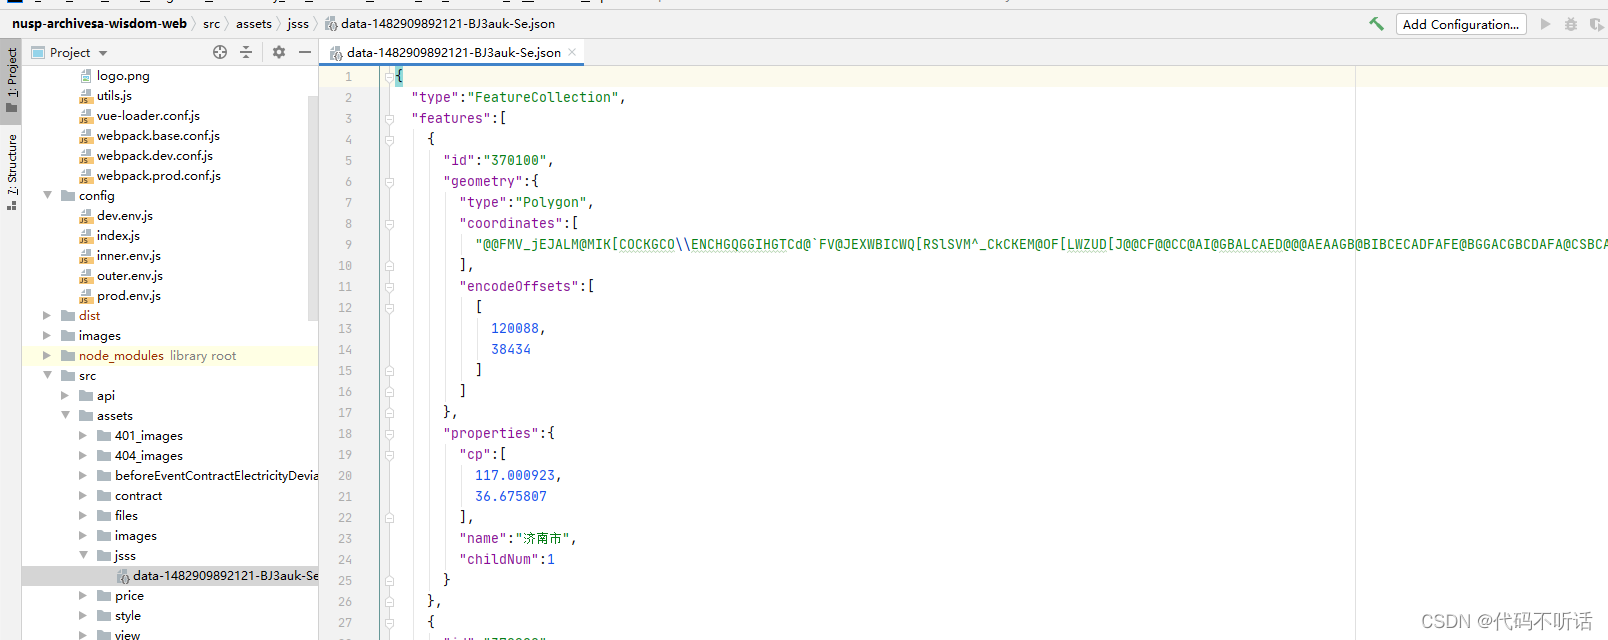
创建接线图文件
代码:
<template>
<div>
<div id="myChart" :style="{width: '100%', height: '600px'}"></div>
</div>
</template>
<script>
import json from "../../assets/jsss/data-1482909892121-BJ3auk-Se.json";
import * as echarts from 'echarts'
let cityCoordinate = [{
name: "济南市",
value: 60
},
{
name: "聊城市",
value: 37
},
{
name: "德州市",
value: 23
},
{
name: "滨州市",
value: 6
},
{
name: "东营市",
value: 2
},
{
name: "威海市",
value: 1
},
{
name: "烟台市",
value: 1
},
{
name: "泰安市",
value: 1
},
{
name: "临沂市",
value: 1
},
{
name: "济宁市",
value: 1
},
];
export default {
name: "someCharts1",
data() {
return {
msg: "Welcome to Your Vue.js App",
};
},
mounted() {
// this.$nextTick(()=>{
// this.drawLine()
// })
this.selectCityMessage();
},
methods: {
//项目统计
selectCityMessage() {
this.$axios.post("StatisticAnalysis/selectCityMessage")
.then(result => {
this.list = result.data.data;
// let arr = []
// for (let i = 0; i < cityCoordinate.length; i++) {
// for (let j = 0; j < this.list.length; j++) {
// if (cityCoordinate[i].name == this.list[j].name) {
// cityCoordinate[i].connected = this.list[j].connected;
// cityCoordinate[i].unaccessed = this.list[j].unaccessed;
// arr.push(cityCoordinate[i])
// }
// }
// }
this.$nextTick(() => {
this.drawLine(this.list)
})
})
},
drawLine(arr) {
console.log(arr);
var myChart = this.$echarts.init(document.getElementById("myChart"));
var nameColor = " rgb(55, 75, 113)"
var name_fontFamily = '等线'
var subname_fontSize = 15
var name_fontSize = 18
var nameMap = '山东省';
var geoCoordMap = {};
var max = 2000,
min = 1; // todo
var maxSize4Pin = 100,
minSize4Pin = 40;
var convertData = function (data) {
console.log('data', data)
var res = [];
for (var i = 0; i < data.length; i++) {
var geoCoord = geoCoordMap[data[i].name];
if (geoCoord) {
res.push({
name: data[i].name,
value: geoCoord.concat(data[i].value),
});
}
}
console.log('res', res)
return res;
};
myChart.setOption({})
echarts.registerMap(nameMap, json);
/*获取地图数据*/
myChart.showLoading();
var mapFeatures = echarts.getMap(nameMap).geoJson.features;
myChart.hideLoading();
mapFeatures.forEach(function (v) {
// 地区名称
var name = v.properties.name;
// 地区经纬度
geoCoordMap[name] = v.properties.cp;
});
console.log(geoCoordMap)
//GDP
var optionMap = {
title: {
x: 'center',
textStyle: {
color: nameColor,
fontFamily: name_fontFamily,
fontSize: name_fontSize
},
subtextStyle: {
fontSize: subname_fontSize,
fontFamily: name_fontFamily
}
},
backgroundColor: "#020a0f",
grid: {
// left:'2%',
right: '10%',
bottom: '3%',
width: '20%',
height: '50%'
},
tooltip: {
formatter: function (params) {
var toolTiphtml = ''
for (var i = 0; i < arr.length; i++) {
if (params.name == arr[i].name) {
toolTiphtml += '已接入:' + arr[i].connected+ '<br />' + '未接入:' + arr[i].unaccessed
}
}
return toolTiphtml;
}
},
visualMap: [
{
show: false,
min: 1,
max: 1000,
left: 'left',
top: 'bottom',
text: ['高', '低'], // 文本,默认为数值文本
calculable: true,
seriesIndex: [0],
inRange: {
color: ['#74add1', '#ffd768', '#ff8c71', '#ff5428', '#7f1100']
},
},
{
show: false,
min: 1,
max: 1000,
left: 'left',
top: 'bottom',
text: ['高', '低'], // 文本,默认为数值文本
calculable: true,
seriesIndex: [1],
inRange: {
color: ['#0b9df0', '#74add1', '#ffd768', '#ff8c71', '#ff5428', '#7f1100']
},
}
],
toolbox: {
show: true,
orient: 'vertical',
left: 'right',
top: 'center',
feature: {
saveAsImage: {}
}
},
geo: {
show: true,
map: nameMap,
label: {
normal: {
show: true
},
emphasis: {
show: false,
}
},
roam: true,
itemStyle: {
normal: {
areaColor: '#ffffff',
borderColor: '#3B5077',
},
emphasis: {
areaColor: '#2B91B7',
}
}
},
series: [{
type: 'map',
map: nameMap,
roam: false,
geoIndex: 0,
data: arr
},
{
name: '点',
type: 'scatter',
coordinateSystem: 'geo',
symbol: 'pin', //气泡
symbolSize: function (val) {
var a = (maxSize4Pin - minSize4Pin) / (max - min);
var b = minSize4Pin - a * min;
b = maxSize4Pin - a * max;
// return val[2] ;
return a * val[2] + b;
},
label: {
normal: {
formatter: function (obj) {
return obj.data.value[2];
},
show: true,
textStyle: {
color: '#fff',
fontSize: 9,
}
}
},
itemStyle: {
normal: {
color: '#F62157', //标志颜色
}
},
zlevel: 6,
data: convertData(arr),
},
]
};
myChart.setOption(optionMap, true);
}
}
};
</script>
<style>
</style>
注意:
$.get(uploadedDataURL, function(gdMap) 删除
echarts.registerMap(nameMap, gdMap); 中gdmap替换为json
完结撒花


 3095
3095


 被折叠的 条评论
为什么被折叠?
被折叠的 条评论
为什么被折叠?
 到【灌水乐园】发言


