


 文章描述了在ECharts中,当dataZoom的范围与图表长度相等且start=0或end=100时,两端文本无法完全显示的问题,提供了解决方案:将文本放置在下方,并根据zoom值调整水平位置以确保完整显示。
问题:当echarts dataZoom与图表一样长时,且start=0或end=100时,两端文本显示不全,如下图
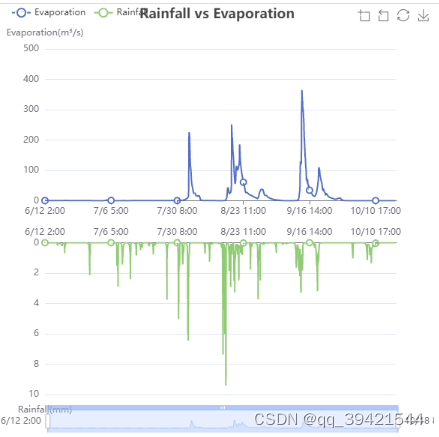
解决:可以把文本放在下边,并且start<10或end>90时,手动更改水平位置
<template>
  <div ref="echartsBox" class="echartsBox"></div>
</template>

<script lang='ts' setup>
import * as echarts from "echarts"
import {  onMounted, ref } from 'vue'
let echartsBox = ref()

let timeData = [
  '2009/6/12 2:00', '2009/6/12 3:00', '2009/6/12 4:00', '2009/6/12 5:00', '2009/6/12 6:00', '2009/6/12 7:00', '2009/6/12 8:00', '2009/6/12 9:00', '2009/6/12 10:00', '2009/6/12 11:00', '2009/6/12 12:00', '2009/6/12 13:00', '2009/6/12 14:00', '2009/6/12 15:00', '2009/6/12 16:00', '2009/6/12 17:00', '2009/6/12 18:00', '2009/6/12 19:00', '2009/6/12 20:00', '2009/6/12 21:00',  '2009/10/15 21:00', '2009/10/15 22:00', '2009/10/15 23:00', '2009/10/16 0:00', '2009/10/16 1:00', '2009/10/16 2:00', '2009/10/16 3:00', '2009/10/16 4:00', '2009/10/16 5:00', '2009/10/16 6:00', '2009/10/16 7:00', '2009/10/16 8:00', '2009/10/16 9:00', '2009/10/16 10:00', '2009/10/16 11:00', '2009/10/16 12:00', '2009/10/16 13:00', '2009/10/16 14:00', '2009/10/16 15:00', '2009/10/16 16:00', '2009/10/16 17:00', '2009/10/16 18:00', '2009/10/16 19:00', '2009/10/16 20:00', '2009/10/16 21:00', '2009/10/16 22:00', '2009/10/16 23:00', '2009/10/17 0:00', '2009/10/17 1:00', '2009/10/17 2:00', '2009/10/17 3:00', '2009/10/17 4:00', '2009/10/17 5:00', '2009/10/17 6:00', '2009/10/17 7:00', '2009/10/17 8:00', '2009/10/17 9:00', '2009/10/17 10:00', '2009/10/17 11:00', '2009/10/17 12:00', '2009/10/17 13:00', '2009/10/17 14:00', '2009/10/17 15:00', '2009/10/17 16:00', '2009/10/17 17:00', '2009/10/17 18:00', '2009/10/17 19:00', '2009/10/17 20:00', '2009/10/17 21:00', '2009/10/17 22:00', '2009/10/17 23:00', '2009/10/18 0:00', '2009/10/18 1:00', '2009/10/18 2:00', '2009/10/18 3:00', '2009/10/18 4:00', '2009/10/18 5:00', '2009/10/18 6:00', '2009/10/18 7:00', '2009/10/18 8:00'
];
timeData = timeData.map(function (str) {
  return str.replace('2009/', '');
});
let option = {
  title: {
      text: 'Rainfall vs Evaporation',
      left: 'center'
  },
  tooltip: {
      trigger: 'axis',
      axisPointer: {
          animation: false
      }
  },
  legend: {
      data: ['Evaporation', 'Rainfall'],
      left: 10
  },
  toolbox: {
      feature: {
          dataZoom: {
              yAxisIndex: 'none'
          },
          restore: {},
          saveAsImage: {}
      }
  },
  axisPointer: {
      link: [
          {
              xAxisIndex: 'all'
          }
      ]
  },
  dataZoom: {
      show: true,
      // realtime: true,
      start: 30,
      end: 70,
      xAxisIndex: [0, 1],
  },

  grid: [
      {
          left: 60,
          right: 50,
          height: '35%'
      },
      {
          left: 60,
          right: 50,
          top: '55%',
          height: '35%'
      }
  ],
  xAxis: [
      {
          type: 'category',
          boundaryGap: false,
          axisLine: { onZero: true },
          data: timeData
      },
      {
          gridIndex: 1,
          type: 'category',
          boundaryGap: false,
          axisLine: { onZero: true },
          data: timeData,
          position: 'top'
      }
  ],
  yAxis: [
      {
          name: 'Evaporation(m³/s)',
          type: 'value',
          max: 500
      },
      {
          gridIndex: 1,
          name: 'Rainfall(mm)',
          type: 'value',
          inverse: true
      }
  ],
  series: [
      {
          name: 'Evaporation',
          type: 'line',
          symbolSize: 8,
          // prettier-ignore
          data: [
              0.97, 0.96, 0.96, 0.95, 0.95, 0.94, 0.94, 0.94, 0.94, 0.94, 0.94, 0.94, 0.94, 0.94, 0.94, 0.94, 0.94, 0.94, 0.94, 0.94, 0.94, 0.94, 0.94, 0.94, 0.94, 0.94, 0.94, 0.94, 0.94, 0.94, 0.94, 0.94, 0.94, 0.94, 0.94, 0.94, 0.94, 0.94, 0.94, 0.94, 0.94, 0.94, 0.94, 0.94, 0.94, 0.94, 0.94, 0.94, 0.94, 0.94, 0.94, 0.94, 0.94, 0.94, 0.94, 0.94, 0.94, 0.94, 0.94, 0.94, 0.94, 0.94, 0.94, 0.94, 0.94, 0.94, 0.94, 0.94, 0.94, 0.94, 0.94, 0.94, 0.94, 0.94, 0.94, 0.94, 0.94, 0.94, 0.94, 0.94, 0.94,  81.36, 78.74, 77.43, 77.43, 73.5, 74.81, 72.63, 68.58, 66.4, 68.54, 69.78, 67.3, 64.82, 61.1, 59.12, 56.15, 53.18, 50.32, 49.44, 44.16, 36.5, 42.4, 37.96, 37.22,  0.85, 0.84, 0.82, 0.81, 0.79, 0.78, 0.77, 0.75, 0.74, 0.73, 0.72, 0.71, 0.7, 0.69, 0.68, 0.67, 0.66, 0.65, 0.64, 0.64, 0.63, 0.63, 0.62, 0.62, 0.61, 0.61, 0.61, 0.6, 0.6, 0.49, 0.49, 0.48, 0.47, 0.47, 0.47, 0.46, 0.46, 0.45, 0.45, 0.45, 0.44, 0.44, 0.44, 0.43, 0.43, 0.43, 0.42, 0.42, 0.42, 0.41, 0.41, 0.41, 0.41, 0.4, 0.4, 0.4, 0.4, 0.4, 0.4, 0.4, 0.4, 0.4, 0.4, 0.4, 0.4, 0.4, 0.4, 0.4, 0.4, 0.4, 0.4, 0.4, 0.4, 0.4, 0.4, 0.4, 0.4, 0.4, 0.4, 0.4, 0.4, 0.4, 0.4, 0.4, 0.4, 0.4, 0.4, 0.4, 0.4, 0.4, 0.4, 0.4, 0.41, 0.41, 0.41, 0.41, 0.41, 0.41, 0.41, 0.41, 0.41, 0.41, 0.41, 0.41, 0.41, 0.41, 0.41, 0.42, 0.42, 0.42, 0.42, 0.42, 0.42, 0.42, 0.42, 0.42, 0.43, 0.43, 0.43, 0.43, 0.43, 0.43, 0.44, 0.44, 0.44, 0.44, 0.44, 0.44, 0.45, 0.45, 0.45
          ]
      },
      {
          name: 'Rainfall',
          type: 'line',
          xAxisIndex: 1,
          yAxisIndex: 1,
          symbolSize: 8,
          // prettier-ignore
          data: [
              0, 0, 0, 0, 0, 0, 0, 0, 0, 0, 0, 0, 0, 0, 0, 0, 0, 0, 0, 0, 0, 0, 0, 0, 0, 0, 0, 0, 0, 0, 0, 0, 0, 0.005, 0.017, 0.017, 0.017, 0.017, 0.011, 0, 0, 0, 0, 0, 0, 0, 0, 0, 0, 0, 0, 0, 0, 0, 0, 0, 0, 0, 0, 0, 0, 0, 0, 0, 0, 0, 0, 0, 0, 0, 0, 0, 0, 0, 0, 0, 0, 0, 0, 0, 0, 0, 0, 0, 0, 0, 0, 0, 0, 0, 0, 0, 0, 0, 0, 0, 0, 0, 0, 0, 0, 0, 0, 0, 0, 0, 0.021, 0.026, 0.03, 0.036, 0.036, 0.195, 0.221, 0.019, 0.013,2.917, 1.675, 0.081, 0.059, 0.059, 0.148, 0.075, 0.075, 0.078, 0.236, 0.784, 0.784, 0.784, 0.784, 0.741, 0.115, 0.058, 0.058, 0.058, 0.029, 0.015, 0.015, 0.015, 0.015, 0.012, 0.008, 0.604, 0.985, 1.305, 2.273, 2.528, 2.336, 2.496, 2.281, 1.397, 1.713, 3.259, 1.167, 0.745, 0.548, 1.058, 0.684, 0.728, 0.392, 0.179, 0.283, 0.283, 0.46, 0.08, 0.099, 0.099, 0.099, 0.1, 0.143, 0.137, 0.238, 0.317, 0.262,0, 0, 0, 0, 0, 0, 0, 0, 0, 0, 0, 0, 0, 0, 0, 0, 0, 0, 0, 0, 0, 0, 0, 0, 0, 0, 0, 0, 0, 0, 0, 0, 0, 0, 0, 0, 0, 0, 0, 0, 0, 0, 0, 0, 0, 0, 0, 0, 0, 0, 0, 0, 0, 0, 0, 0, 0, 0, 0, 0, 0, 0, 0, 0, 0, 0, 0, 0, 0, 0, 0, 0, 0, 0, 0, 0, 0, 0, 0, 0, 0, 0, 0, 0, 0, 0, 0, 0, 0, 0, 0, 0, 0, 0, 0, 0, 0, 0, 0, 0, 0, 0, 0, 0, 0, 0, 0, 0, 0, 0, 0, 0, 0, 0, 0, 0, 0, 0, 0, 0, 0, 0, 0, 0, 0, 0, 0, 0, 0, 0, 0, 0, 0, 0, 0, 0, 0, 0, 0, 0, 0.005, 0.005, 0.005, 0.005, 0.005, 0.001, 0, 0, 0
          ]
      }
  ]
};
//设置label位置
const setLabel=(myChart:echarts.ECharts,dataZoom:any)=>{
  let sliderZoom = (myChart as any)._componentsViews.find((view: any) => view.type == 'dataZoom.slider')
  let leftP = sliderZoom._displayables.handleLabels[0].style.text.length * 5
  let rightP = -sliderZoom._displayables.handleLabels[1].style.text.length * 5
  sliderZoom._displayables.handleLabels[0].x = dataZoom.start < 10 ? leftP : 0
  sliderZoom._displayables.handleLabels[1].x = dataZoom.end > 90 ? rightP : 0
  sliderZoom._displayables.handleLabels[0].y =12;//根据项目自行调整值
  sliderZoom._displayables.handleLabels[1].y =12
}
onMounted(() => {
  let myChart = echarts.init(echartsBox.value);
  myChart.setOption(option);
  window.onresize = function () {//自适应大小
      myChart.resize();
  };
  setLabel(myChart,option.dataZoom)
  myChart.on('datazoom',(event)=>setLabel(myChart,event))
})

</script>

<style scoped lang="less">
.echartsBox {
  width: 500px;
  height: 500px;
}
</style>
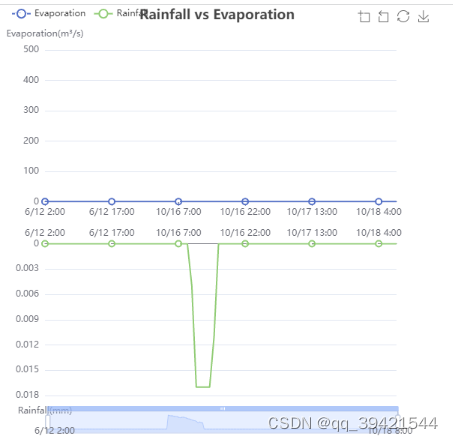
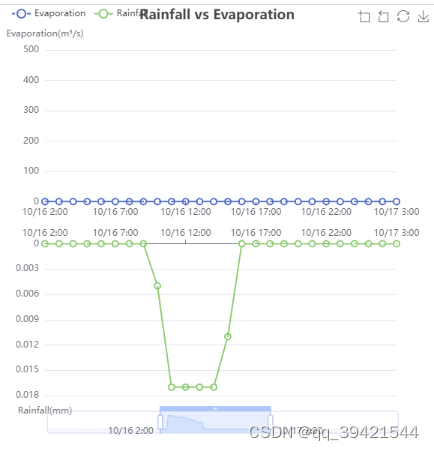
调整后的效果如下图


 被折叠的 条评论
为什么被折叠?
被折叠的 条评论
为什么被折叠?
 到【灌水乐园】发言


