


phpstorm+phpstudy安装xdebug
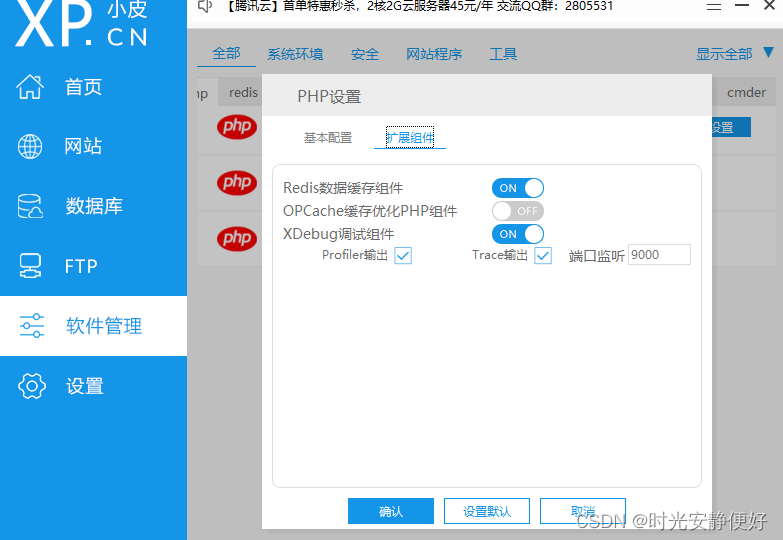
小皮开启xdebug扩展
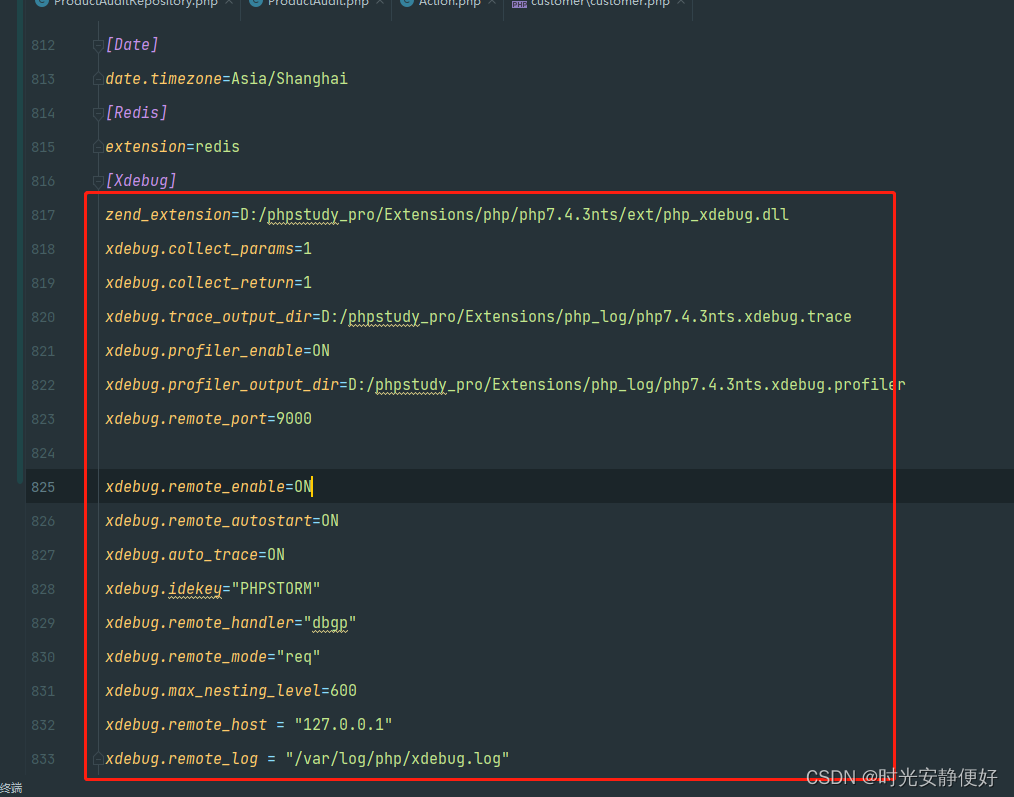
phpini添加一些配置
[Xdebug]
zend_extension=D:/phpstudy_pro/Extensions/php/php7.4.3nts/ext/php_xdebug.dll
xdebug.collect_params=1
xdebug.collect_return=1
xdebug.trace_output_dir=D:/phpstudy_pro/Extensions/php_log/php7.4.3nts.xdebug.trace
xdebug.profiler_enable=ON
xdebug.profiler_output_dir=D:/phpstudy_pro/Extensions/php_log/php7.4.3nts.xdebug.profiler
xdebug.remote_port=9000

xdebug.remote_enable=ON
xdebug.remote_autostart=ON
xdebug.auto_trace=ON
xdebug.idekey="PHPSTORM"
xdebug.remote_handler="dbgp"
xdebug.remote_mode="req"
xdebug.max_nesting_level=600
xdebug.remote_host = "127.0.0.1"
xdebug.remote_log = "/var/log/php/xdebug.log"
添加完以后 重启下phpstudy(就是为了重启下nginx)
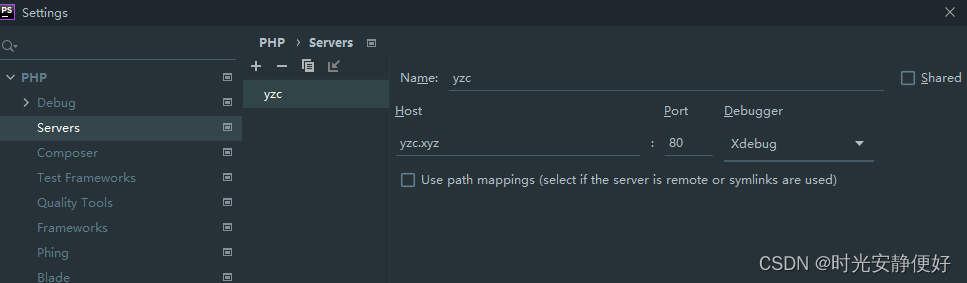
PHPSTORM的配置
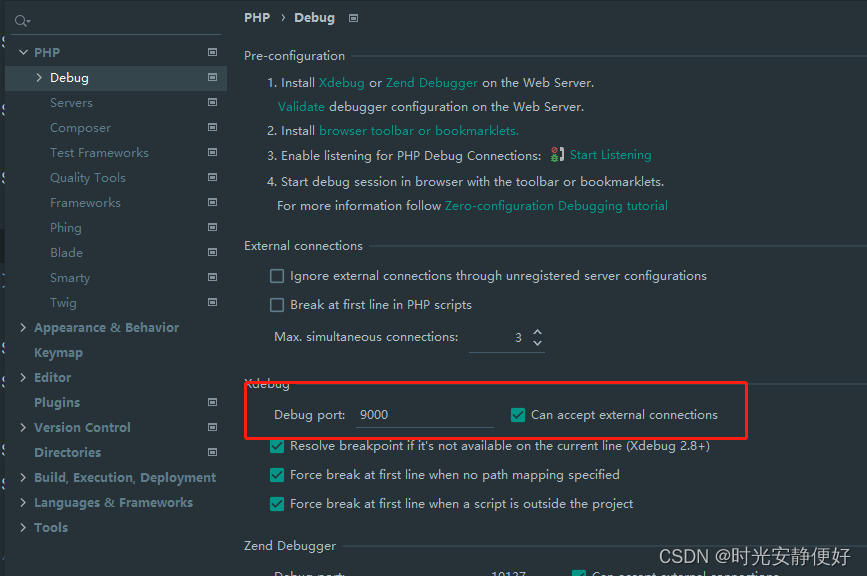
debug端口号要和php.ini中配置的一样

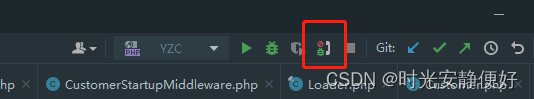
点击三角符合开始 以及这个电话 开启监听
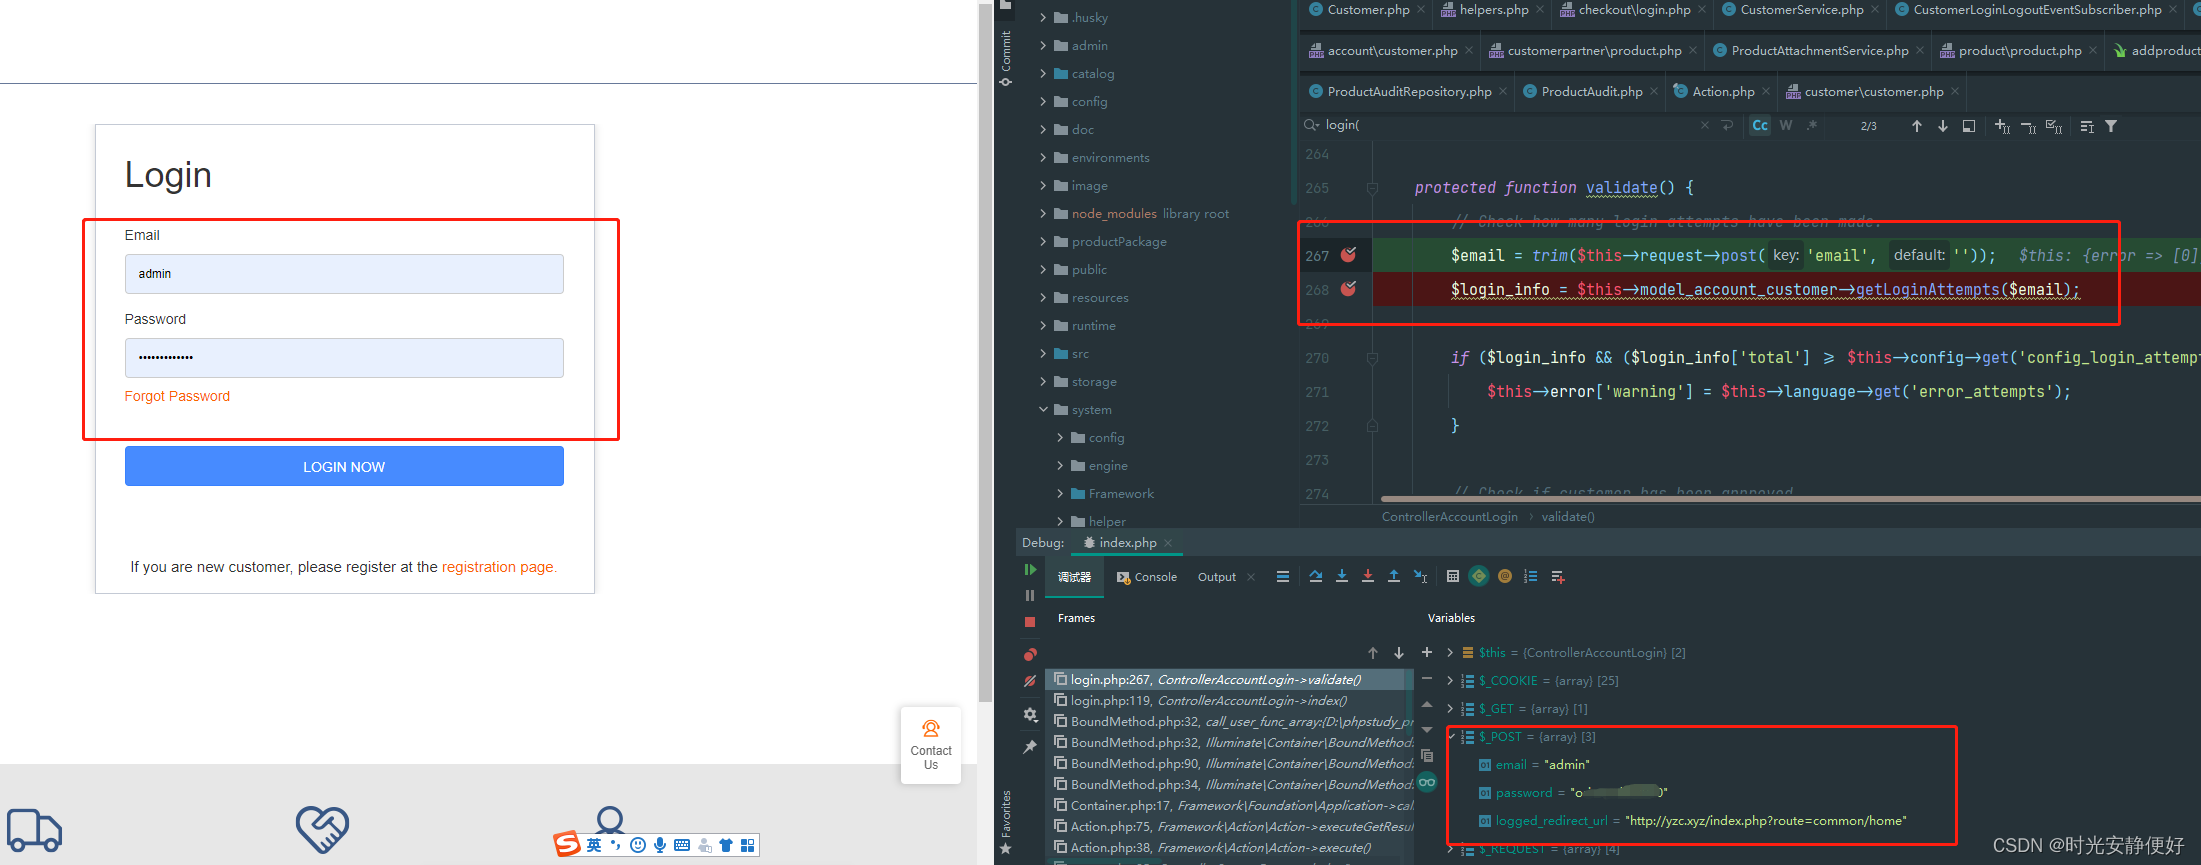
然后在你的代码中打断点 访问你的项目


 5157
5157


 被折叠的 条评论
为什么被折叠?
被折叠的 条评论
为什么被折叠?
 到【灌水乐园】发言


