


 本文是一篇关于使用Python和scikit-learn进行大数据分析的实战项目,通过对泰坦尼克号乘客数据的探索,揭示了性别、船舱等级等因素对生存率的影响,并运用机器学习模型(如随机森林、XGB)进行预测。通过数据清洗、特征工程和模型评估,展示了如何解决生存率预测问题。
大数据第一课(满分作业)——泰坦尼克号生存者预测(Titanic - Machine Learning from Disaster)
1 项目背景
1.1 The Challenge
The sinking of the Titanic is one of the most infamous shipwrecks in history.
On April 15, 1912, during her maiden voyage, the widely considered “unsinkable” RMS Titanic sank after colliding with an iceberg. Unfortunately, there weren’t enough lifeboats for everyone onboard, resulting in the death of 1502 out of 2224 passengers and crew.
While there was some element of luck involved in surviving, it seems some groups of people were more likely to survive than others.
In this challenge, we ask you to build a predictive model that answers the question: “what sorts of people were more likely to survive?” using passenger data (ie name, age, gender, socio-economic class, etc).
1.2 What Data Will I Use in This Competition?
In this competition, you’ll gain access to two similar datasets that include passenger information like name, age, gender, socio-economic class, etc. One dataset is titled ‘train.csv’ and the other is titled ‘test.csv’.
Train.csv will contain the details of a subset of the passengers on board (891 to be exact) and importantly, will reveal whether they survived or not, also known as the “ground truth”.
The ‘test.csv’ dataset contains similar information but does not disclose the “ground truth” for each passenger. It’s your job to predict these outcomes.
Using the patterns you find in the train.csv data, predict whether the other 418 passengers on board (found in test.csv) survived.
Check out the “Data” tab to explore the datasets even further. Once you feel you’ve created a competitive model, submit it to Kaggle to see where your model stands on our leaderboard against other Kagglers.
2 数据获取
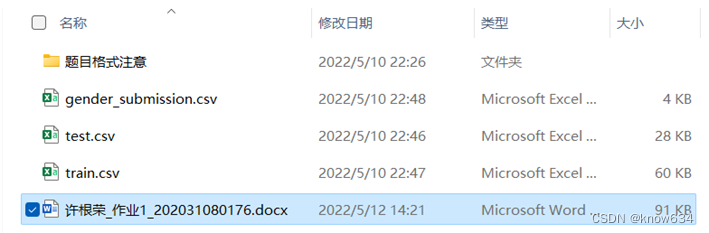
从网上https://www.kaggle.com/competitions/titanic/data下载好数据"train.csv"和"test.csv"还有"gender_submission.csv"之后,如图 1所示,接下来利用Excel和Python语句进行数据总览。
3 数据分析
3.1 数据字段分析
"train.csv"的数据字段分析如下表所示。
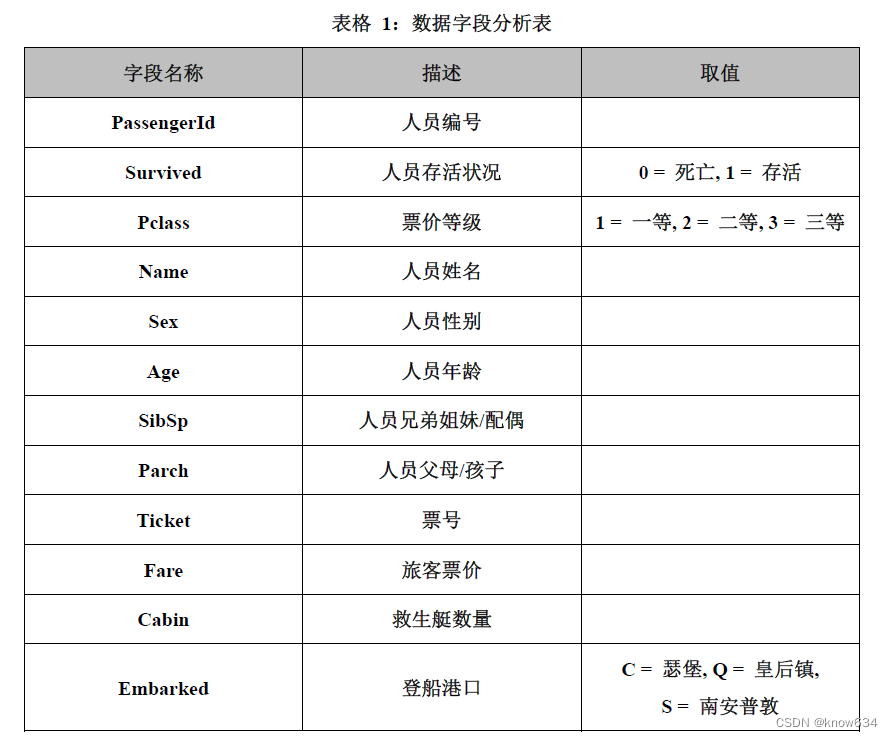
另外,"test.csv"文件中不包含人员存活的情况。
3.2 导入数据
Python版本3.10(Anaconda3环境)、Python IDE PyCharm(Professional 2022.1)
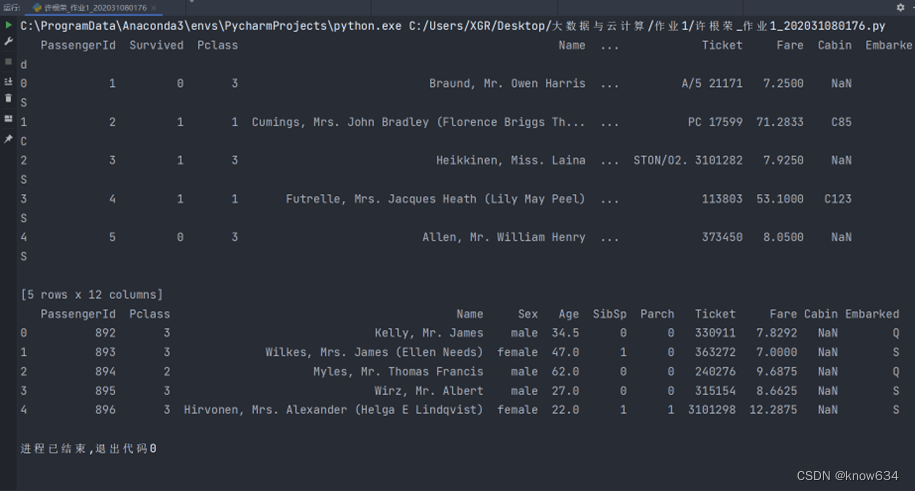
将Python文件建立在"*.csv"文件的同一目录下,代码和运行结果如下
# 导入数据
train = pd.read_csv("./train.csv")
test = pd.read_csv("./test.csv")

# 查看前5条数据,看是否导入成功
print(train.head())
print()
print(test.head())
print()
3.3 数据清洗(预处理)
数据清洗之前需要明确要处理数据的字段类型,浏览上面输出的结果,共有11个字段(PassengerId和Ticket作为编号可以去除,不需考虑),剩余10个字段可以分为四类,如下:
- 数字类特征: 年龄,票价,兄弟姐妹配偶数量,父母小孩数量
- 类别特征: 性别,港口,船舱等级,是否存活
- 包含数字和字符的特征: 船票和船舱
- 文字类特征: 姓名
3.3.1 缺失值处理
# 获取数据的维度和查询各字段缺失值情况
print(train.info())
print()
print(train.isnull().sum())
print()
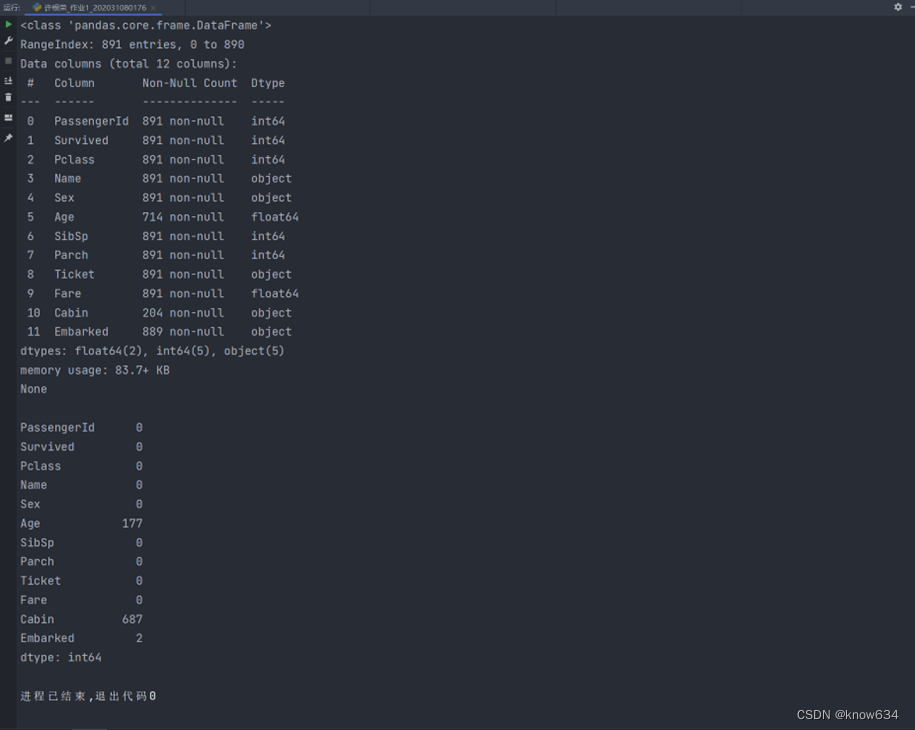
通过缺失值的查询,发现Age字段缺失大约到了20%,可以采用填充的方式进行处理,而Cabin字段的缺失值高达77%,可以直接删除,最后就是登船港口只有2条数据缺失可以直接删除也可以进行填充。接下来逐步进行缺失值处理。
首先是对于年龄字段,填充的具体方式可以查看数据的分布,一般对于年龄的分布都是属于右偏分布(就是均值大于中位数),可以通过describe()方法查询,输出结果如下:(可以发现均值比50%处的中位数大一点,稍稍右偏&
 最低0.47元/天 解锁文章


 被折叠的 条评论
为什么被折叠?
被折叠的 条评论
为什么被折叠?
 到【灌水乐园】发言


