


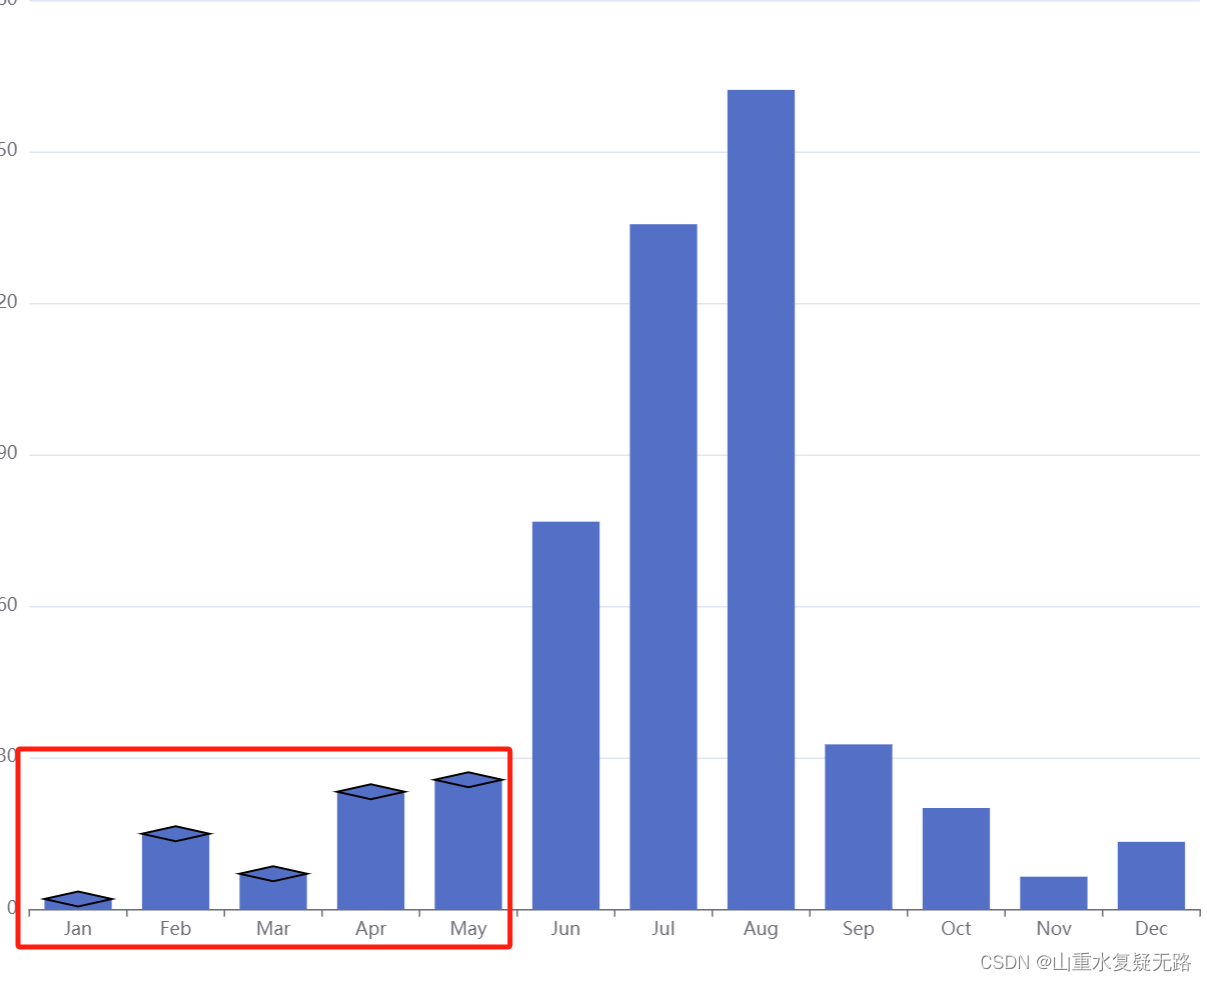
思路:使用markpoint
option = {
  title: {
    text: 'Rainfall vs Evaporation',
    subtext: 'Fake Data'
  },
  tooltip: {
    trigger: 'axis'
  },
  legend: {
    data: ['Rainfall', 'Evaporation']
  },
  toolbox: {
    show: true,
    feature: {
      dataView: { show: true, readOnly: false },
      magicType: { show: true, type: ['line', 'bar'] },
      restore: { show: true },
      saveAsImage: { show: true }
    }
  },
  calculable: true,
  xAxis: [
    {
      type: 'category',
      // prettier-ignore
      data: ['Jan', 'Feb', 'Mar', 'Apr', 'May', 'Jun', 'Jul', 'Aug', 'Sep', 'Oct', 'Nov', 'Dec']
    }
  ],
  yAxis: [
    {
      type: 'value'
    }
  ],
  series: [
    {
      name: 'Rainfall',
      type: 'bar',
      data: [
        2.0,14.9, 7.0, 23.2, 25.6, 76.7, 135.6, 162.2, 32.6, 20.0, 6.4, 13.3
      ],
      markPoint: {
        silent: true,
        label: {show: false},
        symbol:'diamond',
        symbolSize: [45,10],
        itemStyle: {
          borderColor: '#000'
        },
        data: [
          {coord: ['Jan',2]},
          {coord: ['Feb',14.9]},
          {coord: ['Mar',7]},
          {coord: ['Apr',23.2]},
          {coord: ['May',25.6]},
        ]
      },
       markLine: {
        silent: true,
        // label: {show: false},
        // symbol:'diamond',
        // symbolSize: [45,10],
        // itemStyle: {
        //   borderColor: '#000'
        // },
        // data: [
        //   {coord: ['Jan',2]},
        //   {coord: ['Feb',14.9]},
        //   {coord: ['Mar',7]},
        //   {coord: ['Apr',23.2]},
        //   {coord: ['May',25.6]},
        // ]
      },
    },
  ]
};
option = {
title: {
text: 'Rainfall vs Evaporation',
subtext: 'Fake Data'
},
legend: {
data: ['Rainfall', 'Evaporation']
},
calculable: true,
xAxis: [
{
type: 'category',
// prettier-ignore
data: ['Jan', 'Feb', 'Mar', 'Apr', 'May', 'Jun', 'Jul', 'Aug', 'Sep', 'Oct', 'Nov', 'Dec']
}
],
yAxis: [
{
type: 'value'
}
],
series: [
{
name: 'Rainfall',
type: 'bar',
data: [
2.0,14.9, 7.0, 23.2, 25.6, 76.7, 135.6, 162.2, 32.6, 20.0, 6.4, 13.3
],
markPoint: {
silent: true,
label: {show: false},
symbol:'diamond',
symbolSize: [45,10],
itemStyle: {
borderColor: '#000'
},
data: [
{coord: ['Jan',2]},
{coord: ['Feb',14.9]},
{coord: ['Mar',7]},
{coord: ['Apr',23.2]},
{coord: ['May',25.6]},
]
},
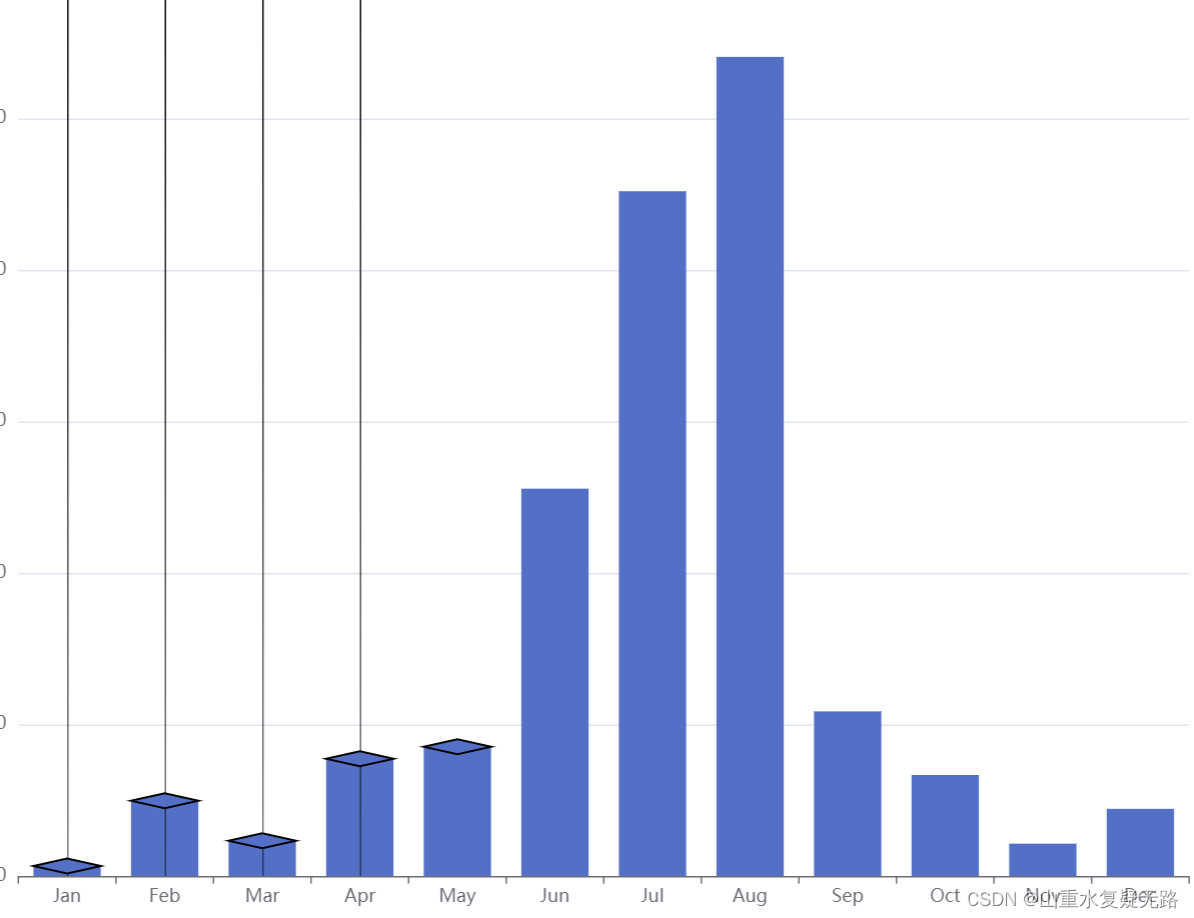
markLine: {
silent: true,
label: {show: false},
symbol: 'none',
lineStyle: {
type: 'solid',
color: new echarts.graphic.LinearGradient(
0, 0, 0, 1,
[
{offset: 0, color: 'rgba(0, 0, 0,1)'},
{offset: 1, color: 'rgba(0, 0, 0,0.5)'}
]
)
},
data: [{xAxis: 'Jan' },{xAxis: 'Feb' },{xAxis: 'Mar' },{xAxis: 'Apr' },]
}
},
]
};


 1552
1552


 被折叠的 条评论
为什么被折叠?
被折叠的 条评论
为什么被折叠?
 到【灌水乐园】发言


