


使用的技术
爬虫:BeautifulSoup4
数据处理及可视化:matplotlib,pandas,numpy
地图显示:高德地图API,jquery
效果
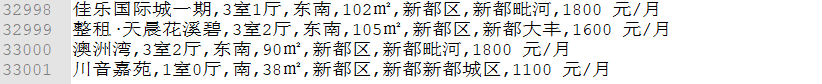
爬取数据3w余条(可以更多)
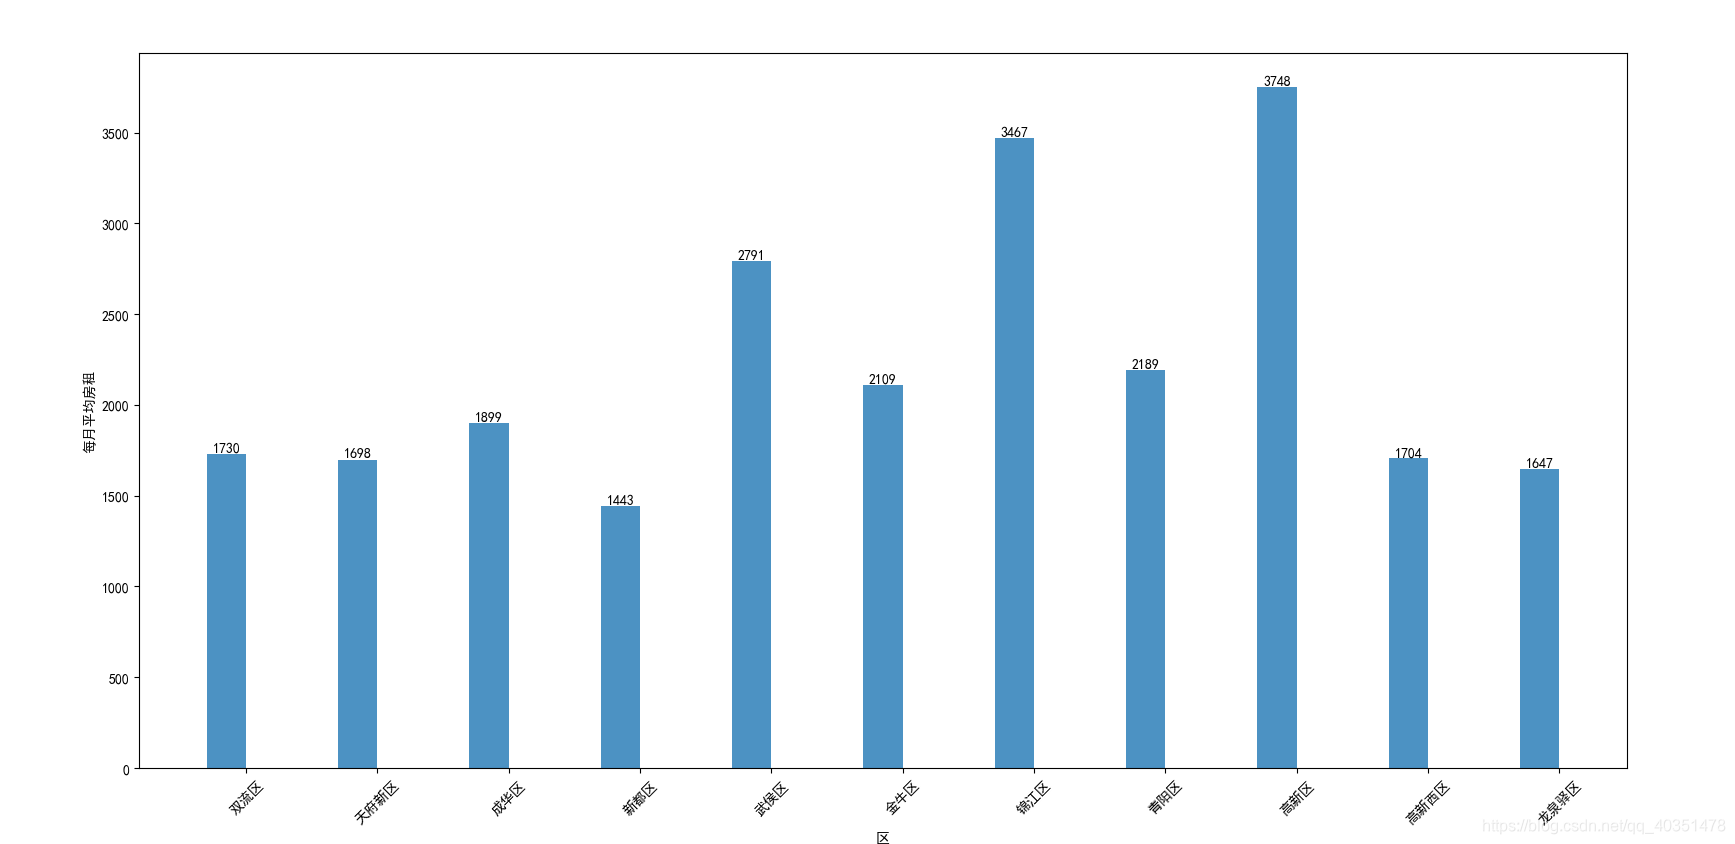
成都各区房租每月平均价钱,单位R
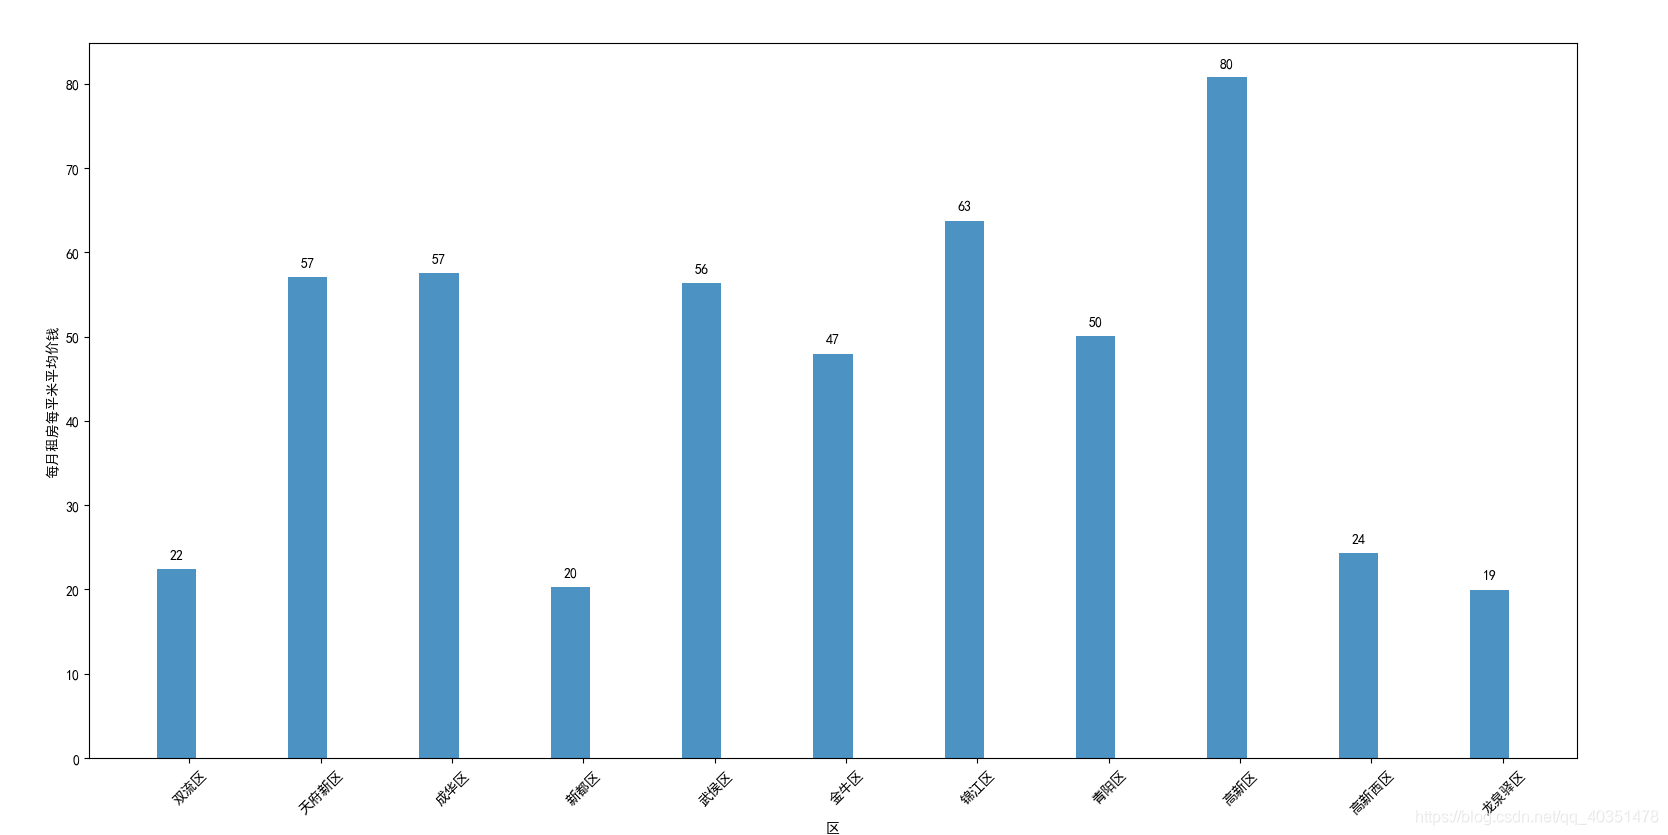
成都各区每月房租平均单价,单位R/m2
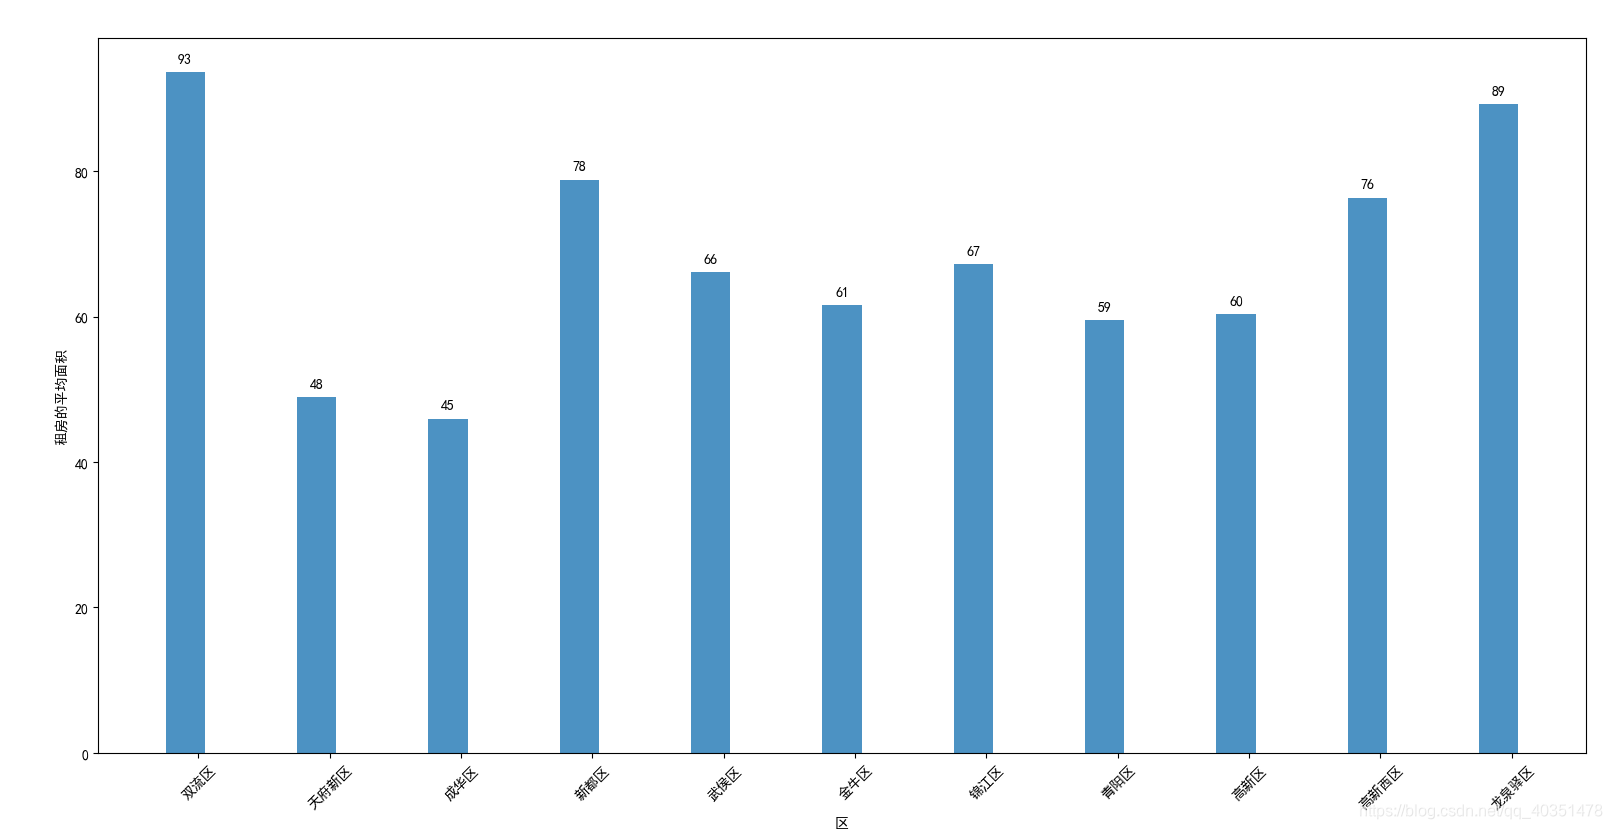
成都各区租房的平均面积:单位m2
利用高德API加载成都房源查找租房:
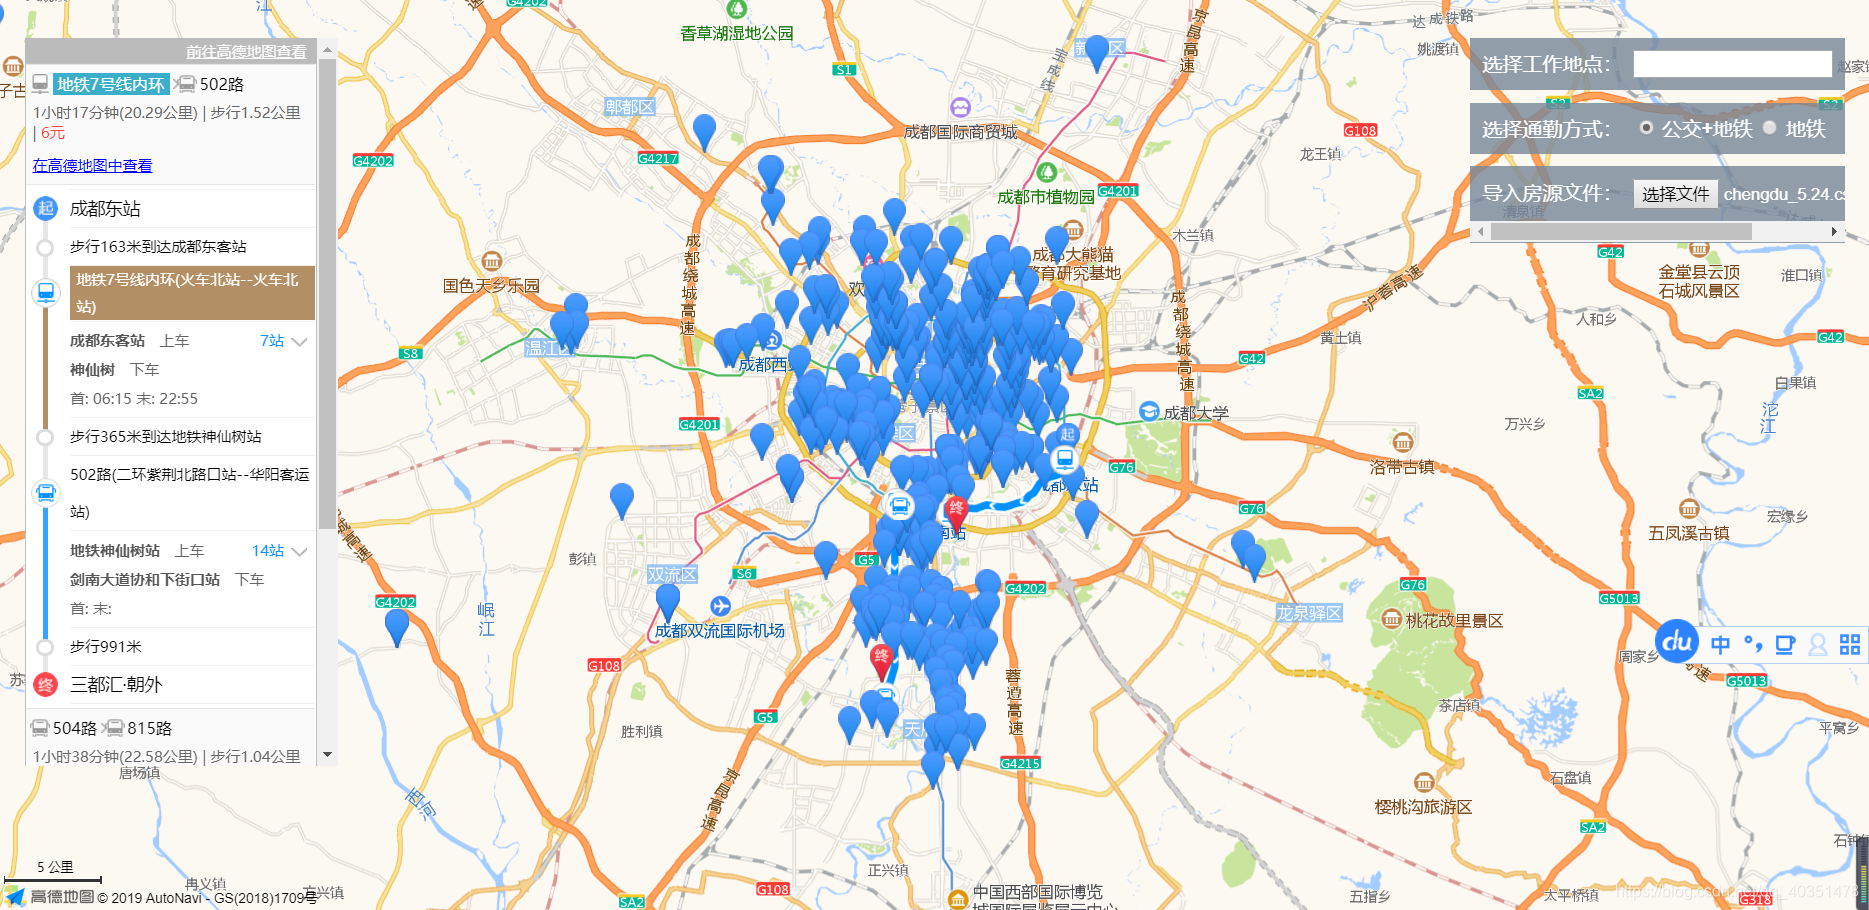
可以粗略看到成都房源大部分都在四环以内以及南边的高新区。
爬虫
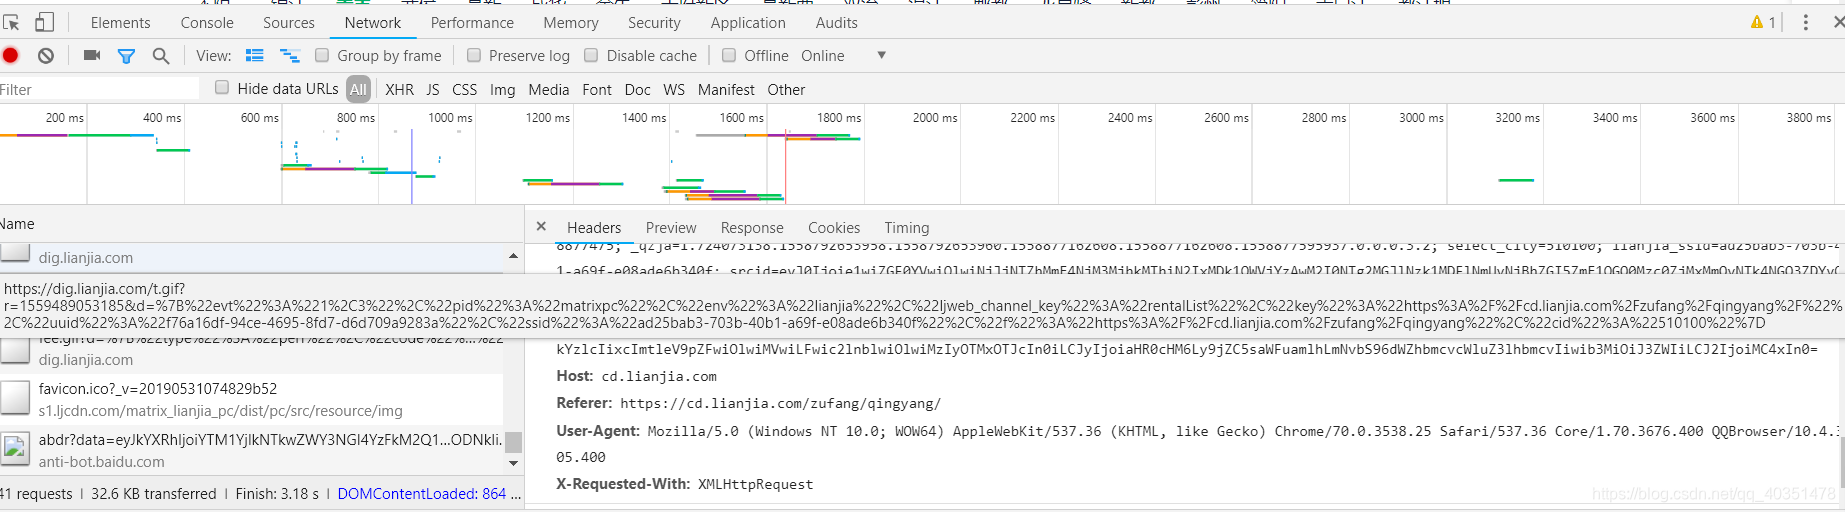
需要爬取的网页分析
爬取的是链家的数据,网页地址:https://cd.lianjia.com/zufang/jinjiang/
先要分析链家如何实现成都市各个区以及页数的拼接:

比如青羊区的第二页,地址是:https://cd.lianjia.com/zufang/qingyang/pg2
也就是说url=https://cd.lianjia.com/zufang+各个区的拼音+页数
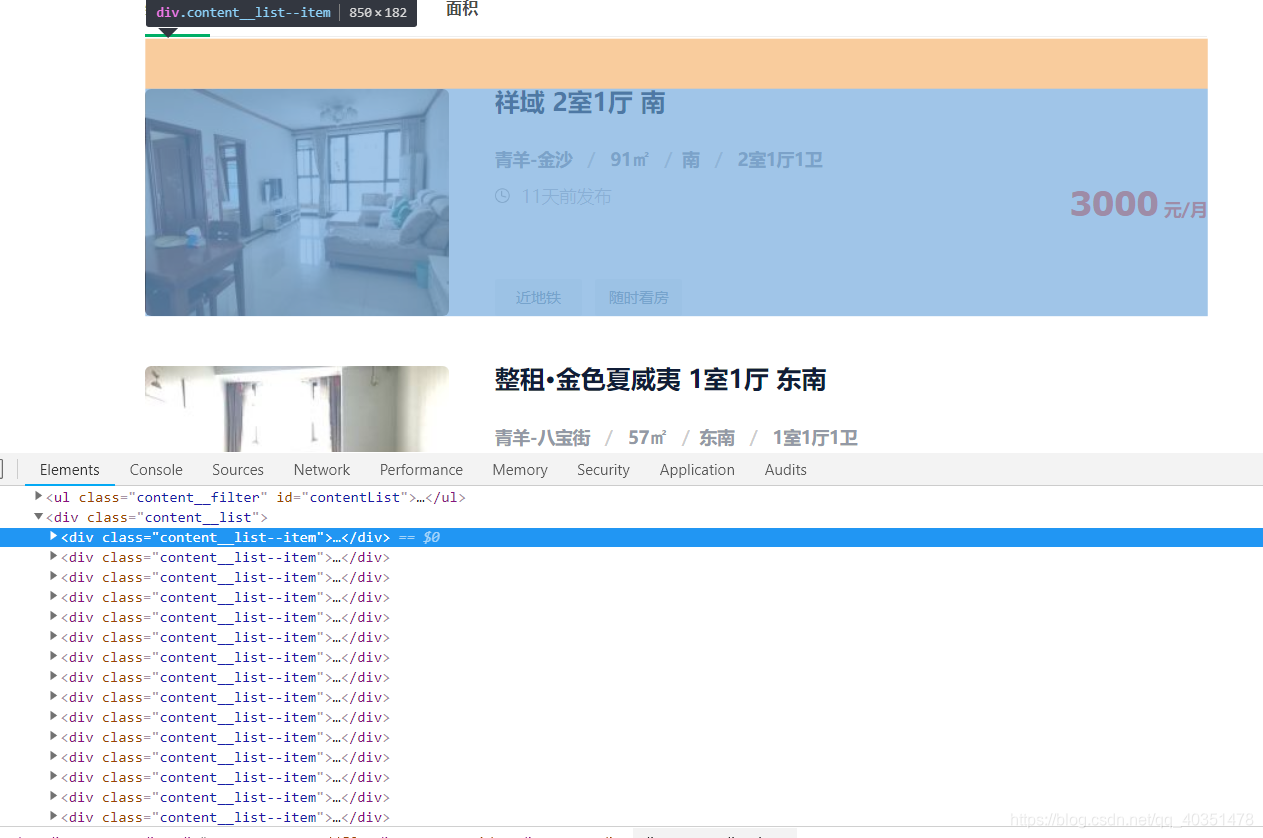
分析网页发现我们要爬取的数据都在class="content__list–item"的div中,我们可以先获取所有class="content__list–item"的div在,依次遍历获取每个div中的数据
爬虫源码
先上全部代码:
# -*- coding:utf-8 -*-

from bs4 import BeautifulSoup
from urllib.parse import urljoin
import requests
import csv
import time
import re
import string

csv_file = open("cdlianjia2.csv", "w", newline='')
csv_writer = csv.writer(csv_file, delimiter=',')

list=["jinjiang","qingyang","wuhou","gaoxin7","chenghua","jinniu","tianfuxinqu","gaoxinxi1","shuangliu","longquanyi","xindou"]

# 去掉所有的html标签
reg1 = re.compile("<[^>]*>")
reg2 = re.compile('</?w+[^>]*>')
def getdata():
    for q in range(len(list)):
        url = 'https://cd.lianjia.com/zufang/'
        url += list[q] + "/pg"
        for y in range(100):
            len_str=len(url)
            if y>0:
                url=url[0:len_str-1]
            yeshu = str(y+1)
            url+=yeshu
            headers={
            #     "User-Agent":"Mozilla/5.0 (Windows NT 10.0; WOW64; Trident/7.0; rv:11.0) like Gecko"
             "User-Agent": "Mozilla/5.0 (Windows NT 10.0; WOW64) AppleWebKit/537.36 (KHTML, like Gecko) Chrome/70.0.3538.25 Safari/537.36 Core/1.70.3676.400 QQBrowser/10.4.3505.400"
             }
            # url = 'https://cd.lianjia.com/zufang/jinjiang/pg1'
            response=requests.get(url,headers=headers)#,headers=headers#
            response.encoding=response.apparent_encoding
            p=[]
            soup=BeautifulSoup(response.text,'html.parser')# BeautifulSoup解析
            # text = soup.find("span",attrs={"class","content__list--item-price"})
            # print(text)
            totaldivlist=soup.find_all("div", attrs={"class","content__list--item"})#
            lenth=len(totaldivlist)
            for i in range(lenth):
                price_span=totaldivlist[i].find("span",attrs={"class","content__list--item-price"})
                #价钱
                price=price_span.text
                #房源名称和面向和户型
                tital_p = totaldivlist[i].find("p", attrs={"class", "content__list--item--title twoline"})
                a = tital_p.find("a")
                tital=a.text.split()
                #名称
                house_name=tital[0]
                #户型
                house_layout=tital[1]
                #面向
                if len(tital)>2:
                    house_direction=tital[2]
                else:
                    house_direction=''
                #地点
                address_p=totaldivlist[i].find("p", attrs={"class", "content__list--item--des"})
                address_a=address_p.find_all("a")
                #区
                if q==0:
                    area='锦江区'
                elif q==1:
                    area='青阳区'
                elif q==2:
                    area='武侯区'
                elif q==3:
                    area='高新区'
                elif q==4:
                    area='成华区'
                elif q==5:
                    area='金牛区'
                elif q==6:
                    area='天府新区'
                elif q==7:
                    area='高新西区'
                elif q==8:
                    area='双流区'
                elif q==9:
                    area='龙泉驿区'
                elif q==10:
                    area='新都区'
                #具体地点
                address=""
                for i in range(len(address_a)):
                     address+=address_a[i].text
                #房屋面积
                house_area_=address_p.text.split()
                house_area=house_area_[2]
                csv_writer.writerow([house_name, house_layout,house_direction, house_area,area, address,price])
            baibai_x=(y+1)*(101*(q+1))
            baifen_y=101*(101*(len(list)))
            print("爬取进度"+str(baibai_x/baifen_y))
if __name__ == '__main__':
    csv_writer.writerow(["房源名称", "户型", "面向", "面积","所属区","地址","价钱"])
    getdata()
爬虫使用的是bs4,官方文档:https://www.crummy.com/software/BeautifulSoup/bs4/doc/index.zh.html
简单来说bs4的使用:
第一步:导入from bs4 import BeautifulSoup 这个模块
from bs4 import BeautifulSoup
第二步:创建 Beautiful Soup 对象 soup = BeautifulSoup(html) ,至于如何获取headers,按F12,User-Agent便是我们需要的。
			response=requests.get(url,headers=headers)#,headers=headers
            response.encoding=response.apparent_encoding
            soup=BeautifulSoup(response.text,'html.parser')# BeautifulSoup解析
第三步使用各种选择器解析提取数据:
totaldivlist=soup.find_all("div", attrs={"class","content__list--item"})
存储数据是使用的csv
csv_file = open("cdlianjia.csv", "w", newline='')
csv_writer = csv.writer(csv_file, delimiter=',')
csv_writer.writerow([house_name, house_layout,house_direction, house_area,area, address,price])
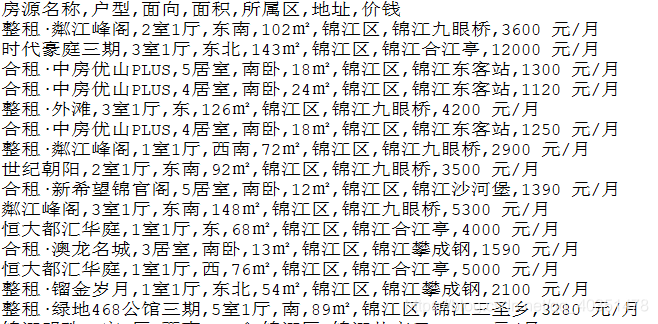
最后爬下来的数据长这样:
数据可视化
pandas官方文档:http://pandas.pydata.org/pandas-docs/stable/user_guide/visualization.html
matplotlib官方文档:
https://matplotlib.org/tutorials/introductory/usage.html#sphx-glr-tutorials-introductory-usage-py
数可视化首先要将爬取到的数据导入
Date = pd.read_csv('cdlianjia.csv')
使用pandas获取成都市各个区
areas = list(Date.groupby('所属区').size().index)
可视化全部代码:
import pandas as pd
import matplotlib.pyplot as plt
import matplotlib as mpl
import numpy as np
import re
mpl.rcParams['font.sans-serif']=['SimHei'] #指定默认字体 SimHei为黑体
mpl.rcParams['axes.unicode_minus']=False #用来正常显示负号
Date = pd.read_csv('cdlianjia2.csv')
# 获取所属区
areas = list(Date.groupby('所属区').size().index)
#每个区房租平均价钱
area_mean_price=[]
#每个区房屋平均面积
area_mean_house_area=[]
#每个区平均每平米房租价钱
area_mean_perhouseareaprice=[]
for area in areas:
    #获取当前区数据
    area_Data=Date.loc[Date['所属区']==area]
    #取出当前区所有房租数据
    price_=area_Data['价钱']
    #存取当前区房租的集合
    price_num_total=[]
    #存取当前区房租总价
    price_num_all=0
    for price in price_:
        price_num=re.sub("\D", "", price)
        price_num=int(price_num)
        if price_num<100000:#剔除反常数据
            price_num_total.append(price_num)
    for i in range(len(price_num_total)):
        price_num_all=price_num_all+price_num_total[i]
    #当前区房租平均价钱
    price_mean=price_num_all/len(price_num_total)
    #存入房租平均价钱
    area_mean_price.append(price_mean)
    #取出当前区所有房屋面积数据
    house_area_=area_Data['面积']
    #存放当前区房屋面积的集合
    house_area_total=[]
    #存放当前区房屋总面积
    house_area_all=0
    for housearea in house_area_:
        housearea_num=re.sub("\D", "", housearea)
        if housearea_num!='':
            housearea_num=int(housearea_num)
            if housearea_num<1000:#剔除异常数据
                house_area_total.append(housearea_num)
    for i in range(len(house_area_total)):
        house_area_all=house_area_all+house_area_total[i]
    #计算房钱区房屋平均面积
    house_area_mean=house_area_all/len(house_area_total)
    #存入
    area_mean_house_area.append(house_area_mean)
print(area_mean_price)
#第一张图
x = np.arange(len(areas))
width = 0.3
fig,ax = plt.subplots()
# plt.figure(figsize=(20,20))
# ax.bar(x,area_mean_price,width,alpha = 0.8)
plt.xticks(rotation=45)
ax.set_xticks(x +width/2)#将坐标设置在指定位置
ax.set_xticklabels(areas)#将横坐标替换成
plt.xlabel('区')
plt.ylabel('每月平均房租')
x = range(len(area_mean_price))
rects1 = plt.bar(x=x, height=area_mean_price, width=0.3, alpha=0.8)
for rect in rects1:
    height = rect.get_height()
    plt.text(rect.get_x() + rect.get_width() / 2, height + 1, str(int(height)), ha="center", va="bottom")
plt.show()
#第二张图
print(area_mean_house_area)
x = np.arange(len(areas))
width = 0.2
fig,ax = plt.subplots()
# ax.bar(x,area_mean_house_area,width,alpha = 0.8)
plt.xticks(rotation=45)
ax.set_xticks(x +width/2)#将坐标设置在指定位置
ax.set_xticklabels(areas)#将横坐标替换成
plt.xlabel('区')
plt.ylabel('租房的平均面积')
x = range(len(area_mean_house_area))
rects1 = plt.bar(x=x, height=area_mean_house_area, width=0.3, alpha=0.8)
for rect in rects1:
    height = rect.get_height()
    plt.text(rect.get_x() + rect.get_width() / 2, height + 1, str(int(height)), ha="center", va="bottom")
plt.show()
for area in areas:
    #获取当前区数据
    area_Data=Date.loc[Date['所属区']==area]
    #取出当前区所有房租数据
    price_=area_Data['价钱']
    # 取出当前区所有房屋面积数据
    house_area_ = area_Data['面积']
    #存放当前区平均每平米房租价钱
    area_mean_perhouseareaprice_=[]
    #存放当前区每平米房租总价钱
    area_mean_perhouseareaprice_all=0
    for price,housearea in zip(price_,house_area_):
        price_num=re.sub("\D", "", price)
        housearea_num = re.sub("\D", "", housearea)
        if housearea_num != '':
            housearea_num = int(housearea_num)
            price_num=int(price_num)
            if price_num<100000 and housearea_num<1000:
                area_mean_perhouseareaprice_.append(price_num/housearea_num)
    for i in range(len(area_mean_perhouseareaprice_)):
        area_mean_perhouseareaprice_all=area_mean_perhouseareaprice_all+area_mean_perhouseareaprice_[i]

    #计算
    area_mean_perhouseareaprice_mean=area_mean_perhouseareaprice_all/len(area_mean_perhouseareaprice_)
    #存入
    area_mean_perhouseareaprice.append(area_mean_perhouseareaprice_mean)
print(area_mean_perhouseareaprice)
print(area_mean_perhouseareaprice)
x = np.arange(len(areas))
width = 0.2
fig,ax = plt.subplots()
# ax.bar(x,area_mean_perhouseareaprice,width,alpha = 0.8)
plt.xticks(rotation=45)
ax.set_xticks(x +width/2)#将坐标设置在指定位置
ax.set_xticklabels(areas)#将横坐标替换成
plt.xlabel('区')
plt.ylabel('每月租房每平米平均价钱')
x = range(len(area_mean_perhouseareaprice))
rects1 = plt.bar(x=x, height=area_mean_perhouseareaprice, width=0.3, alpha=0.8)
for rect in rects1:
    height = rect.get_height()
    plt.text(rect.get_x() + rect.get_width() / 2, height + 1, str(int(height)), ha="center", va="bottom")
plt.show()
利用高德API查找租房
高德地图开发API:https://lbs.amap.com/api/javascript-api/guide/overlays/marker
需要导入的库:
  <link rel="stylesheet" href="http://cache.amap.com/lbs/static/main1119.css" />
    <link rel="stylesheet" href="http://cache.amap.com/lbs/static/jquery.range.css" />
    <script src="http://cache.amap.com/lbs/static/jquery-1.9.1.js"></script>
    <script src="http://cache.amap.com/lbs/static/es5.min.js"></script>
    <script src="http://webapi.amap.com/maps?v=1.3&key=yourkey"></script>
    <script src="http://cache.amap.com/lbs/static/jquery.range.js"></script>
页面css:
<style>
       .control-panel {
           position: absolute;
           top: 30px;
           right: 20px;
       }

       .control-entry {
           width: 280px;
           background-color: rgba(119, 136, 153, 0.8);
           font-family: fantasy, sans-serif;
           text-align: left;
           color: white;
           overflow: auto;
           padding: 10px;
           margin-bottom: 10px;
       }

       .control-input {
           margin-left: 120px;
       }

       .control-input input[type="text"] {
           width: 160px;
       }

       .control-panel label {
           float: left;
           width: 120px;
       }

       #transfer-panel {
           position: absolute;
           background-color: white;
           max-height: 80%;
           overflow-y: auto;
           top: 30px;
           left: 20px;
           width: 250px;
       }
   </style>
具体实现:
<body>
    <div id="container"></div>
    <div class="control-panel">
        <div class="control-entry">
            <label>选择工作地点:</label>
            <div class="control-input">
                <input id="work-location" type="text">
            </div>
        </div>
        <div class="control-entry">
            <label>选择通勤方式:</label>
            <div class="control-input">
                <input type="radio" name="vehicle" value="SUBWAY,BUS" onClick="takeBus(this)" checked/> 公交+地铁
                <input type="radio" name="vehicle" value="SUBWAY" onClick="takeSubway(this)" /> 地铁
            </div>
        </div>
        <div class="control-entry">
            <label>导入房源文件:</label>
            <div class="control-input">
                <input type="file" name="file" onChange="importRentInfo(this)" />
            </div>
        </div>
    </div>
    <div id="transfer-panel"></div>
    <script>
        var map = new AMap.Map("container", {
            resizeEnable: true,
            zoomEnable: true,
            <!--center: [116.397428, 39.90923], 北京-->
            <!-- center: [114.286453,30.618107], 武汉-->
            center: [104.067777,30.662956],<!--成都-->
            zoom: 11
        });

        var scale = new AMap.Scale();
        map.addControl(scale);
        //公交到达圈对象
        var arrivalRange = new AMap.ArrivalRange();
        //经度,纬度,时间(用不到),通勤方式(默认是地铁+公交)
        var x, y, t, vehicle = "SUBWAY,BUS";
        //工作地点,工作标记
        var workAddress, workMarker;
        //房源标记队列
        var rentMarkerArray = [];
        //多边形队列,存储公交到达的计算结果
        var polygonArray = [];
        //路径规划
        var amapTransfer;
        //信息窗体对象,点击房源点后出现
        var infoWindow = new AMap.InfoWindow({
            offset: new AMap.Pixel(0, -30)
        });

        var auto = new AMap.Autocomplete({
        //通过id指定输入元素
            input: "work-location"
        });
        //添加事件监听,在选择补完的地址后调用workLocationSelected
        AMap.event.addListener(auto, "select", workLocationSelected);

        //坐公交
        function takeBus(radio) {
            vehicle = radio.value;
            loadWorkLocation()
        }
        //坐地铁
        function takeSubway(radio) {
            vehicle = radio.value;
            loadWorkLocation()
        }
        //载入房源文件
        function importRentInfo(fileInfo) {
            var file = fileInfo.files[0].name;
            loadRentLocationByFile(file);
        }
        //清除已有标记
        function delRentLocation() {
            if (rentMarkerArray) map.remove(rentMarkerArray);
            rentMarkerArray = [];
        }
        //
        function loadRentLocationByFile(fileName) {
            //先删除现有的房源标记
            delRentLocation();
            //所有的地点都记录在集合中
            var rent_locations = new Set();
            $.get(fileName, function(data) {
                data = data.split("\n");
                data.forEach(function(item, index) {
                    rent_locations.add(item.split(",")[1]);
                });
                rent_locations.forEach(function(element, index) {
                     //加上房源标记
                    addMarkerByAddress(element);
                });
            });
        }
        //将所有的房源信息以点标记形式展现
        function addMarkerByAddress(address) {
            var geocoder = new AMap.Geocoder({
                city: "成都",
                radius: 1000
            });
            geocoder.getLocation(address, function(status, result) {
                if (status === "complete" && result.info === 'OK') {
                    var geocode = result.geocodes[0];
                    //点标记是用来标示某个位置点信息的一种地图要素,
                    rentMarker = new AMap.Marker({
                        map: map,
                        title: address,
                        icon: 'http://webapi.amap.com/theme/v1.3/markers/n/mark_b.png',
                        position: [geocode.location.getLng(), geocode.location.getLat()]
                    });
                    rentMarkerArray.push(rentMarker);

                    rentMarker.content = "<div>房源:<a target = '_blank' href='http://cd.58.com/pinpaigongyu/?key=" + address + "'>" + address + "</a><div>"
                    rentMarker.on('click', function(e) {
                        //设置信息体窗口信息
                        infoWindow.setContent(e.target.content);
                        infoWindow.open(map, e.target.getPosition());
                        //路线规划
                        if (amapTransfer) amapTransfer.clear();
                        //AMap.Transfer公交路线规划对象
                        amapTransfer = new AMap.Transfer({
                            map: map,
                            policy: AMap.TransferPolicy.LEAST_TIME,
                            city: "成都市",
                            panel: 'transfer-panel'
                        });
                        amapTransfer.search([{
                            keyword: workAddress
                        }, {
                            keyword: address
                        }], function(status, result) {})
                    });
                }
            })
        }
    </script>
</body>


 被折叠的 条评论
为什么被折叠?
被折叠的 条评论
为什么被折叠?
 到【灌水乐园】发言


