


文章目录
Nacos 2.X版本已有完善的监控体系,支持通过暴露metrics数据接入第三方监控系统监控Nacos运行状态,目前支持prometheus、elasticsearch和influxdb。下面重点介绍一下Nacos metrics每个指标含义。
第1章Prometheus采集Nacos metrics数据
前提条件:按照部署文档搭建好Nacos集群并配置application.properties文件,暴露metrics数据
management.endpoints.web.exposure.include=*
搭建Prometheus并修改配置文件prometheus.yml采集Nacos metrics数据
metrics_path: '/nacos/actuator/prometheus'
    static_configs:
      - targets: ['{ip1}:8848','{ip2}:8848','{ip3}:8848']
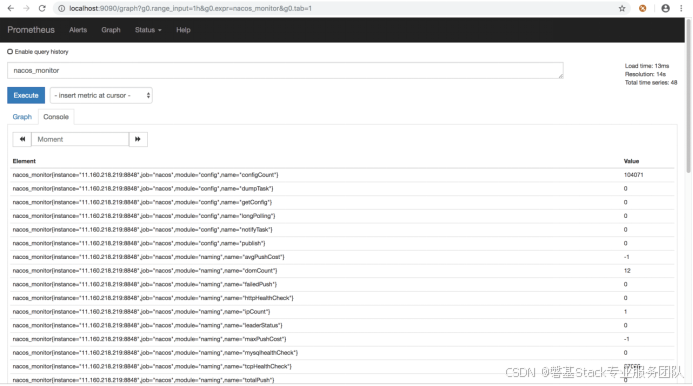
通过访问http://{ip}:9090/graph可以看到prometheus的采集数据,在搜索栏搜索nacos_monitor可以搜索到Nacos数据说明采集数据成功
第2章Nacos metrics含义
2.1 jvm metrics
| 指标 | 含义 |
|---|---|
| system_cpu_usage | CPU使用率 |
| system_load_average_1m | load |
| jvm_memory_used_bytes | 内存使用字节,包含各种内存区 |
| jvm_memory_max_bytes | 内存最大字节,包含各种内存区 |
| jvm_gc_pause_seconds_count | gc次数,包含各种gc |
| jvm_gc_pause_seconds_sum | gc耗时,包含各种gc |
| jvm_threads_daemon | 线程数 |
2.2Nacos 监控指标
| 指标 | 含义 |
|---|---|
| http_server_requests_seconds_count | http请求次数,包括多种(url,方法,code) |
| http_server_requests_seconds_sum | http请求总耗时,包括多种(url,方法,code) |
| nacos_timer_seconds_sum | Nacos config水平通知耗时 |
| nacos_timer_seconds_count | Nacos config水平通知次数 |
| nacos_monitor{name=‘longPolling’} | Nacos config长连接数 |
| nacos_monitor{name=‘configCount’} | Nacos config配置个数 |
| nacos_monitor{name=‘dumpTask’} | Nacos config配置落盘任务堆积数 |
| nacos_monitor{name=‘notifyTask’} | Nacos config配置水平通知任务堆积数 |
| nacos_monitor{name=‘getConfig’} | Nacos config读配置统计数 |
| nacos_monitor{name=‘publish’} | Nacos config写配置统计数 |
| nacos_monitor{name=‘ipCount’} | Nacos naming ip个数 |
| nacos_monitor{name=‘domCount’} | Nacos naming域名个数(1.x 版本) |
| nacos_monitor{name=‘serviceCount’} | Nacos naming域名个数(2.x 版本) |
| nacos_monitor{name=‘failedPush’} | Nacos naming推送失败数 |
| nacos_monitor{name=‘avgPushCost’} | Nacos naming平均推送耗时 |
| nacos_monitor{name=‘leaderStatus’} | Nacos naming角色状态 |
| nacos_monitor{name=‘maxPushCost’} | Nacos naming最大推送耗时 |
| nacos_monitor{name=‘mysqlhealthCheck’} | Nacos naming mysql健康检查次数 |
| nacos_monitor{name=‘httpHealthCheck’} | Nacos naming http健康检查次数 |
2.3nacos 异常指标
| 指标 | 含义 |
|---|---|
| nacos_exception_total{name=‘db’} | 数据库异常 |
| nacos_exception_total{name=‘configNotify’} | Nacos config水平通知失败 |
| nacos_exception_total{name=‘unhealth’} | Nacos config server之间健康检查异常 |
| nacos_exception_total{name=‘disk’} | Nacos naming写磁盘异常 |
| nacos_exception_total{name=‘leaderSendBeatFailed’} | Nacos naming leader发送心跳异常 |
| nacos_exception_total{name=‘illegalArgument’} | 请求参数不合法 |
| nacos_exception_total{name=‘nacos’} | Nacos请求响应内部错误异常(读写失败,没权限,参数错误) |
2.4client metrics
| 指标 | 含义 |
|---|---|
| nacos_monitor{name=‘subServiceCount’} | 订阅的服务数 |
| nacos_monitor{name=‘pubServiceCount’} | 发布的服务数 |
| nacos_monitor{name=‘configListenSize’} | 监听的配置数 |
| nacos_client_request_seconds_count | 请求的次数,包括多种(url,方法,code) |
| nacos_client_request_seconds_sum | 请求的总耗时,包括多种(url,方法,code) |


 658
658

 被折叠的 条评论
为什么被折叠?
被折叠的 条评论
为什么被折叠?
 到【灌水乐园】发言


