


#作者:程宏斌
1、fluent-bit
Fluent Bit 官方镜像本身就支持导出 Prometheus 指标能力,只需要按需开放即可。
方法一:HTTP Server 导出
详细配置如下:
[SERVICE]
HTTP_Server On # 若存在 HTTP_Server,但状态为Off,改为On
HTTP_Listen 0.0.0.0
HTTP_PORT 2020 # 端口可自行调整
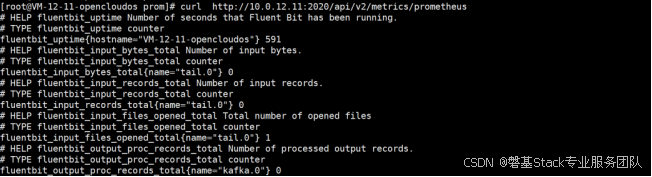
Prometheus 指标导出验证:
curl http://10.0.12.11:2020/api/v2/metrics/prometheus
方法一监控数据抓取配置:(prometheus)
- job_name: ‘fluent-bit’
metrics_path: /api/v2/metrics/prometheus
static_configs:- targets: [‘10.0.12.11:2020’]
方法二:Fluent Bit Metrics 导出
在Fluent Bit配置中添加如下配置:
[INPUT]
    name          fluentbit_metrics
    tag             internal_metrics
    scrape_interval 2
[OUTPUT]
    name            prometheus_exporter
    match           internal_metrics
    host            0.0.0.0
port            2021
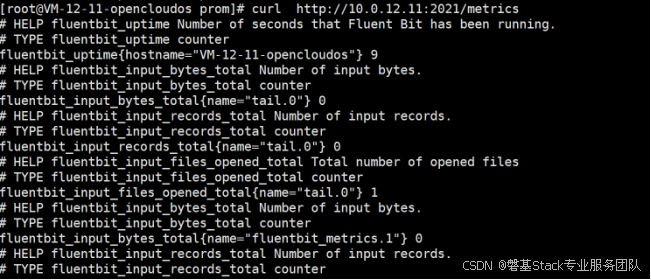
Prometheus 指标导出验证:
curl http://10.0.12.11:2021/metrics
要让 Prometheus 抓取 Fluent Bit 的指标,需要在 Prometheus 的配置文件 prometheus.yml 中添加一个抓取配置(scrape configuration)
方法二监控数据抓取配置:(prometheus)
  - job_name: 'fluent-bit'
    metrics_path: /metrics
    static_configs:
      - targets: ['10.0.12.11:2021']
监控指标
| 组件 | 监控项名称 | 指标英文名称 | 阈值说明 |
|---|---|---|---|
| Fluent-bit | 内存缓冲区的使用量 | fluentbit_input_storage_memory_bytes | > storage.backlog.mem_limit配置的一半 紧急 |
| Fluent-bit | 每个输出插件处理错误的次数 | fluentbit_output_errors_total | > 5 严重 |
| Fluent-bit | 缓冲区的可用容量 | fluentbit_output_chunk_available_capacity_percent | >70% 紧急 |
| Fluent-bit | 输入插件是否正常输入 | fluentbit_input_ingestion_paused | =!0 紧急 |
| Fluent-bit | 每个输出插件成功处理的日志总字节数 | fluentbit_output_proc_bytes_total | |
| Fluent-bit | 每个输入插件处理的总字节数 | fluentbit_input_bytes_total |
2、fluentd
插件安装
安装fluent-plugin-prometheus:
fluent-gem install fluent-plugin-prometheus
对于td-agent,使用td-agent-gem安装:
sudo td-agent-gem install fluent-plugin-prometheus
数据采集
为了向 Prometheus 公开 Fluentd 指标,我们需要配置三个部分:
步骤 1:使用 Prometheus Filter 插件统计传入记录
步骤2:使用Prometheus输出插件统计传出记录
步骤 3:通过 HTTP 使用 Prometheus 输入插件公开指标
步骤 1:使用 Prometheus Filter 插件统计传入记录
配置该部分以计算每个标签的传入记录:
# source
<source>
  @type forward
  bind 0.0.0.0
  port 24224
</source>

# count the number of incoming records per tag
<filter company.*> #tag
  @type prometheus
  <metric>
    name Fluentd_input_status_num_records_total
    type counter
    desc The total number of incoming records
    <labels>
      tag ${tag}
      hostname ${hostname}
    </labels>
  </metric>
</filter>
通过此配置,prometheus过滤器插件会在记录进入时开始添加内部计数器。
步骤2:使用Prometheus输出插件统计传出记录
copy使用输出插件配置插件prometheus来计算每个标签的传出记录:
# count the number of outgoing records per tag
<match company.*> #tag
  @type copy
  <store>
    @type forward
    <server>
      name myserver1
      host 192.168.1.3
      port 24224
      weight 60
    </server>
  </store>

  <store>
    @type prometheus
    <metric>
      name Fluentd_output_status_num_records_total
      type counter
      desc The total number of outgoing records
      <labels>
        tag ${tag}
        hostname ${hostname}
      </labels>
    </metric>
  </store>
</match>
通过此配置,prometheus输出插件会在记录发出时开始添加内部计数器。
步骤 3:通过 HTTP 使用 Prometheus 输入插件公开指标
配置prometheus输入插件以通过 HTTP 公开内部计数器信息:
# expose metrics in prometheus format
<source>
  @type prometheus
  bind 0.0.0.0
  port 24231
  metrics_path /metrics
</source>
<source>
  @type prometheus_output_monitor
  interval 10
  <labels>
    hostname ${hostname}
  </labels>
</source>
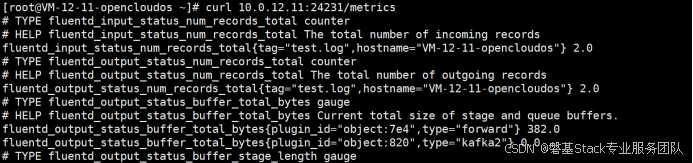
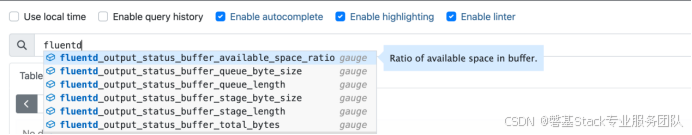
我们让Fluentd正常采集发送一些日志之后,访问http://localhost:24231/metrics接收指标:
prometheus配置
  - job_name: 'Fluentd'
    metrics_path: /metrics
    static_configs:
      - targets: ['192.168.1.100:24231']


 338
338

 被折叠的 条评论
为什么被折叠?
被折叠的 条评论
为什么被折叠?
 到【灌水乐园】发言


