


Echart 5+ 修改了引用方式,具体参考官网,在项目中引入 Apache ECharts
// 引入 echarts 核心模块,核心模块提供了 echarts 使用必须要的接口。
import * as echarts from "echarts/core";
// 引入柱状图图表,图表后缀都为 Chart
import { BarChart, LineChart, FunnelChart, PieChart } from "echarts/charts";
// 引入提示框,标题,直角坐标系,数据集,内置数据转换器组件,组件后缀都为 Component
import {
  TitleComponent,
  TooltipComponent,
  GridComponent,
  LegendComponent,
  DatasetComponent,
  TransformComponent,
} from "echarts/components";
// 标签自动布局、全局过渡动画等特性
import { LabelLayout, UniversalTransition } from "echarts/features";
// 引入 Canvas 渲染器,注意引入 CanvasRenderer 或者 SVGRenderer 是必须的一步
import { CanvasRenderer } from "echarts/renderers";

// 注册必须的组件
const charts = echarts;
charts.use([
  TitleComponent,
  TooltipComponent,
  GridComponent,
  LegendComponent,
  DatasetComponent,
  TransformComponent,
  BarChart,
  LineChart,
  FunnelChart,
  PieChart,
  LabelLayout,
  UniversalTransition,
  CanvasRenderer,
]);

export default charts;
在需要使用的地方引入 下面以Vue3为例
import echarts from '@/utils/echarts';
import { onMounted, nextTick } from 'vue'
onMounted(() => { bar1() })
const bar1 = () => {
// 1实例化对象
let myChart = echarts.init(document.querySelector("#table")!);
// 2. 指定配置项和数据
let option = {
color: ['#80FFA5', '#00DDFF', '#37A2FF', '#FF0087', '#FFBF00'],
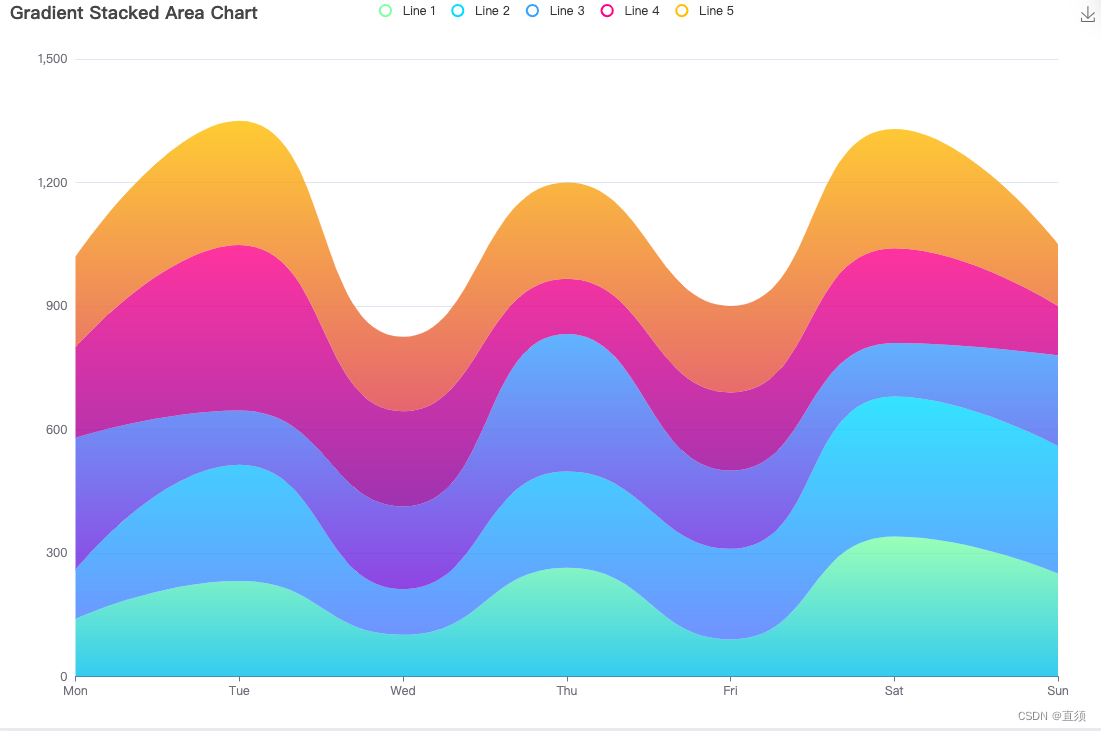
title: {
text: 'Gradient Stacked Area Chart'
},
tooltip: {
trigger: 'axis',
axisPointer: {
type: 'cross',
label: {
backgroundColor: '#6a7985'
}
}
},
legend: {
data: ['Line 1', 'Line 2', 'Line 3', 'Line 4', 'Line 5']
},
toolbox: {
feature: {
saveAsImage: {}
}
},
grid: {
left: '3%',
right: '4%',
bottom: '3%',
containLabel: true
},
xAxis: [
{
type: 'category',
boundaryGap: false,
data: ['Mon', 'Tue', 'Wed', 'Thu', 'Fri', 'Sat', 'Sun']
}
],
yAxis: [
{
type: 'value'
}
],
series: [
{
name: 'Line 1',
type: 'line',
stack: 'Total',
smooth: true,
lineStyle: {
width: 0
},
showSymbol: false,
areaStyle: {
opacity: 0.8,
color: new echarts.graphic.LinearGradient(0, 0, 0, 1, [
{
offset: 0,
color: 'rgb(128, 255, 165)'
},
{
offset: 1,
color: 'rgb(1, 191, 236)'
}
])
},
emphasis: {
focus: 'series'
},
data: [140, 232, 101, 264, 90, 340, 250]
},
{
name: 'Line 2',
type: 'line',
stack: 'Total',
smooth: true,
lineStyle: {
width: 0
},
showSymbol: false,
areaStyle: {
opacity: 0.8,
color: new echarts.graphic.LinearGradient(0, 0, 0, 1, [
{
offset: 0,
color: 'rgb(0, 221, 255)'
},
{
offset: 1,
color: 'rgb(77, 119, 255)'
}
])
},
emphasis: {
focus: 'series'
},
data: [120, 282, 111, 234, 220, 340, 310]
},
{
name: 'Line 3',
type: 'line',
stack: 'Total',
smooth: true,
lineStyle: {
width: 0
},
showSymbol: false,
areaStyle: {
opacity: 0.8,
color: new echarts.graphic.LinearGradient(0, 0, 0, 1, [
{
offset: 0,
color: 'rgb(55, 162, 255)'
},
{
offset: 1,
color: 'rgb(116, 21, 219)'
}
])
},
emphasis: {
focus: 'series'
},
data: [320, 132, 201, 334, 190, 130, 220]
},
{
name: 'Line 4',
type: 'line',
stack: 'Total',
smooth: true,
lineStyle: {
width: 0
},
showSymbol: false,
areaStyle: {
opacity: 0.8,
color: new echarts.graphic.LinearGradient(0, 0, 0, 1, [
{
offset: 0,
color: 'rgb(255, 0, 135)'
},
{
offset: 1,
color: 'rgb(135, 0, 157)'
}
])
},
emphasis: {
focus: 'series'
},
data: [220, 402, 231, 134, 190, 230, 120]
},
{
name: 'Line 5',
type: 'line',
stack: 'Total',
smooth: true,
lineStyle: {
width: 0
},
showSymbol: false,
label: {
show: true,
position: 'top'
},
areaStyle: {
opacity: 0.8,
color: new echarts.graphic.LinearGradient(0, 0, 0, 1, [
{
offset: 0,
color: 'rgb(255, 191, 0)'
},
{
offset: 1,
color: 'rgb(224, 62, 76)'
}
])
},
emphasis: {
focus: 'series'
},
data: [220, 302, 181, 234, 210, 290, 150]
}
]
};
// 3. 把配置项给实例对象
myChart.setOption(option);
window.onresize = function () {
myChart.resize();
};
}
完成


 5336
5336


 被折叠的 条评论
为什么被折叠?
被折叠的 条评论
为什么被折叠?
 到【灌水乐园】发言


