chart1() {
let chart = document.getElementById('chart1');
let myChar = echarts.init(chart);
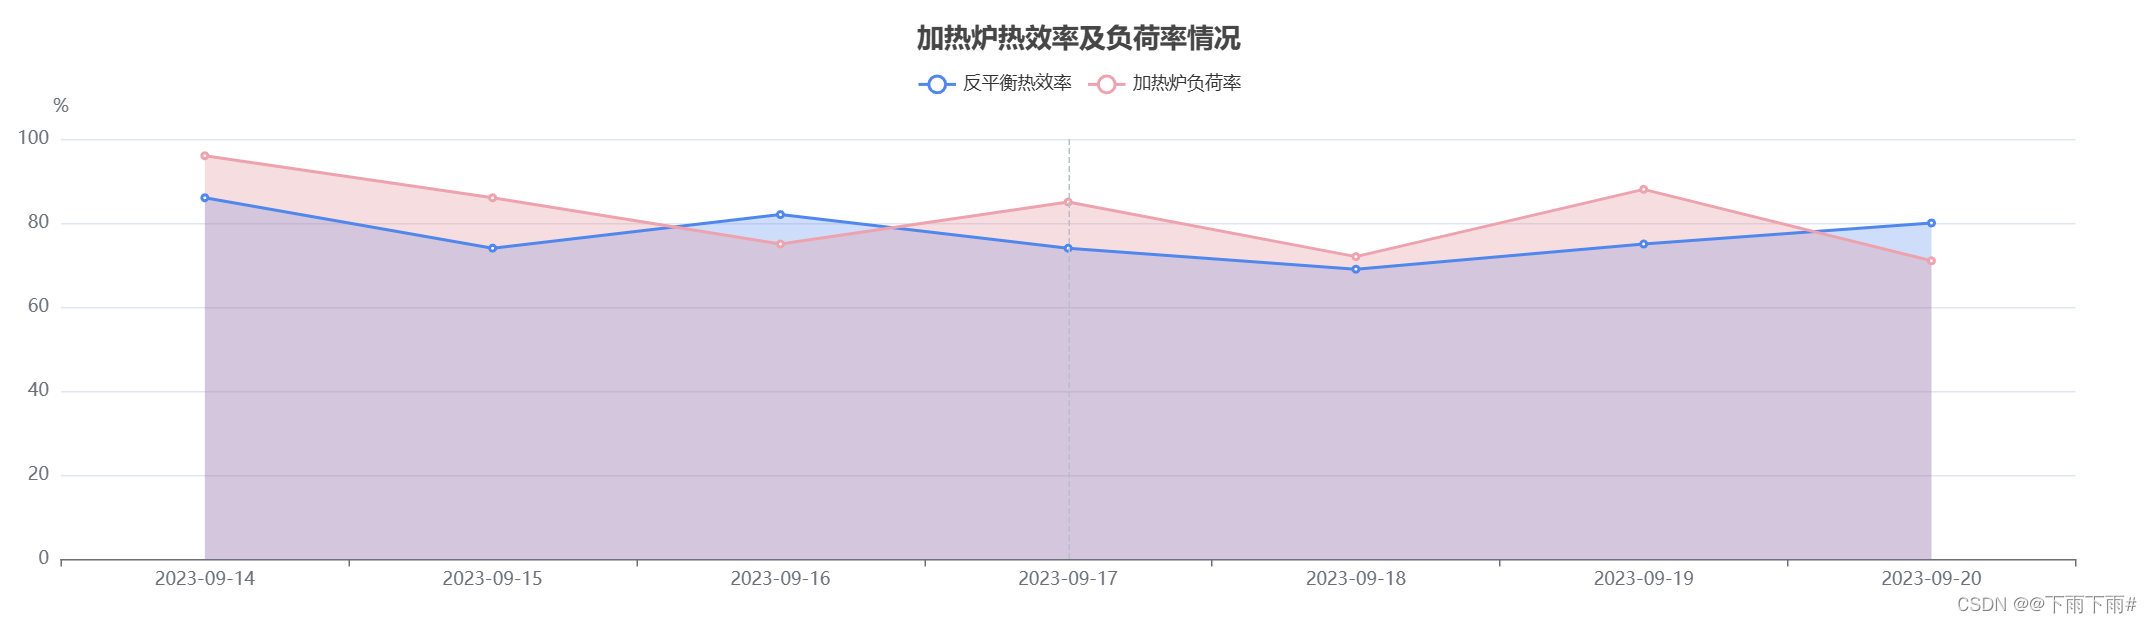
let dataX = ['2023-09-14', '2023-09-15', '2023-09-16', '2023-09-17', '2023-09-18', '2023-09-19', '2023-09-20']
let dataY1 = [86, 74, 82, 74, 69, 75, 80];
let dataY2 = [96, 86, 75, 85, 72, 88, 71];
let option;
option = {
color: ['#5087EC', '#EDA2AE'],
title: {
left: 'center',
text: '加热炉热效率及负荷率情况'
},
legend: {
data: ['反平衡热效率', '加热炉负荷率'],
top: "8%",
},
tooltip: {
trigger: 'axis'
},
grid: {
left: '3%',
right: '4%',
top: '20%',
bottom: 40,
},
xAxis: {
type: 'category',
data: dataX
},
yAxis: {
type: 'value',
name: '%'
},
series: [
{
name: '反平衡热效率',
data: dataY1,
type: 'line',
areaStyle: {
color: "rgba(80,135,236, 0.4)"
}
},
{
name: '加热炉负荷率',
data: dataY2,
type: 'line',
areaStyle: {
color: "rgba(222,134,143, 0.4)"
}
},
]
};
myChar.clear();
myChar.setOption(option);
myChar.resize();
window.addEventListener("resize", () => {
myChar.resize();
});
}


 1928
1928


 被折叠的 条评论
为什么被折叠?
被折叠的 条评论
为什么被折叠?
 到【灌水乐园】发言


