


这篇文章,分享下我对openlayers的一些经验和理解,会夹杂大量搜索出来得文档,是我正式使用时可以实现的,废话不多说,我们从下载开始

一,openlayers安装且初始化地图
创建vue项目就省略了,OpenLayers通过NPM 安装
npm install ol -S
Vue页面
OpenLayers 加载地图可以加载离线地图,也可以下载离线瓦片地图加载,
地图相关配置,我放在data中,以便后面动态改变。(底图我用的是天地图,如果想测试,可以用第二段的默认地图地图)
原文档链接
1. 效果图
通过 addLayer 添加图层,通过removeLayer 删除图层
2. html(创建 checkbox 用来切换图层)
<template>
    <div id="content">
        <div id="map" ref="map"></div>
        <div id="mouse-position">
            <el-checkbox-group v-model="checkList">
                <el-checkbox label="天地图影像图" @change="changImage"></el-checkbox>
                <el-checkbox label="天地图影像标注" @change="changText"></el-checkbox>
            </el-checkbox-group>
        </div>
    </div>
</template>
3. js (通过map.addLayer 实现)
<script>
import "ol/ol.css";
import { Map, View } from "ol";
import TileLayer from "ol/layer/Tile";
import OSM from "ol/source/OSM";
import XYZ from "ol/source/XYZ";
import { fromLonLat } from "ol/proj";

export default {
    name: "tree",
    data() {
        return {
            map: null,
            checkList: []
        };
    },
    methods: {
        // 初始化一个 openlayers 地图
        initMap() {
            let target = "map";
            let tileLayer = [
                new TileLayer({
                    source: new XYZ({
                        url:
                            "http://map.geoq.cn/ArcGIS/rest/services/ChinaOnlineStreetPurplishBlue/MapServer/tile/{z}/{y}/{x}"
                    })
                })
            ];
            let view = new View({
                center: fromLonLat([104.912777, 34.730746]),
                zoom: 4.5
            });
            this.map = new Map({
                target: target,
                layers: tileLayer,
                view: view
            });
        },
        // 天地图影像图层
        changImage: function(checked, e) {
            if (checked) {
                this.TiandiMap_img = new TileLayer({
                    name: "天地图影像图层",
                    source: new XYZ({
                        url:
                            "http://t0.tianditu.com/DataServer?T=img_w&x={x}&y={y}&l={z}&tk=5d27dc75ca0c3bdf34f657ffe1e9881d", //parent.TiandituKey()为天地图密钥
                        wrapX: false
                    })
                });
                // 添加到地图上
                this.map.addLayer(this.TiandiMap_img);
            } else {
                this.map.removeLayer(this.TiandiMap_img);
            }
        },
        // 天地图影像注记图层
        changText: function(checked, e) {
            if (checked) {
                this.TiandiMap_cia = new TileLayer({
                    name: "天地图影像注记图层",
                    source: new XYZ({
                        url:
                            "http://t0.tianditu.com/DataServer?T=cia_w&x={x}&y={y}&l={z}&tk=5d27dc75ca0c3bdf34f657ffe1e9881d", //parent.TiandituKey()为天地图密钥
                        wrapX: false
                    })
                });
                // 添加到地图上
                this.map.addLayer(this.TiandiMap_cia);
            } else {
                this.map.removeLayer(this.TiandiMap_cia);
            }
        }
    },
    mounted() {
        this.initMap();
    }
};
4. css 样式
<style lang="scss" scoped>
html,
body {
    height: 100%;
    #content {
        width: 100%;
        position: relative;
        #mouse-position {
            float: left;
            position: absolute;
            top: 75px;
            right: 10px;
            width: 200px;
            height: 50px;
            padding: 10px;
            background-color: rgba(0, 0, 0, 0.6);
            /*在地图容器中的层,要设置z-index的值让其显示在地图上层*/
            z-index: 2000;
            color: white;
            .el-checkbox {
                color: white;
            }
            /* 鼠标位置信息自定义样式设置 */
            .custom-mouse-position {
                color: rgb(0, 0, 0);
                font-size: 16px;
                font-family: "微软雅黑";
            }
        }
    }
}
</style>
二,openlayers 添加图片到地图上
原文档链接
首先初始化图片图层:
initImageLayer: function (extent) {
        this.imageLayer = new ol.layer.Image({
            // source: this.imageSource
        })
        this.map.addLayer(this.imageLayer);
    },
然后添加图片:
addImage: function (extent, url) {
        var imageExtent = extent;//左下角右上角[113, 30.2, 115, 32.2]
        this.imageSource = new ol.source.ImageStatic({
            url: url,
            projection: 'EPSG:3857',
            imageExtent: ol.proj.transformExtent(imageExtent, 'EPSG:4326', 'EPSG:3857')
        })
        this.imageLayer.setSource(this.imageSource);
    }
三,openlayers 添加Polygon区域分类
原文档链接
地图遮罩通常用来突出显示某一块特定区域,先来看下效果。(中间带白边的为遮罩层)
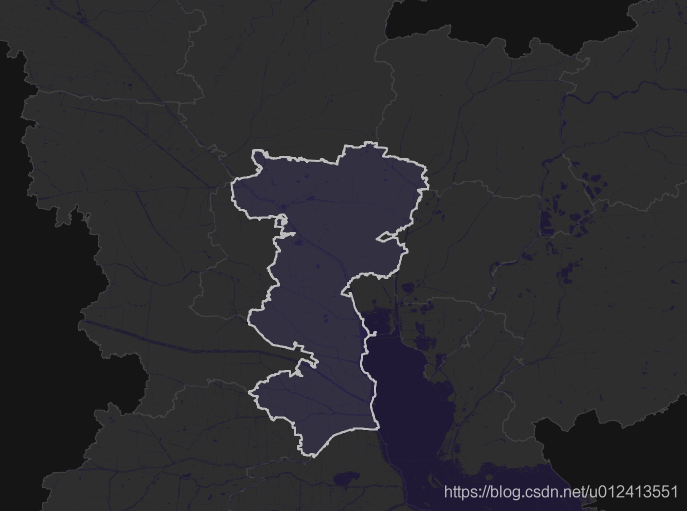
原理:在原地图上增加一个矢量图层,在图层中添加一个面要素,并对面要素使用半透明的样式。
var map,baseLayer;

//定义图层样式
var mystyle = new ol.style.fill({
    fill: new ol.style.Fill({
        color:"rgba(72,61,139, 0.2)",//重点在这里,采用rgba颜色,最后一个值用来表示透明度
    }),
    stroke: new ol.style.Stroke({
        color:"#BDBDBD",
        width:2
    })
})
var vectorSource = new ol.source.Vector();
var vectorLayer = new ol.layer.Vector({
    source: vectorSource,
    style: mystyle
})

/**
 * 初始化地图
 */
function initMap(){
    baseLayer = new ol.layer.Tile({
        source: new ol.source.TileWMS({
            url: "http://localhost:8080/geoserver/china/wms",
            params:{
                'LAYERS': "china:baseMap;",
                'TILED': false
            },
        })
    });

    var view = new ol.View({
        center: [116.727085860608, 35.20619600133295],
        zoom:10.5,
        projection: "EPSG:4326"
    });

    map = new ol.Map({
        target: "map",
        view: view,
        layers:[baseLayer,vectorLayer]
    });
}

/**
 * 根据名称加载遮罩层
 * @param {*} name1
 */
function addCoverLayer(name1){
	//清除原来的要素
    vectorSource.clear();

    $.getJSON('/region.geojson',function(data){
        var features = (new ol.format.GeoJSON()).readFeatures(data);
        features.forEach(function(element) {
            //从数据中取出name字段值为name1的区域,进行加载
            if(element.get("name") === name1){
                vectorSource.addFeature(element);
            }
        });
    })
}
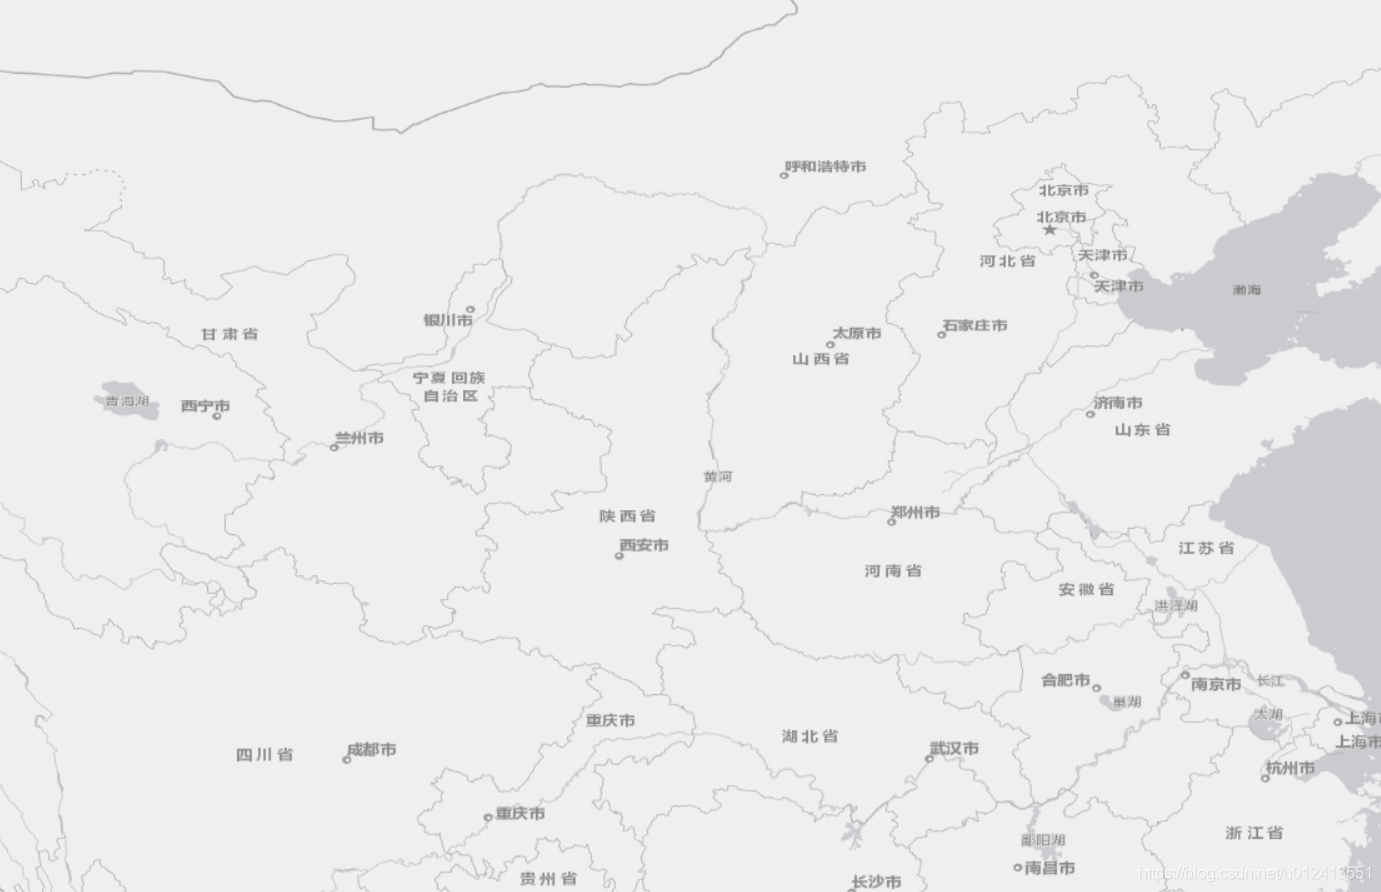
四,openlayers 添加Polygon区域动态遮罩,外部全黑,规定区域常亮
原文档链接
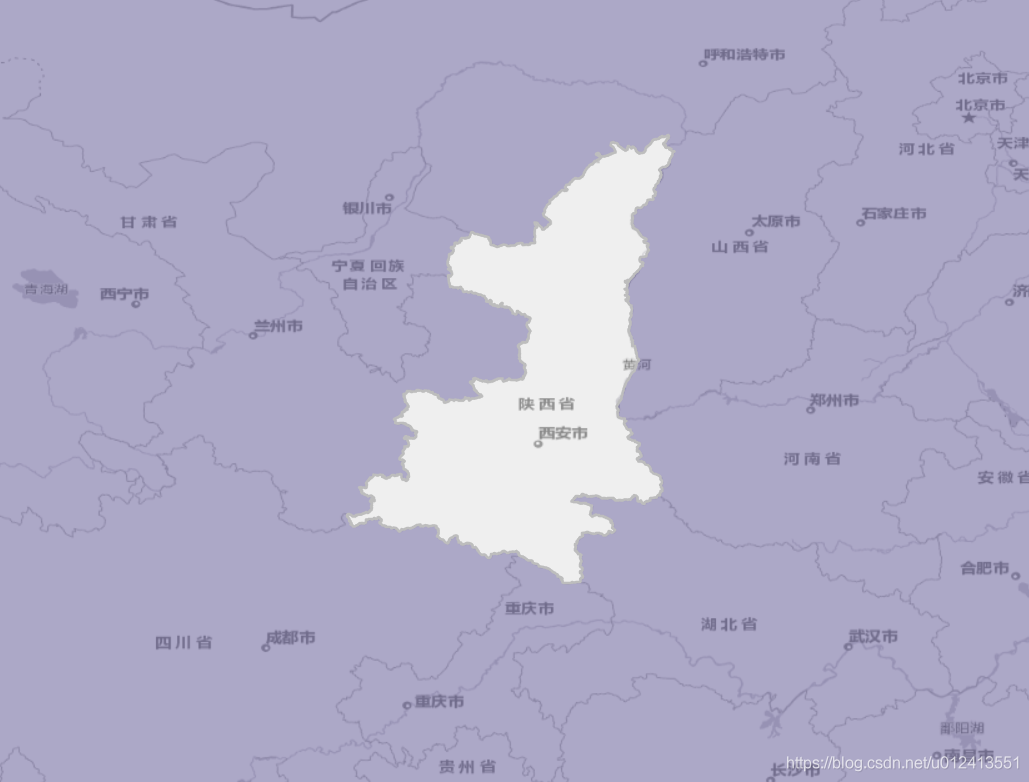
在深色背景的底图上,对要突出的区域采用半透明遮罩,以此来突出该区域。暂且称之为中心遮罩,遮罩前后对比如下图:
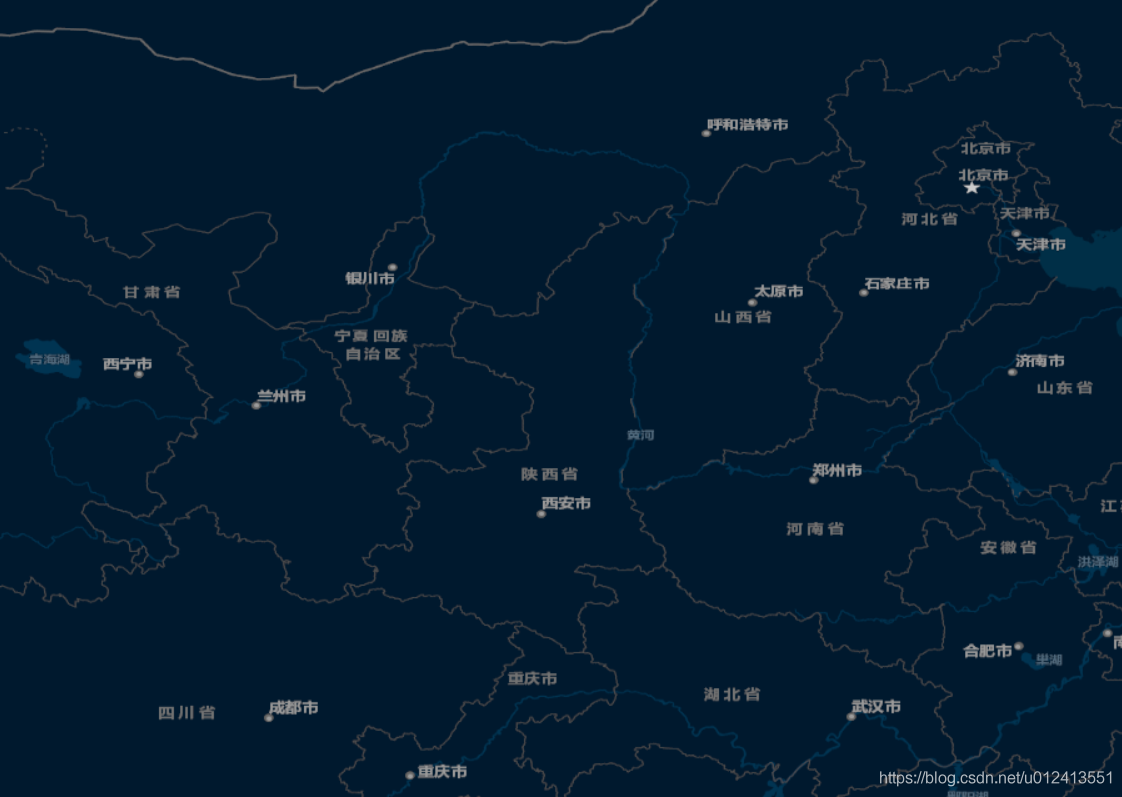
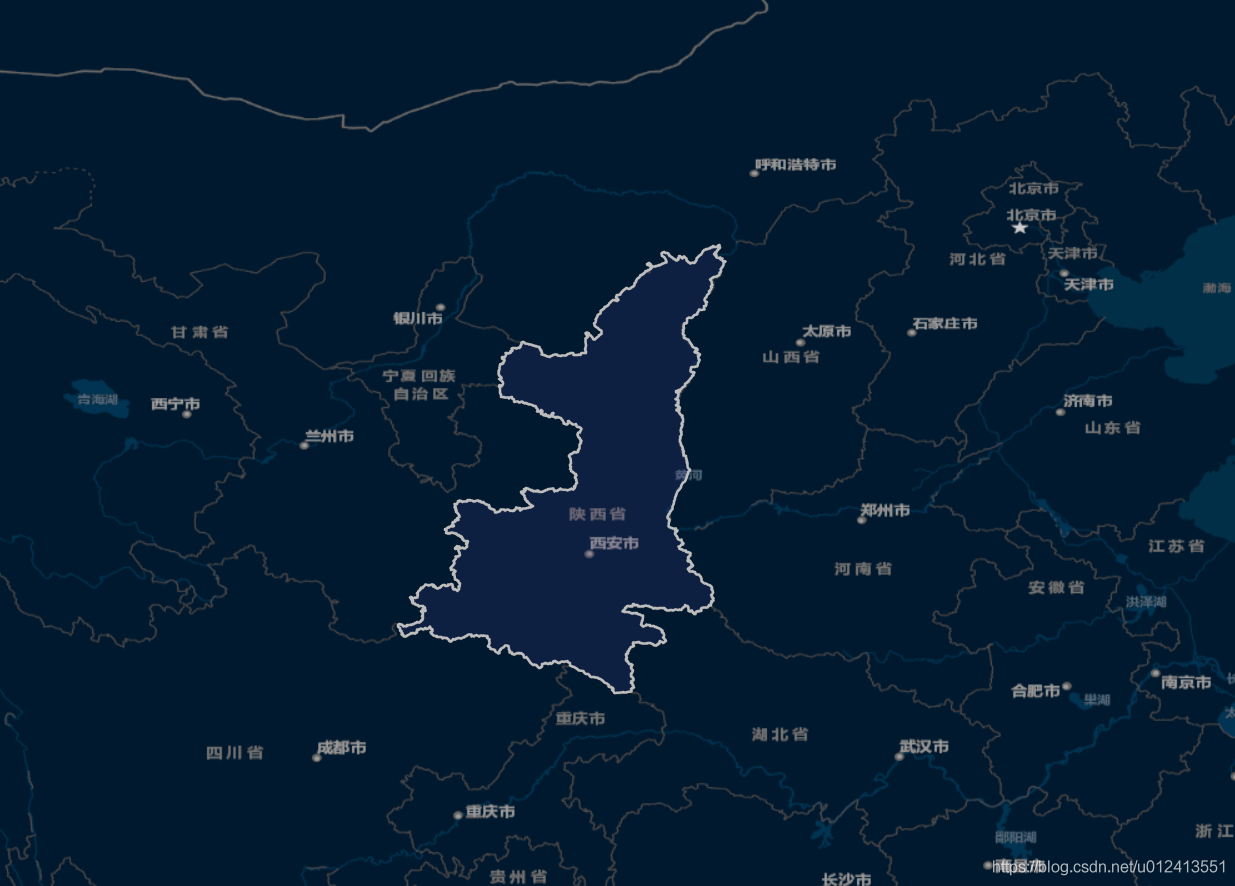
但是有时底图颜色偏白,这时候不再适合对要突出的区域采用遮罩,而是要对突出区域之外进行遮罩处理。暂且称为四周遮罩如下图:
代码实现
(function(){

    var map, converLayer;
    function initMap() {
        var baselayer = new ol.layer.Tile({
            source: new ol.source.XYZ({
                url: 'https://map.geoq.cn/ArcGIS/rest/services/ChinaOnlineStreetGray/MapServer/tile/{z}/{y}/{x}'
            })
        });

        map = new ol.Map({
            target: 'map',
            layers: [baselayer],
            view: new ol.View({
                projection: 'EPSG:4326',
                center: [112, 36],
                zoom: 6
            })
        });

        var mystyle = new ol.style.Style({
            fill: new ol.style.Fill({
                color:"rgba(72,61,139, 0.4)",
            }),
            stroke: new ol.style.Stroke({
                color:"#BDBDBD",
                width:2
            })
        });
        converLayer = new ol.layer.Vector({
            source: new ol.source.Vector(),
            style: mystyle
        });
        map.addLayer(converLayer);
    }

    //todo
    //添加遮罩
    function addconver(data) {
        $.getJSON(data, function(data) {
            var fts = new ol.format.GeoJSON().readFeatures(data);
            var ft = fts[0];
            var converGeom = erase(ft.getGeometry());

            var convertFt = new ol.Feature({
                geometry: converGeom
            })
            converLayer.getSource().addFeature(convertFt);
        })
    }

    // 擦除操作,生成遮罩范围
    function erase(geom) {
	  var extent = [-180,-90,180,90];
	  var polygonRing = ol.geom.Polygon.fromExtent(extent);
	  if (!geom instanceof ol.geom.Polygon) {
	    console.log('geom的类型必须是Polygon')
	    return
	  }
	  var coords = geom.getCoordinates();
	  coords.forEach(coord =>{
	      var linearRing = new ol.geom.LinearRing(coord[0]);
	      polygonRing.appendLinearRing(linearRing);
	  })
	  return polygonRing;
	}


    initMap();
    var dataURL = '/static/data/shanxi.geojson'
    addconver(dataURL);
})();
五,openlayers Polygon数据格式分享
GeoJSON对象
GeoJSON总是由一个单独的对象组成。这个对象表示几何、特征或者特征集合。
GeoJSON对象可能有任何数目成员(名/值对)。
GeoJSON对象必须由一个名字为”type”的成员。这个成员的值是由GeoJSON对象的类型所确定的字符串。 type成员的值必须是下面之一: * “Point”, “MultiPoint”, “LineString”, “MultiLineString”, “Polygon”, “MultiPolygon”, “GeometryCollection”, “Feature”, 或者 “FeatureCollection”。这儿type成员值必须如这儿所示。
GeoJSON对象可能有一个可选的”crs”成员,它的值必须是一个坐标参考系统的对象。
GeoJSON对象可能有一个”bbox”成员,它的值必须是边界框数组。
案例文件地址
六,openlayers 加载wind风场
风场数据文件
安装ol-wind
npm install ol-wind
页面中引入
import { WindLayer } from 'ol-wind'
方法代码如下:
  // 添加风场
  addWindLayer () {
    const windLayer:any = new WindLayer(windData, {
      forceRender: false,
      windOptions: {
        colorScale: ['rgb(36,104, 180)', 'rgb(60,157, 194)', 'rgb(128,205,193 )', 'rgb(151,218,168 )', 'rgb(198,231,181)', 'rgb(238,247,217)', 'rgb(255,238,159)', 'rgb(252,217,125)', 'rgb(255,182,100)', 'rgb(252,150,75)', 'rgb(250,112,52)', 'rgb(245,64,32)', 'rgb(237,45,28)', 'rgb(220,24,32)', 'rgb(180,0,35)'],
        velocityScale: 1 / 8000,
        paths: 1000
      },
      zIndex: 5, // 图层渲染的Z索引,默认按加载顺序叠加
      opacity: 0.75
      // projection: 'EPSG:4326'
    })
    this.windLayer = windLayer
    this.map.addLayer(windLayer)
  }
七,openlayers 添加聚合标点
原文档链接
聚合标注,是指在不同地图分辨率下,通过聚合方式展现标注点的一种方法。
其设计目的是为了减少当前视图下加载标注点的数量,提升客户端渲染速度。因为如果在地图上添加很多标注点,当地图缩放到小级别(即大分辨率)时会出现标注重叠的现象,既不美观,渲染效率也会受到影响。此时,可以根据地图缩放级数(zoom)的大小,将当前视图的标注点进行聚合显示。
OpenLayers也考虑到加载大数据量标注点的情况,提供了相应的聚合标注功能,以提升显示速度,增强用户体验。OpenLayers封装了支持聚合的矢量要素数据源(ol.source.Cluster),通过此数据源实现矢量要素的聚合功能。
前面两篇文章 我们讲了矢量图层 VectorLayer的常用的场景,聚合标注这篇我们继续写一篇 VectorLayer矢量图层 的使用,足见矢量图层在openlayers中的应用是很广泛的也是最常用的。可以看下图所示的放大缩小地图聚合分散的实现效果。
聚合:标注中的数字相加, 分散:标注中的数字相减
1. ol.source.Cluster 参数
使用聚合效果就其实就是使用了这个方法,下面是他的两个主要的参数说明
 let clusterSource = ol.source.Cluster({
    distance: parseInt(20, 10), // 标注元素之间的间距,单位是像素。
    source: source,//数据源
});
2. Cluster类实现聚合分散详解
2.1 我们先看下mounted方法 :初始化一些数据
准备聚合的城市经纬度数据clusterData,和城市聚合值的数据points ,然后调用下实现聚合的方法
this.addCluster()
mounted() {
    let clusterData = {
        成都市: { center: { lng: 104.061902, lat: 30.609503 } },
        广安市: { center: { lng: 106.619126, lat: 30.474142 } },
        绵阳市: { center: { lng: 104.673612, lat: 31.492565 } },
        雅安市: { center: { lng: 103.031653, lat: 30.018895 } },
        自贡市: { center: { lng: 104.797794, lat: 29.368322 } },
        宜宾市: { center: { lng: 104.610964, lat: 28.781347 } },
        内江市: { center: { lng: 105.064555, lat: 29.581632 } }
    };
    let points = [
        { name: "成都市", value: 85 },
        { name: "绵阳市", value: 36 },
        { name: "广安市", value: 50 },
        { name: "雅安市", value: 555 },
        { name: "自贡市", value: 55 },
        { name: "宜宾市", value: 666 },
        { name: "内江市", value: 777 }
    ];
    // 实现聚合分散方法
    this.addCluster(clusterData, points, true);
}
2.2 addCluster() 方法详解
聚合标注的矢量图层的数据源 source 不在单单是 new VectorSource() 而是需要在包裹一层,那就是在 new Cluster 聚合方法中的 source 添加矢量图层的数据 new VectorSource()
继续我们创建一个矢量图层 VectorLayer 里面有两个参数需要设置,一个是 source数据源, 一个是 style 样式,先看设置source 是clusterSource。也就是,需要配置两个参数第一个标注元素之间的间距;第二个是数据源,这里是数据源就说我们实例的矢量图层的数据源new VectorSource(),这里暂时设置为空,后面动态添加即可。
let source = new VectorSource();
let clusterSource = new Cluster({
    distance: parseInt(20, 10),
    source: source
});
let layer = new VectorLayer({
    source: clusterSource,
    style: this.clusterStyle.call(this)
});
把标注的图层添加到地图中去
我们根据初始化的数据去遍历匹配。clusterData 中的城市名和points城市名一致的时候。创建点要素new Feature 信息,可以通过 feature.set(key,value) 的形式动态设置值在要素信息中。
把要素信息添加到矢量图层 source 中。
2.3 addCluster() 方法完整代码
// 设置聚合分散效果
addCluster(clusterData, points, clearup) {
    let source = new VectorSource();
    let clusterSource = new Cluster({
        distance: parseInt(20, 10),
        source: source
    });
    let layer = new VectorLayer({
        source: clusterSource,
        style: this.clusterStyle.call(this)
    });
    this.map.addLayer(layer);
    for (const key in clusterData) {
        points.forEach(e => {
            if (e.name == key) {
                let point = fromLonLat([
                    clusterData[key].center.lng,
                    clusterData[key].center.lat
                ]);
                var f = new Feature({
                    geometry: new Point(point)
                });
                f.set("name", e.name);
                f.set("value", e.value);
                source.addFeature(f);
            }
        });
    }
},
2.4 clusterStyle () 矢量图层样式方法详解
total :通过不断监听获取前面 set 的值,进行累加计算。设置到Text中。
回到这个案例中,下面我们可以看下,滚动下地图,可以看到,会监听要素的feature的变化。相当于vue的watch一样效果,这也是动态样式的应用场景之一。通过不断监听去 触发new Cluster() 方法里面的distances 的属性,进行不断监听,判断 distances 的分辨率(像素)如果匹配设置的值, 达到放到缩小实现聚合分散的效果的同时,不断重新计算total值,并设置到text中。
clusterStyle() {
	return (feature, solution) => {
	    console.log(feature);
	    // .... 省略
	})
}
2.5 clusterStyle () 方法完整代码
// 设置聚合分散的图标样式
clusterStyle() {
    return (feature, solution) => {
        var total = 0;
        feature.get("features").forEach((value, index) => {
        	// 通过value.get("属性名") 获取设置的值
            total += value.get("value"); // 获取累加的数值
        });
        var style = new Style({
            image: new CircleStyle({
                radius: 15, //设置圆角大小
                stroke: new Stroke({
                    color: "blue" //设置园stroke颜色
                }),
                fill: new Fill({
                    color: "rgba(24,144,255,100)" //设置填充颜色
                })
            }),
            text: new Text({
                text: total.toString(), // 文字显示的数值
                fill: new Fill({
                    color: "#FFF" // 文字显示的颜色
                })
            })
        });
        return style;
    };
},
3. 完整代码
<template>
    <div id="app">
        <div id="Map" ref="map"></div>
    </div>
</template>
<script>
import "ol/ol.css";
import TileLayer from "ol/layer/Tile";
import VectorLayer from "ol/layer/Vector";
import VectorSource from "ol/source/Vector";
import XYZ from "ol/source/XYZ";
import { Map, View, Feature, ol } from "ol";
import {
    Style,
    Stroke,
    Fill,
    Icon,
    Text,
    Circle as CircleStyle
} from "ol/style";
import { Polygon, Point } from "ol/geom";
import { defaults as defaultControls } from "ol/control";
import { Cluster } from "ol/source";
import { fromLonLat } from "ol/proj";

import areaGeo from "@/geoJson/sichuan.json";
export default {
    data() {
        return {
            map: null,
            areaLayer: null
        };
    },
    methods: {
        /**
         * 初始化地图
         */
        initMap() {
            this.map = new Map({
                target: "Map",
                controls: defaultControls({
                    zoom: true
                }).extend([]),
                layers: [
                    new TileLayer({
                        source: new XYZ({
                            url:
                                "http://map.geoq.cn/ArcGIS/rest/services/ChinaOnlineStreetPurplishBlue/MapServer/tile/{z}/{y}/{x}"
                        })
                    })
                ],
                view: new View({
                    center: fromLonLat([104.065735, 30.659462]),
                    zoom: 6.5,
                    maxZoom: 19,
                    minZoom: 3
                })
            });
        },
        /**
         * 设置区域
         */
        addArea(geo = []) {
            if (geo.length == 0) return false;
            let areaFeature = null;
            // 设置图层
            this.areaLayer = new VectorLayer({
                source: new VectorSource({
                    features: []
                })
            });
            // 添加图层
            this.map.addLayer(this.areaLayer);
            geo.forEach(g => {
                let lineData = g.features[0];
                if (lineData.geometry.type == "MultiPolygon") {
                    areaFeature = new Feature({
                        geometry: new MultiPolygon(
                            lineData.geometry.coordinates
                        ).transform("EPSG:4326", "EPSG:3857")
                    });
                } else if (lineData.geometry.type == "Polygon") {
                    areaFeature = new Feature({
                        geometry: new Polygon(
                            lineData.geometry.coordinates
                        ).transform("EPSG:4326", "EPSG:3857")
                    });
                }
            });
            areaFeature.setStyle(
                new Style({
                    fill: new Fill({ color: "#4e98f444" }),
                    stroke: new Stroke({
                        width: 3,
                        color: [71, 137, 227, 1]
                    })
                })
            );
            this.areaLayer.getSource().addFeatures([areaFeature]);
        },
        addCluster(clusterData, points, clearup) {
            let source = new VectorSource();
            let clusterSource = new Cluster({
                distance: parseInt(20, 10),
                source: source
            });
            let layer = new VectorLayer({
                source: clusterSource,
                style: this.clusterStyle.call(this)
            });
            this.map.addLayer(layer);
            for (const key in clusterData) {
                points.forEach(e => {
                    if (e.name == key) {
                        let point = fromLonLat([
                            clusterData[key].center.lng,
                            clusterData[key].center.lat
                        ]);
                        var f = new Feature({
                            geometry: new Point(point)
                        });
                        f.set("name", e.name);
                        f.set("value", e.value);
                        source.addFeature(f);
                    }
                });
            }
        },
        clusterStyle() {
            return (feature, solution) => {
                var total = 0;
                feature.get("features").forEach((value, index) => {
                    total += value.get("value");
                });
                var style = new Style({
                    image: new CircleStyle({
                        radius: 15,
                        stroke: new Stroke({
                            color: "blue"
                        }),
                        fill: new Fill({
                            color: "rgba(24,144,255,100)"
                        })
                    }),
                    text: new Text({
                        text: total.toString(),
                        fill: new Fill({
                            color: "#FFF"
                        }),
                        font: "12px Calibri,sans-serif",
                        stroke: new Stroke({
                            color: "red",
                            width: 5
                        })
                    })
                });
                return style;
            };
        }
    },
    mounted() {
        this.initMap();
        let clusterData = {
            成都市: { center: { lng: 104.061902, lat: 30.609503 } },
            广安市: { center: { lng: 106.619126, lat: 30.474142 } },
            绵阳市: { center: { lng: 104.673612, lat: 31.492565 } },
            雅安市: { center: { lng: 103.031653, lat: 30.018895 } },
            自贡市: { center: { lng: 104.797794, lat: 29.368322 } },
            宜宾市: { center: { lng: 104.610964, lat: 28.781347 } },
            内江市: { center: { lng: 105.064555, lat: 29.581632 } }
        };
        let points = [
            { name: "成都市", value: 85 },
            { name: "绵阳市", value: 36 },
            { name: "广安市", value: 50 },
            { name: "雅安市", value: 555 },
            { name: "自贡市", value: 55 },
            { name: "宜宾市", value: 666 },
            { name: "内江市", value: 777 }
        ];
        this.addCluster(clusterData, points, true);
    }
};
</script>
<style lang="scss" scoped>
// 此处非核心,已经删除
</style>
八,openlayers 聚合标点点击事件
这个事件的研究不多做解说原理,直接上我的实战代码
mapClick (e:any) {
    const feature = this.map.forEachFeatureAtPixel(e.pixel,
      (feature: any) => {
        if (feature.data) {
          this.featureClick(feature.data)
        } else {
          if (feature.getProperties().features) { // 聚合情况下
            if (feature.getProperties().features.length === 1) {
              console.log(feature.getProperties().features[0])
            }
          }
        }
      })
    if (feature) { // 这里说明我们点击的是点标记,
      const lnglat = feature.get('lnglat')// 我们可以通过给点标记传不同的值,来判断点击不同的点标记触发的事件。
      if (lnglat) {
        // 含有lnglat 参数的点标记触发事件
      }
    }
  }
如果对您有所帮助,欢迎您点个关注,我会定时更新技术文档,大家一起讨论学习,一起进步。


 4732
4732


 被折叠的 条评论
为什么被折叠?
被折叠的 条评论
为什么被折叠?
 到【灌水乐园】发言


