


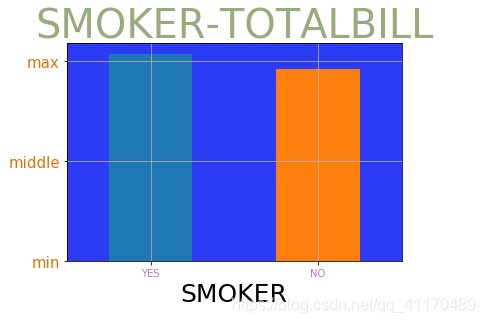
查看吸烟和不吸烟者消费账单的平均值
plt.subplot(facecolor=np.random.random(size=3))
tips.groupby('smoker')["total_bill"].mean().plot(kind="bar")
plt.grid()
plt.ytick([0,10,20],["min","middle","max"],fontsize=15,color=np.random.random(size=3))
plt.xlabel('SMOKER',fontsize=25)
plt.xticks([0,1],["yes","no"],rotation=0,color=np.random.random(size=3))
plt.title("SMOKER_TOTALBILL",fontsize=40,color=np.random.random(size=3))
plt.show()
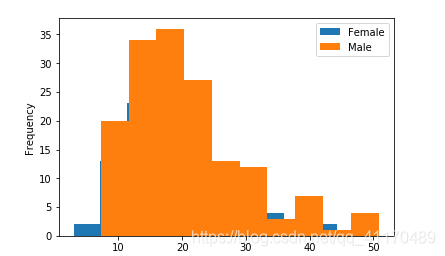
图例
tips.query('sex == "Female"')["total_bill"].plot(kind='hist', label="Female")
tips.query('sex == "Male"')["total_bill"].plot(kind="hist", label="Male")
plt.legend()
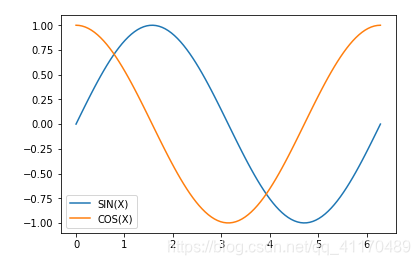
# 所有的绘图函数中,都可以使用lable设置对应图像的图例的标签
plt.plot(x, np.sin(x), label="SIN(X)")
plt.plot(x, np.cos(x), label="COS(X)")
plt.legend()
# 一个cell中展示两个画板
tips.query(
最低0.47元/天 解锁文章


 795
795


 被折叠的 条评论
为什么被折叠?
被折叠的 条评论
为什么被折叠?
 到【灌水乐园】发言


