


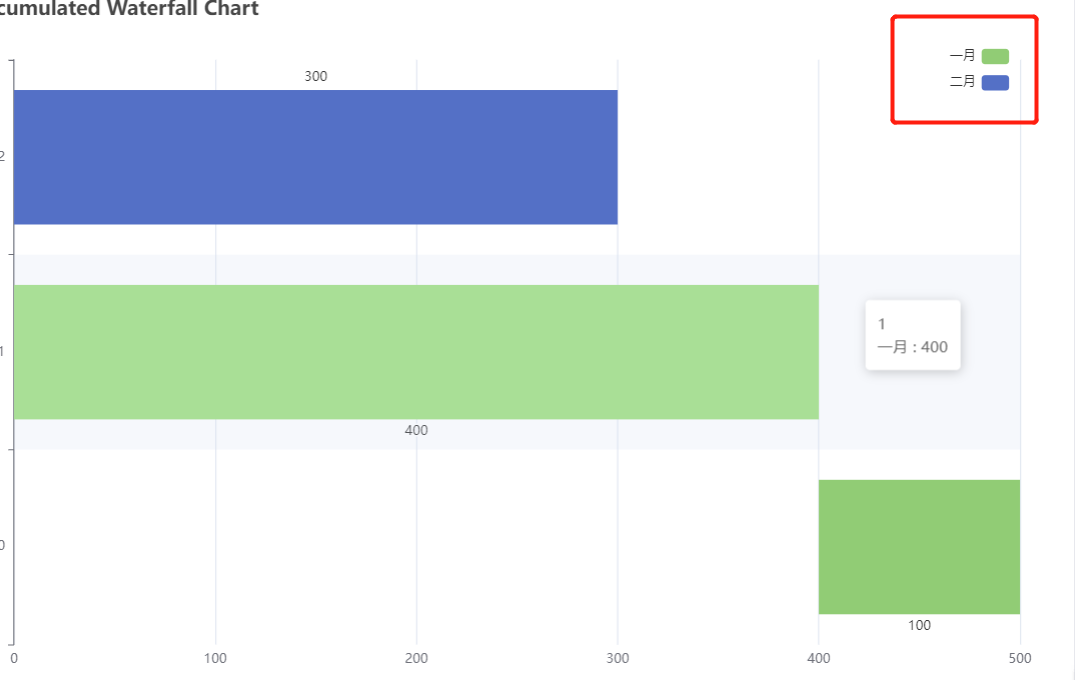
纵轴转横轴
  xAxis: {
    type: 'value',
  },
  yAxis: {
    type: 'category',
  },
图例的位置
  legend: {
    orient: 'vertical',
     x:'right',
        y:'top',
        padding:[50,50,0,0],
    data: ['一月', '二月']
  },
引入代码案例
<script>
	import * as echarts from 'echarts';
	export default {
		components: {
		},
		data() {
			return {
			}
		},

		mounted(){
			this.drawChart()
		},
		methods: {
			drawChart() {
			// 获取容器元素
			var chartDom = document.getElementById('echarts');
			// 创建图表实例
			var myChart = echarts.init(chartDom);
			// 定义图表的配置项和数据
			var option = {
					grid: {
						show: false
					},
					tooltip: {
						trigger: 'axis',
						axisPointer: {
						type: 'shadow'
						}
					},
					grid: {
						left: '3%',
						right: '4%',
						bottom: '3%',
						containLabel: true
					},
					xAxis: [
						{
							type: 'category',
							data: ['10/30', '', '11/1', '', '11/3', '', '11/5'],
							axisTick: {
								alignWithLabel: true
							},
							splitLine: {
								show: false
							},
						}
					],
					yAxis: [
						{
						type: 'value',
						axisLabel: {
							show: false // 显示 y 轴刻度值
						}
						}
					],
					series: [
						{
							name: 'Direct',
							type: 'bar',
							barWidth: '20%',
							data: [10, 52, 100, 334, 200, 30, 220],
							itemStyle: {
								borderRadius: [10, 10, 0, 0] // 设置柱形的上边缘为圆形
							},
							label: {
								show: true,
								position: 'top',
								formatter: function(params) {
								return params.value; // 返回柱形对应的数值
								}
							}
						}
					]
			};
			// 使用配置项和数据绘制图表
			myChart.setOption(option);
    		}
  		}

	}

</script>


 2474
2474


 被折叠的 条评论
为什么被折叠?
被折叠的 条评论
为什么被折叠?
 到【灌水乐园】发言


