


老规矩,先看效果:
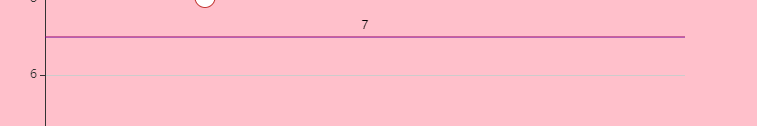
这里主要用echarts的markLine 来实现,下面是代码;
<!DOCTYPE html>
<html lang="en">
<head>
    <meta charset="UTF-8">
    <title>echarts.js案例一</title>
    <script type="text/javascript" src='echarts.js'></script>
</head>
<body>
    <div id="chart" style="width:800px;height:500px;background:pink;"></div>
</body>
<script type="text/javascript">
    // 初始化图表标签
    var myChart = echarts.init(document.getElementById('chart'));


	option = {
    xAxis: {
        data : ['aaa','bbb']
    },
    yAxis: {},
    series: [{
        symbolSize: 20,
        data: [
            ['aaa', 8.04],
            ['bbb', 9.04],
        ],
        type: 'line',
        markLine: {
                symbol: ['none', 'none'],//去掉箭头
                itemStyle: {
                    normal: {
						lineStyle: {
							type: 'solid',
							color:{//设置渐变
                                  type: 'linear',
                                  x: 0,
                                  y: 0,
                                  x2: 0,
                                  y2: 1,
                                  colorStops: [{
                                      offset: 0, color: 'red '// 0% 处的颜色
                                  }, {
                                      offset: 1, color: 'blue' // 100% 处的颜色
                                  }],
                                  global: false // 缺省为 false
                              }
						},
						label: {
							show: true,
							position:'middle'
						}
					}
                },
                data: [{
                            yAxis : 7,//这里设置false是隐藏不了的,可以设置为-1
                      },]
        }
    }]
};


    myChart.setOption(option);
</script>
</html>


 6830
6830

 被折叠的 条评论
为什么被折叠?
被折叠的 条评论
为什么被折叠?
 到【灌水乐园】发言


