


原文:09_绘图
import ee
import geemap

# geemap.show_youtube('PDab8mkAFL0')
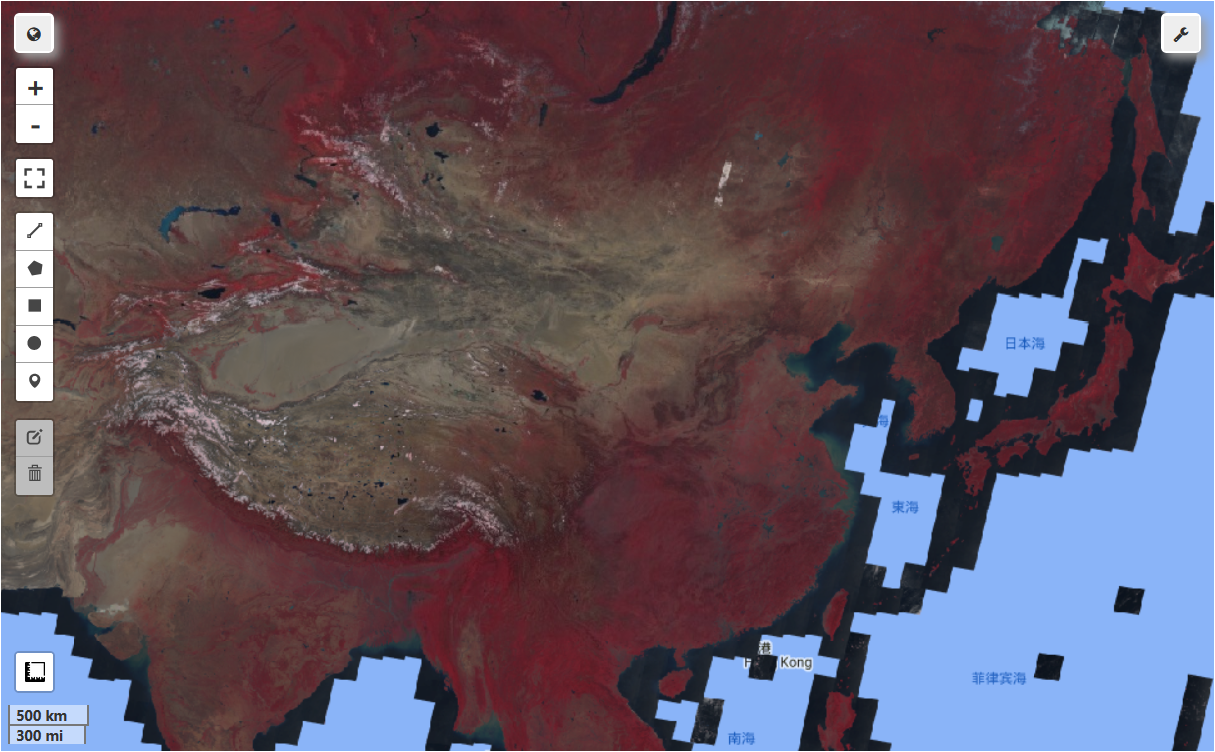
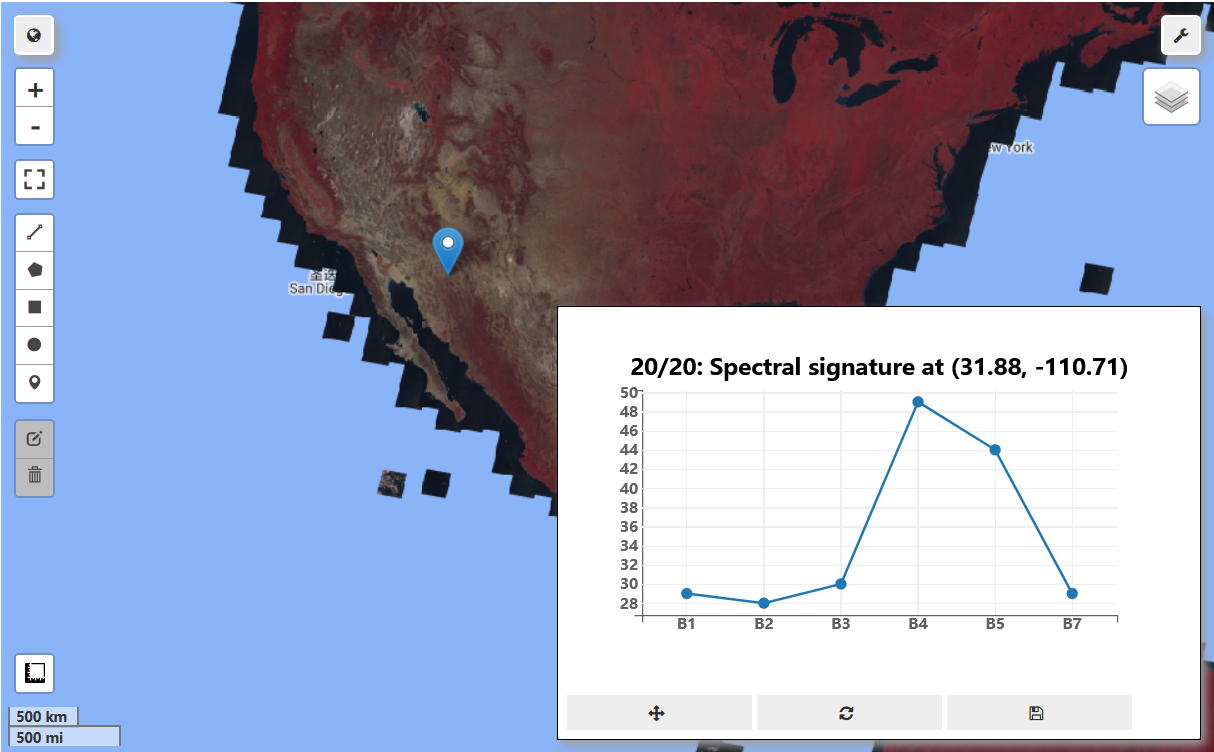
Landsat7 = ee.Image('LE7_TOA_5YEAR/1999_2003') \
                        .select([0, 1, 2, 3, 4, 6])

Landsat_vis = {
    'bands': ['B4', 'B3', 'B2'],
    'gamma': 1.4
}

Map.addLayer(Landsat7, Landsat_vis, "LE7_TOA_5YEAR/1999-2003")
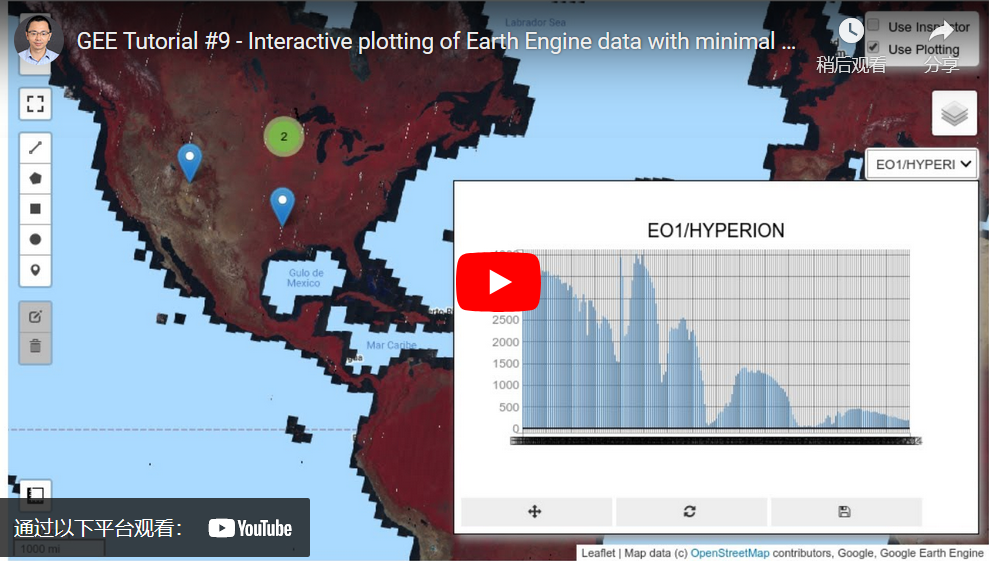
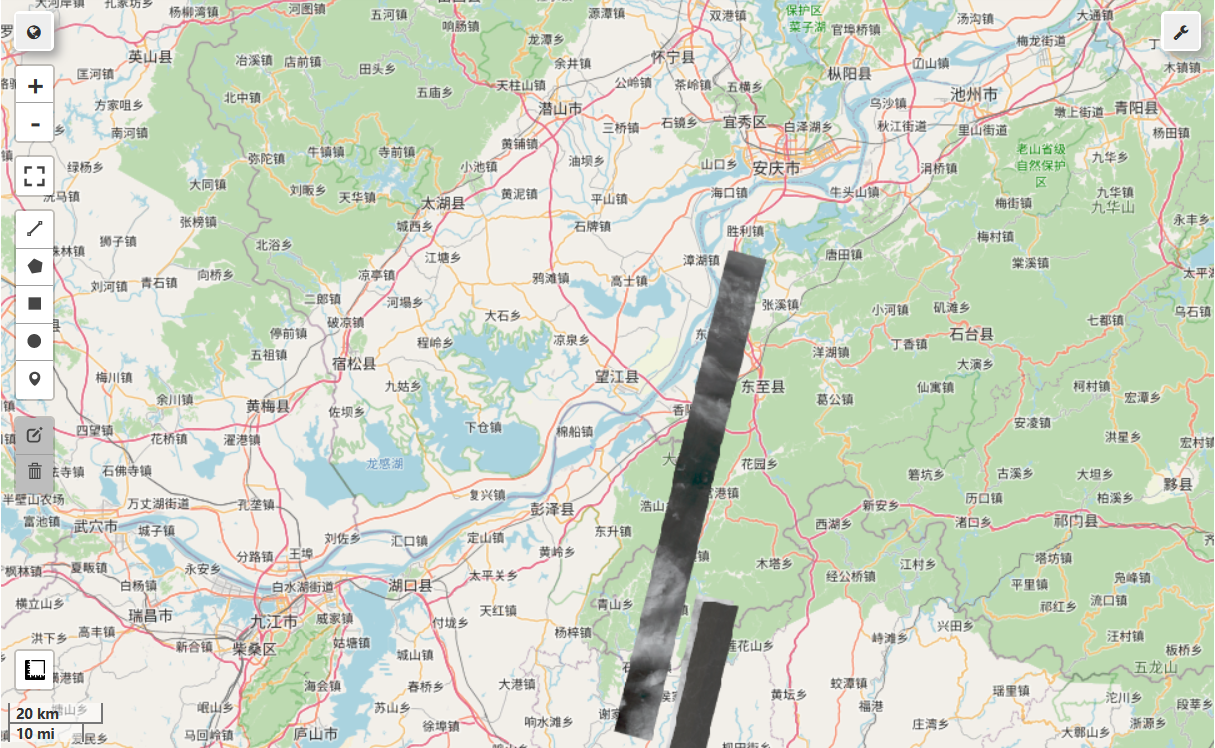
hyperion = ee.ImageCollection("EO1/HYPERION") \
                        .filter(ee.Filter.date('2016-01-01', '2017-03-01'))

hyperion_vis = {
    'min': 1000.0,
    'max': 14000.0,
    'gamma': 2.5,
}
Map.addLayer(hyperion, hyperion_vis, "EO1/HYPERION");
Map.set_plot_options(plot_type = 'bar', add_marker_cluster=True)
Map
map = geemap.Map()
map.plot_demo()


 691
691


 被折叠的 条评论
为什么被折叠?
被折叠的 条评论
为什么被折叠?
 到【灌水乐园】发言


