picture3Option:{
color: ['#80FFA5'],
tooltip: {
trigger: 'axis',
axisPointer: {
type: 'cross',
label: {
backgroundColor: '#6a7985'
}
}
},
grid: {
top: "5px",
left: "15px",
right: "40px",
bottom: "5px",
containLabel: true
},
xAxis: [
{
type: 'category',
boundaryGap: false,
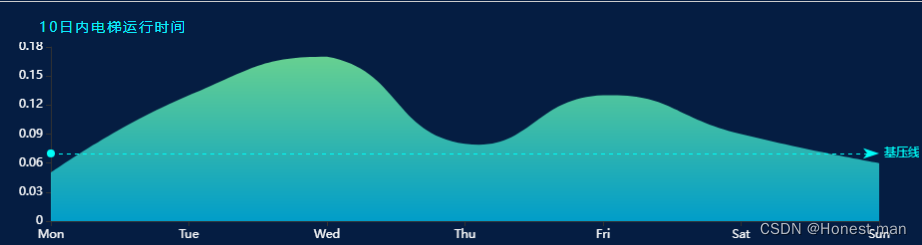
data: ['Mon', 'Tue', 'Wed', 'Thu', 'Fri', 'Sat', 'Sun']
},
],
axisLabel: {
color: "#fff",
},
yAxis: {
splitLine: {
show: false,
},
},
series: [
{
name: 'Line1',
type: 'line',
stack: 'Total',
smooth: true,
lineStyle: {
width: 0
},
showSymbol: false,
areaStyle: {
opacity: 0.8,
color: new echarts.graphic.LinearGradient(0, 0, 0, 1, [
{
offset: 0,
color: 'rgba(128, 255, 165)'
},
{
offset: 1,
color: 'rgba(1, 191, 236)'
}
])
},
emphasis: {
focus: 'series'
},
data: [0.05, 0.13, 0.17, 0.08, 0.13, 0.09, 0.06],
markLine:{
silent:true,
lineStyle:{
width:'90%',
normal:{
color:'#01fef9'
}
},
data:[{
yAxis:0.15
},{
yAxis:0.03
}],
label:{ normal:{ formatter:'基压线' }},
},
},
]
},


 1226
1226


 被折叠的 条评论
为什么被折叠?
被折叠的 条评论
为什么被折叠?
 到【灌水乐园】发言


