


// Echarts 设置X轴旋转属性:rotate
axisLabel: {
            interval:0,
            rotate:40  // x轴名称旋转角度
            }
<!DOCTYPE html>
<html lang="en">
<head>
<meta charset="UTF-8">
<title>分类投诉量</title>
</head>
<body>
<section class="content1">
<div class="row">
<div class="col-xs-12">
<div class="box">
<div id="top10_bar" style="width:1600px; height:800px;margin-left:-40px"></div>
<!-- /.box-body -->
</div>
<!-- /.box -->
</div>
<!-- /.col -->
</div>
<!-- /.row -->
</section>
<script src="/static/echarts/echarts.min.js"></script>
<script type="text/javascript">
var myChart = echarts.init(document.getElementById('top10_bar'));
var option = {
title:{
left: 'center',
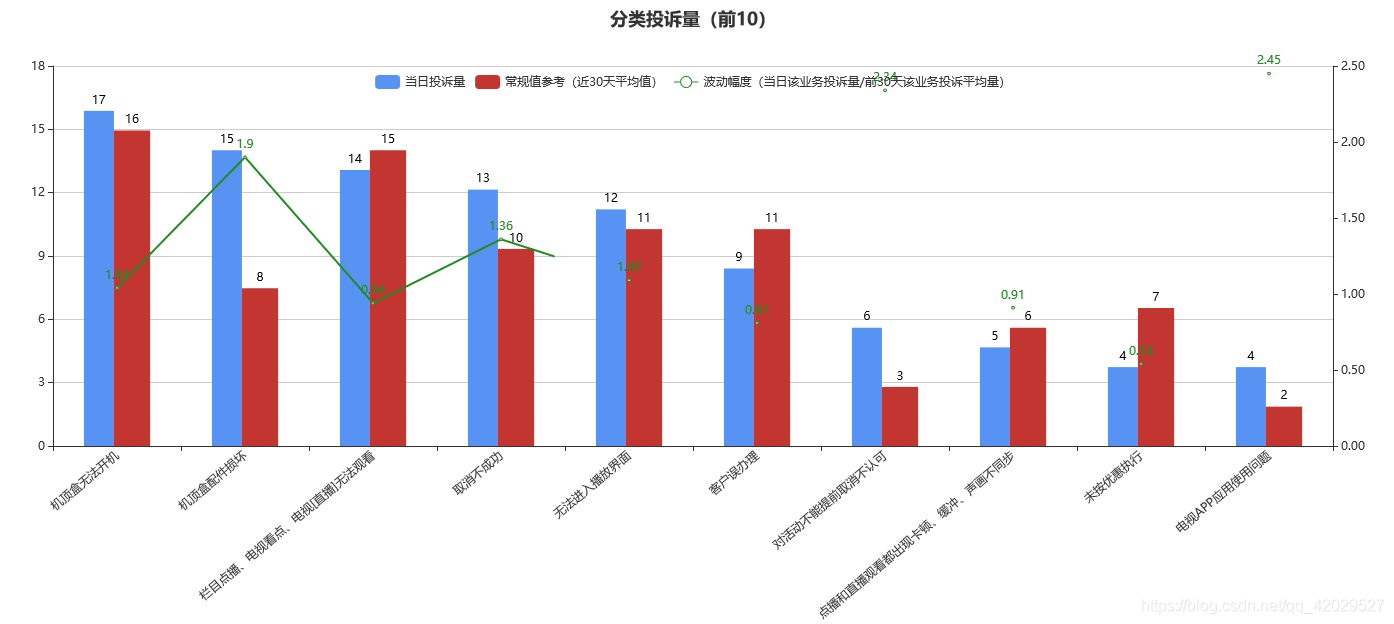
text:'分类投诉量(前10)'
},
tooltip:{},
legend:{
show: true,
top:"8%"
},
xAxis:{
data: ['机顶盒无法开机', '机顶盒配件损坏', '栏目点播、电视看点、电视[直播]无法观看', '取消不成功', '无法进入播放界面', '客户误办理', '对活动不能提前取消不认可', '点播和直播观看都出现卡顿、缓冲、声画不同步', '未按优惠执行', '电视APP应用使用问题'],
axisLabel: {
interval:0,
rotate:40
}
},
grid: {
left: '10%',
bottom:'45%'
},
yAxis:[
{
type: 'value'
},
{
type: 'value',
splitLine :{ //网格线
lineStyle:{
type:'dashed' //设置网格线类型 dotted:虚线 solid:实线
},
show:false //隐藏或显示
},
axisLabel: {
formatter:function(value,index){
return value.toFixed(2);
}
}
}],
series:[{
name:'当日投诉量',
type:'bar',
barGap: "0%",
barWidth : 30,//柱图宽度
color:"#5793f3",
data:[17, 15, 14, 13, 12, 9, 6, 5, 4, 4],
itemStyle: { //上方显示数值
normal: {
label: {
show: true, //开启显示
position: 'top', //在上方显示
textStyle: { //数值样式
color: 'black',
fontSize: 12
}
}
}
}
},
{
name:'常规值参考(近30天平均值)',
type:'bar',
data:[16, 8, 15, 10, 11, 11, 3, 6, 7, 2],
itemStyle: { //上方显示数值
normal: {
label: {
show: true, //开启显示
position: 'top', //在上方显示
textStyle: { //数值样式
color: 'black',
fontSize: 12
}
}
}
}
},
{
name:'波动幅度(当日该业务投诉量/前30天该业务投诉平均量)',
type:'line',
yAxisIndex: 1, //这里要设置哪个y轴,默认是最左边的是0,然后1,2顺序来。
data:[1.04, 1.9, 0.94, 1.36, 1.09, 0.81, 2.34, 0.91, 0.54, 2.45],
symbolSize:7,
itemStyle : {
normal : {
color: new echarts.graphic.LinearGradient(0, 0, 0, 1, [{
offset: 0,
color: 'rgb(34,139,34)'
}, {
offset: 1,
color: 'rgb(34,139,34)'
}]),
label : {
show : true,
position : 'top',
textStyle : {
fontSize : '12',
color: 'rgb(34,139,34)'
}
}
}
}
}]
};
myChart.setOption(option);
</script>
</body>
</html>


 561
561


 被折叠的 条评论
为什么被折叠?
被折叠的 条评论
为什么被折叠?
 到【灌水乐园】发言


