


相关文章
有英语基础的同学可以看一下我之前的博客
 https://blog.csdn.net/qq_42276781/article/details/104144931
理论基础
平移变换
demo_translation.m
clear, close all
%% 绘制变换前的图形
points = [2 2 3 3 2;
2 3 3 2 2];
points = [points; ones(1,5)];
figure
plot(points(1,:), points(2,:), 'b*-');
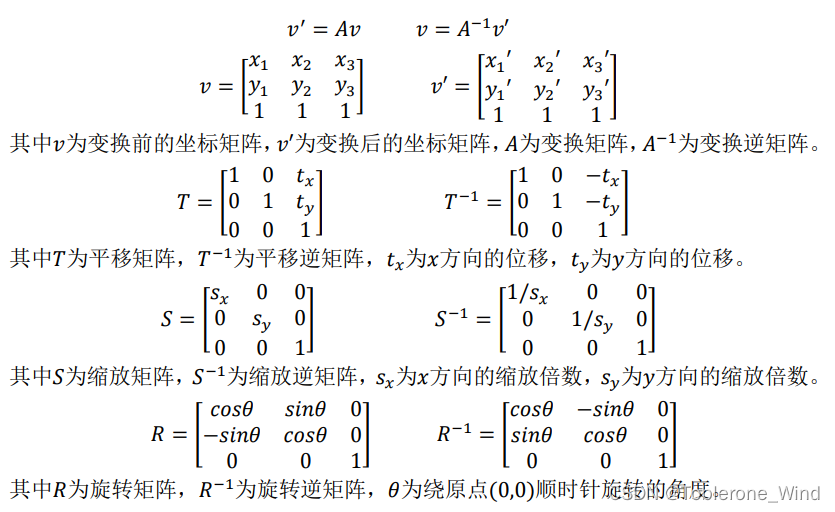
%% 设置平移矩阵
tx = 1; % x方向位移
ty = 2; % y方向位移
translation = [1 0 tx;
0 1 ty;
0 0 1];
%% 平移变换
translated = translation * points;
%% 绘制变换后的图形
hold on
plot(translated(1,:), translated(2,:), 'ro--');
legend('原图形','变换后')
axis equal;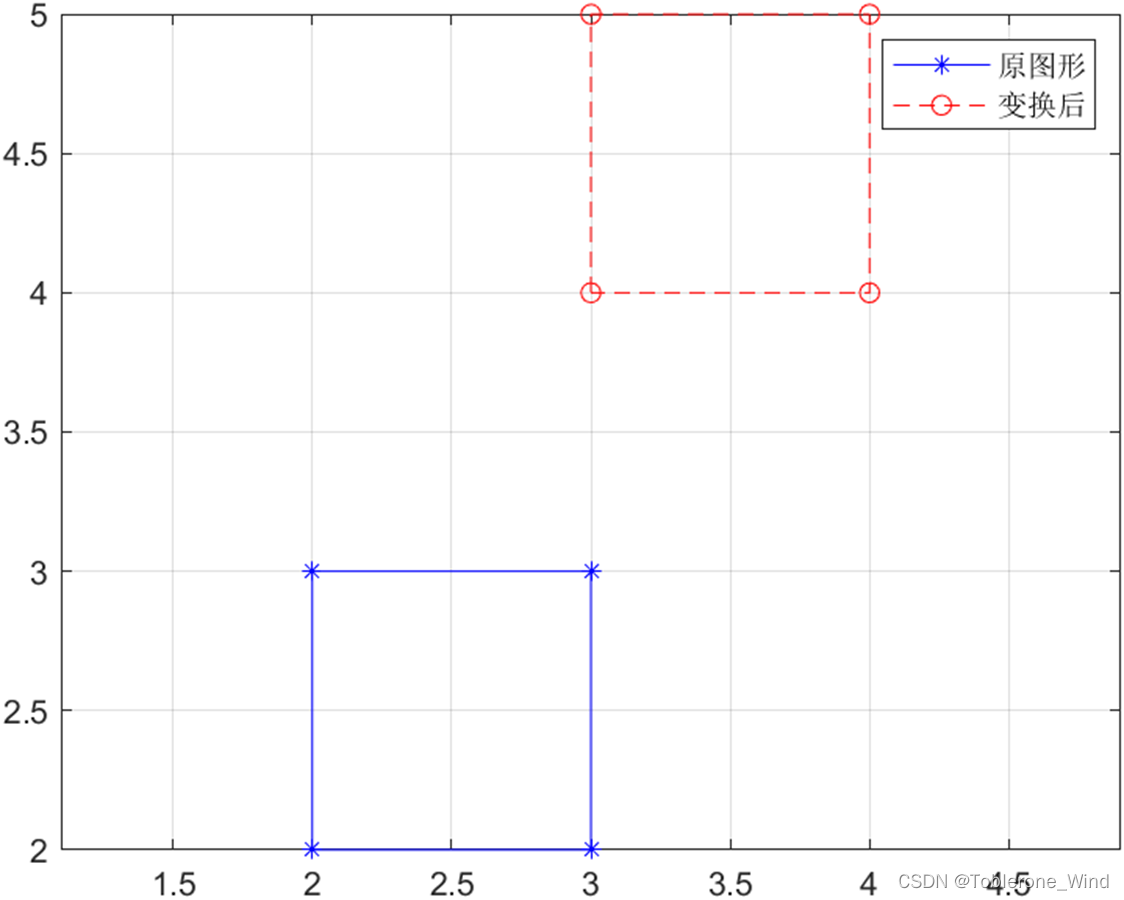
旋转变换
demo_rotation.m
clear, close all
%% 绘制变换前的图形
points = [2 2 3 3 2;
          2 3 3 2 2];
points = [points; ones(1,5)];
figure
plot(points(1,:), points(2,:), 'b*-');
%% 设置旋转矩阵
xita = pi/3; % 绕原点(0,0)顺时针旋转角度
rotation = [cos(xita) sin(xita)  0;
           -sin(xita) cos(xita)  0;
                0         0      1];
%% 旋转变换
rotated = rotation * points;
%% 绘制变换后的图形
hold on
plot(rotated(1,:), rotated(2,:), 'ro--');
legend('原图形','变换后')
axis equal;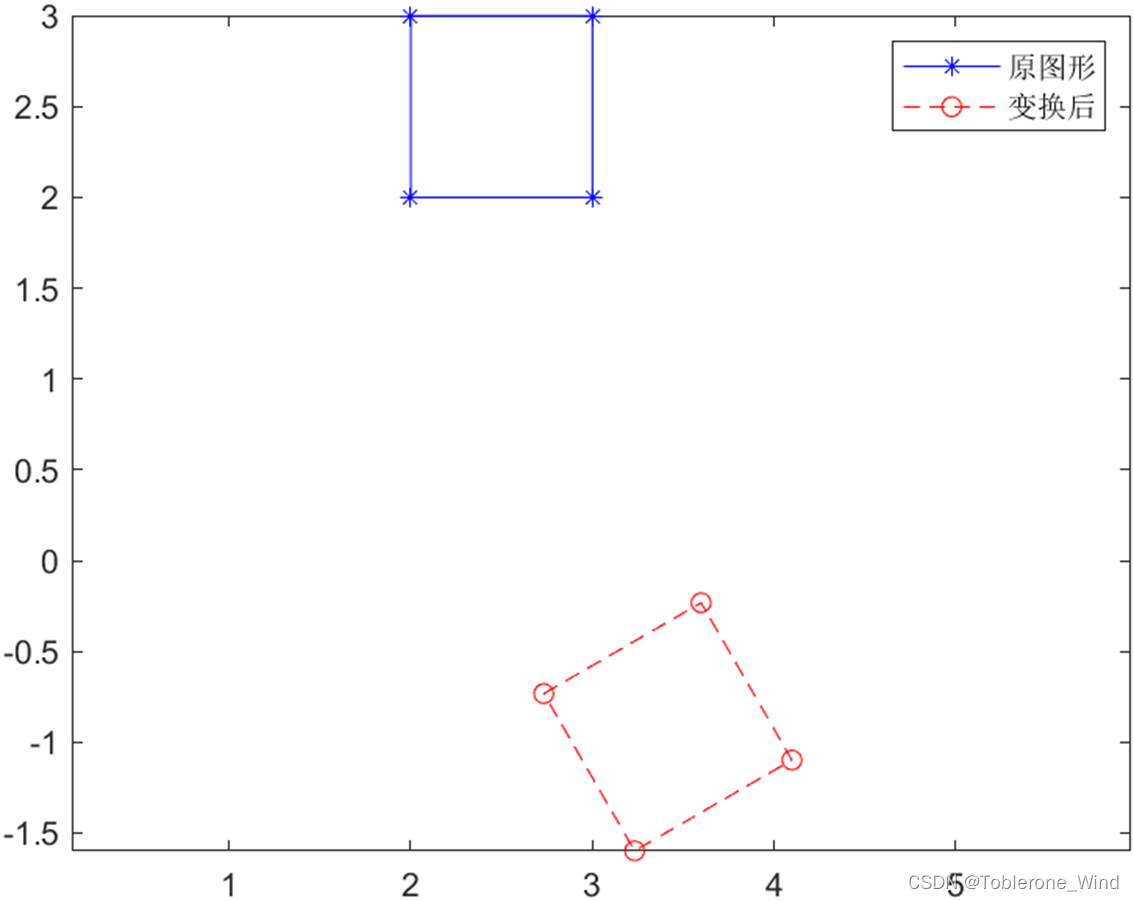
缩放变换
demo_scaling.m
clear, close all
%% 绘制变换前的图形
points = [2 2 3 3 2;2 3 3 2 2];
points = [points; ones(1,5)];
figure
plot(points(1,:), points(2,:), 'b*-');
%% 设置缩放矩阵
sx = 1; % 横坐标缩放尺度
sy = 2; % 纵坐标缩放尺度
scaling = [sx   0   1;
            0  sy   1;
            0   0   1];
%% 缩放变换
scaled = scaling * points;
%% 绘制变换后的图形
hold on
plot(scaled(1,:), scaled(2,:), 'ro--');
legend('原图形','变换后')
axis equal;
代码获取

关注公众号,回复“数字图像处理”即可获得完整代码


 被折叠的 条评论
为什么被折叠?
被折叠的 条评论
为什么被折叠?
 到【灌水乐园】发言


