


Matlab lesson
一、Plot from “Data”
• Strategies:
- Generate the numeric values of a function over a
specific range - Display the data “points” in a graphical way
1.Format
•plot(x,y) plots each vector pairs (x,y)
• plot(y) plots each vector pairs (x,y), where x=[1…n], n=length(y)
2.Exmple
plot(cos(0:pi/20:2*pi));

plot(cos(0:pi/20:2*pi));
plot(sin(0:pi/20:2*pi));
同时绘制两个图形 这个图片并未显示cos,这是因为matlab自动关闭前一幅图。如果希望同时绘制两个图象在一副图上需要用到一下指令
hold on/off
hold on
plot(cos(0:pi/20:2*pi));
plot(sin(0:pi/20:2*pi));
hold off

3.plot style:plot(x,y,‘str’)

 hold on
plot(cos(0:pi/20:2*pi),'+-g');
plot(sin(0:pi/20:2*pi),'s:y');
hold off
``

4.标注图标
x=0:0.5:4*pi;
y=sin(x); h=cos(x); w=1./(1+exp(-x));
g=(1/(2*pi*2)^0.5).*exp((-1.*(x-2*pi).^2)./(2*2^2));
plot(x,y,'bd-',x,h,'gp:',x,w,'ro-',x,g,'c^-');
``

此时图中有四个图像不好区分,可加入legend()标注图标
x=0:0.5:4*pi;
y=sin(x);
h=cos(x); w=1./(1+exp(-x));
g=(1/(2*pi*2)^0.5).*exp((-1.*(x-2*pi).^2)./(2*2^2));
plot(x,y,'bd-',x,h,'gp:',x,w,'ro-',x,g,'c^-');
legend('sin(x)','cos(x)','Sigmoid','Gauss function');

5.添加标题与标签
x = 0:0.1:2*pi;
y1 = sin(x);
y2 = exp(-x);
plot(x, y1, '--*', x, y2, ':o');
xlabel('t = 0 to 2\pi');
ylabel('values of sin(t) and e^{-x}')
title('Function Plots of sin(t) and e^{-x}');
legend('sin(t)','e^{-x}');
在xlable 与ylable中 \pi 不是除以pi,而是显示字符pi
其中 e^{-x} 同样是为了显示字符

6.Text with mathematical expression using LaTex
x = linspace(0,3);
y = x.^2.*sin(x);
plot(x,y);
line([2,2],[0,2^2*sin(2)]); //画图中竖线
str = '$$ \int_{0}^{2} x^2\sin(x) dx $$'; //LaTeX公式
text(0.25,2.5,str,'Interpreter','latex') ;  //固定用法
annotation('arrow','X',[0.32,0.5],'Y',[0.6,0.4]); //画箭头


7.练习
t=linspace(1,2);
f=t.^2;
g=sin(2*pi*t);
plot(t,f,'-k',t,g,'or');
xlabel('Time (ms)');
ylabel('f(t)');
title('Mini Assignment #1');
legend('t.^(2)','sin(2\pit)');
8.Figure Adjustment

- Modifying Properties of An Object
Strategy:- Identify the “handle” of an object
- Fetch or modify the object’s properties
for exmple:change the limits of the x-axis:
Identifying the Handle of An Object
Fetching(取回) or Modifying Properties
• To fetch properties:get()
• To modify properties:set()
x = linspace(0, 2*pi, 1000);
y = sin(x); h = plot(x,y);
get(gac)


Setting Axes Limits
set(gca,
'XLim', [0, 2*pi]);
set(gca,
'YLim', [-1.2, 1.2]);

加入
set(gca, 'FontSize', 25);
在这里插入代码片
加入
set(gca,
'XTick', 0:pi/2:2*pi);
set(gca, 'XTickLabel', 0:90:360);//角度换数字

set(gca, 'FontName', 'symbol');
set(gca, 'XTickLabel', {'0', 'p/2', 'p', '3p/2', '2p'});//在symbol中pi用p表示

这是因为现有Matlab不支持symbol字体。
将代码改为
x = linspace(0, 2*pi, 1000);
y = sin(x); h = plot(x,y);
set(gca, 'XLim', [0, 2*pi]);
set(gca, 'YLim', [-1.2, 1.2]);
set(gca, 'FontSize', 25);
set(gca, 'XTick', 0:pi/2:2*pi);
set(gca, 'XTickLabel', {'0', '\pi/2', '\pi', '3\pi/2', '2\pi'});

加入
set(h, 'LineStyle', '-.','LineWidth', 7.0, 'Color', 'g');

delete(h);//删去h
• Face and edge colors of the markder
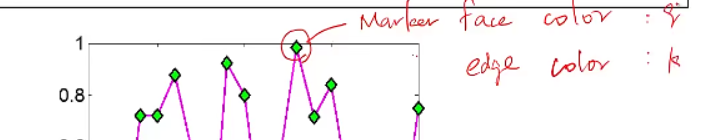
x=rand(20,1);
 set(gca, 'FontSize', 18);
plot(x,'-md','LineWidth', 2, 'MarkerEdgeColor', 'k','MarkerFaceColor', 'g', 'MarkerSize', 10);
xlim([1, 20]);

练习
t=linspace(1,2);
f=t.^2;
g=sin(2*pi*t);
hold on;
f1=plot(t,f,'-k');
f2=plot(t,g,'or');
set(f1,'linewidth',4);
set(f2,'LineWidth', 2,'MarkerFaceColor', 'b' ,'MarkerSize', 10);
xlabel('Time (ms)');
ylabel('f(t) and g(t)');
title('Mini Assignment #1');
legend('t^2','sin(2\pit)','location','northwest');
hold off;

9.Multiple Figures
x = -10:0.1:10;
y1 = x.^2 - 8;
y2 = exp(x);
figure, plot(x,y1);
figure, plot(x,y2);

10.Figure Position and Size
figure('Position', [left, bottom, width, height]);

x = -10:0.1:10;
y1 = x.^2 - 8;
y2 = exp(x);
subplot(1,2,1);plot(x,y1);
subplot(1,2,2);plot(x,y2);

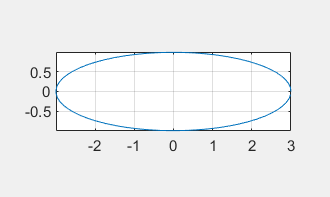
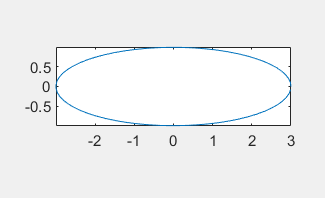
t = 0:0.1:2*pi; x = 3*cos(t); y = sin(t);
subplot(2, 2, 1); plot(x, y); axis normal
subplot(2, 2, 2); plot(x, y); axis square
subplot(2, 2, 3); plot(x, y); axis equal
subplot(2, 2, 4); plot(x, y); axis equal tight

通过不同的坐标设定,使得同一图形产生不同形状

grid(格线),box(盒子),axis(坐标),都是不同的部分,可以分别打开和关闭,如
grid on
grid off
11.Saving Figures into Files
saveas(gcf,'<filename>','<formattype>');


可以将figure存储为jpg文件


 412
412


 被折叠的 条评论
为什么被折叠?
被折叠的 条评论
为什么被折叠?
 到【灌水乐园】发言


