


 该项目旨在通过分析天池大数据竞赛提供的2016年1月到6月用户线上线下消费行为,预测用户领取优惠券后15天内使用概率。数据预处理和特征工程后,运用随机森林、GBDT、Xgboost等模型进行训练,并以AUC为评估标准。结果显示大部分人未使用优惠券,少数人使用,3-6月销售量显著高于1、2月,可能是运营策略或季节因素影响。
1.项目摘要说明
项目目的:对于数据分析的练习
数据来源:天池大数据竞赛平台
源码.数据集以及字段说明 链接:
地址:–https://tianchi.aliyun.com/competition/entrance/231593/information
—
本项目摘要:
- 利用天猫阿里云天池提供的o2o场景相关的丰富数据(收集用户在某个平台下,时间维度为2016.01.01-2016.06.30的真实线上线下消费行为),首先对数据集进行数据研究分析及可视化,再对其进行数据预处理和特征工程加工,然后对训练集进行分割,用来进行交叉训练,利用随机森林、GBDT及Xgboost等算法对训练集进行训练及建模,对训练集进行训练预测之后,最后对测试集进行预测(预测集为在7月领取优惠卷的用户),预测他们在领取优惠卷后15天内使用优惠卷的概率,最终评价标准为AUC(Area Under Curve)平均值
2.数据分析
导入需要使用的工具包
import numpy as np
import matplotlib.pyplot as plt
import seaborn as sns
%matplotlib inline
import folium
import pandas as pd
import  webbrowser
from pyecharts import options as opts
from pyecharts.charts import Page, Pie, Bar, Line, Scatter, Scatter3D
import warnings
warnings.filterwarnings("ignore")
读取数据(这里仅使用线下训练集数据)
off_train = pd.read_csv('./ccf_offline_stage1_train.csv')
off_train.head() #显示前五行
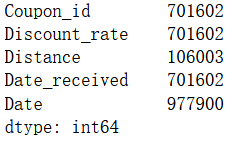
off_train.isnull().sum()[off_train.isnull().sum()!=0]#查看空值情况
| User_id | Merchant_id | Coupon_id | Discount_rate | Distance | Date_received | Date | |
|---|---|---|---|---|---|---|---|
| 0 | 1439408 | 2632 | NaN | NaN | 0.0 | NaN | 20160217.0 |
| 1 | 1439408 | 4663 | 11002.0 | 150:20 | 1.0 | 20160528.0 | NaN |
| 2 | 1439408 | 2632 | 8591.0 | 20:1 | 0.0 | 20160217.0 | NaN |
| 3 | 1439408 | 2632 | 1078.0 | 20:1 | 0.0 | 20160319.0 | NaN |
| 4 | 1439408 | 2632 | 8591.0 | 20:1 | 0.0 | 20160613.0 | NaN |
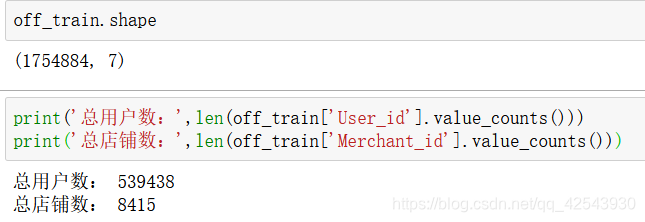
数据维度、总用户数和店铺数
可视化
j1m1 = off_train[(off_train['Date_received'].notnull()) & (off_train['Date'].notnull())].shape[0]
j0m1 = off_train[(off_train['Date_received'].isnull()) & (off_train['Date'].notnull())].shape[0]
j1m0 = off_train[(off_train['Date_received'].notnull()) & (off_train['Date'].isnull())].shape[0]
a = (Pie().add("juanmai",
               [list(z) for z in zip(['有优惠券购买商品', '无优惠券购买商品', '有优惠券不购买商品']
                                     ,[j1m1,j0m1,j1m0])])
        .set_series_opts(label_opts=opts.LabelOpts(formatter="{b}: {d}%"))
)
a.render_notebook()
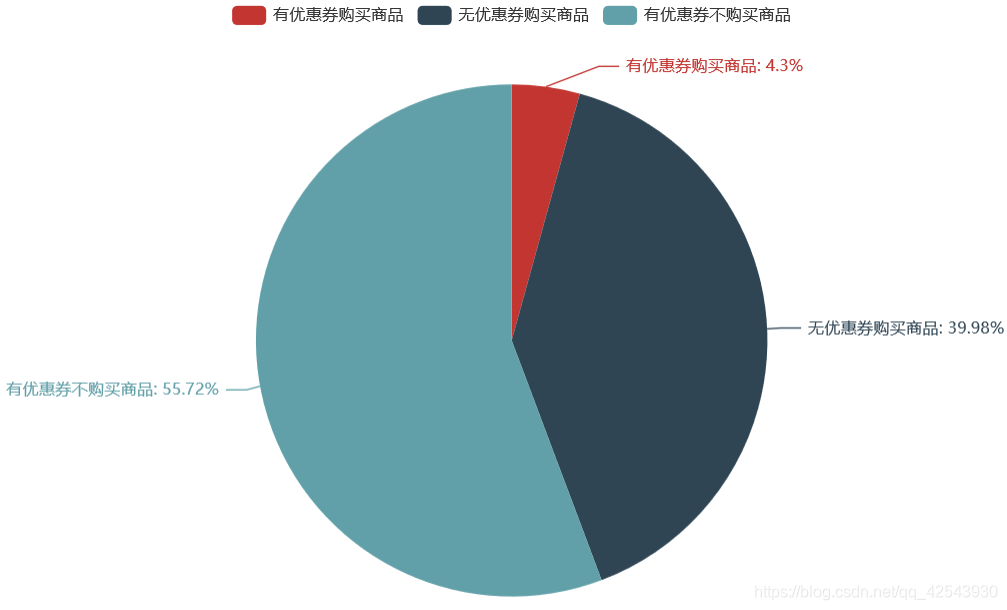
大部分人(701602)购买商品却没有使用优惠券,也有很多人(977900)有优惠券但却没有使用,真正使用优惠券购买商品的人(75382)很少!所以,优惠券的精准投放很重要。
#消费月份
x1=pd.DatetimeIndex(pd.to_datetime(off_train['Date'], format='%Y%m%d')).month.dropna().value_counts().sort_index().index.tolist()
x=[str(int(i)) for i in x1] #pyehchart需要字符类型
q = (Bar(init_opts=opts.InitOpts(width="600px",height="400px"))
     .add_xaxis(x)
    .add_yaxis('每月消费数量',pd.DatetimeIndex(date_buy_dt).month.dropna().value_counts().sort_index().tolist(),
               color='#48A43F',
#                areastyle_opts=opts.AreaStyleOpts(opacity=0.5)
              )
     .set_global_opts(xaxis_opts=opts.AxisOpts(name='month',name_location = "center",name_gap= 40))
    )
q.render_notebook()
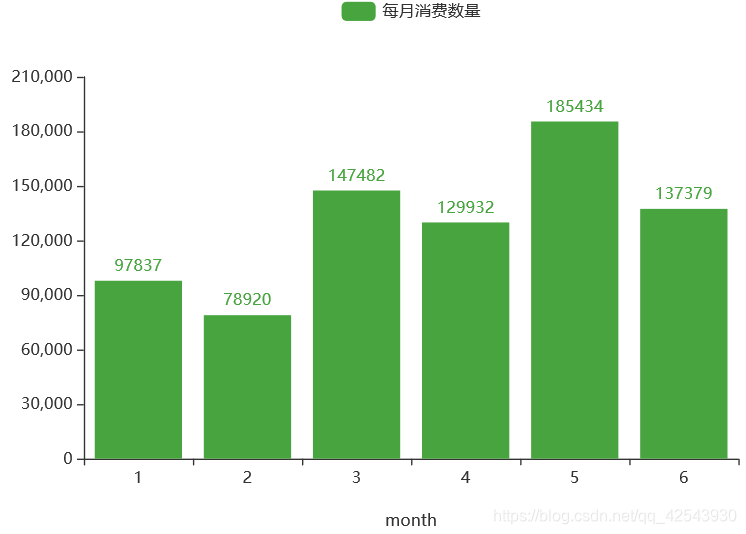
3月份-6月份的销售量比1、2月份高很多,需考虑是商户采取的运营策略导致的销量提高还是受季节影响。
off_copy1 = off_train.copy()
off_copy1['Date_received'] = pd.to_datetime(off_copy1['Date_received'],format='%Y%m%d')
off_copy1 = off_copy1.sort_values(by = 'Date_received')
off_copy1 = off_copy1.drop_duplicates(subset=['User_id'],keep='first')
off_copy1['receiver_mon'] = off_copy1['Date_received'].apply(lambda x:x.month)
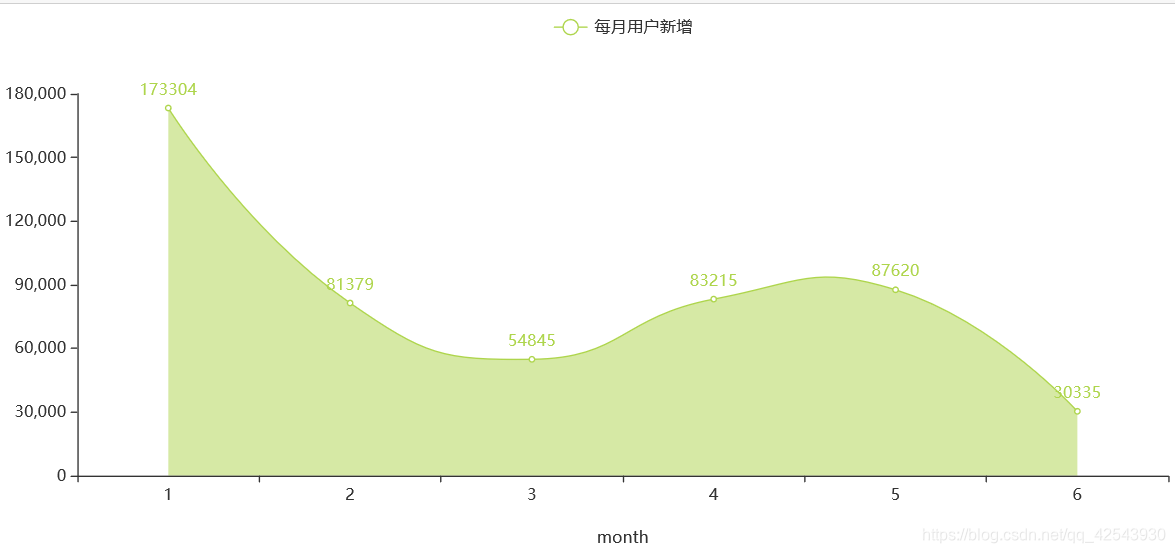
#用户新增月份
x1=off_copy1['receiver_mon'].value_counts().sort_index().index.tolist()
x=[str(int(i)) for i in x1] #pyehchart需要字符类型
q = (Line(init_opts=opts.InitOpts(width="1000px",height="400px"))
.add_xaxis(x)
.add_yaxis('每月用户新增',off_copy1['receiver_mon'].value_counts().sort_index().tolist(),
color = '#AED54C',
is_smooth=True,
areastyle_opts=opts.AreaStyleOpts(opacity=0.5)
)
.set_global_opts(xaxis_opts=opts.AxisOpts(name='month',name_location = "center",name_gap= 40))
)
q.render_notebook()
off_copy2 = off_train.copy()
off_copy2['Date_received'] = pd.to_datetime(off_copy1['Date_received'],format='%Y%m%d')
off_copy2['receiver_week'] = off_copy2['Date_received'].apply(lambda x:x.dayofweek+1)
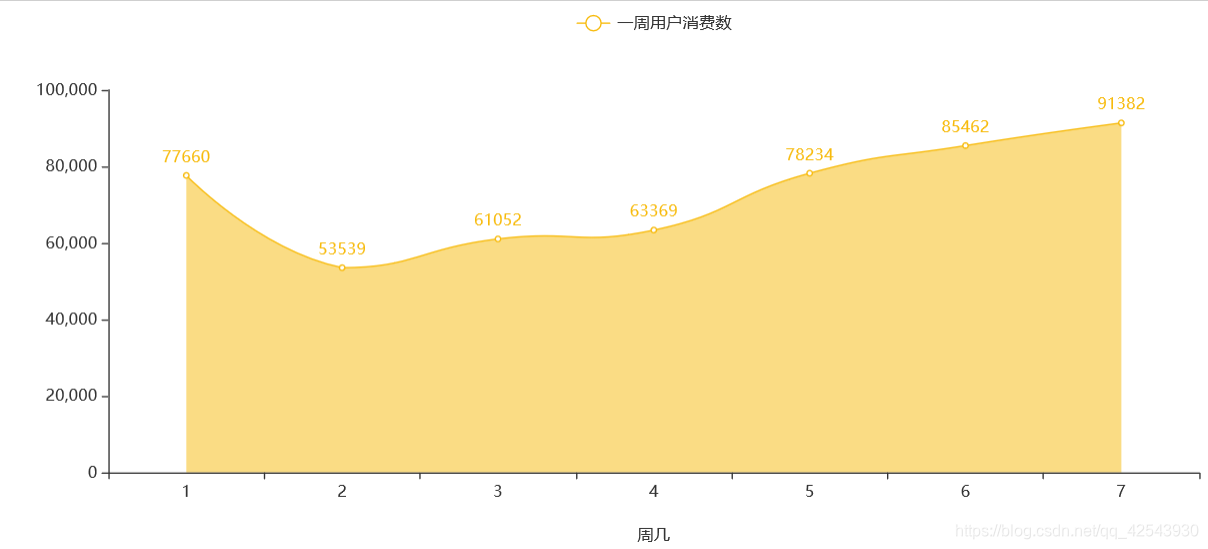
#一周用户消费数
x1=off_copy2['receiver_week'].value_counts().sort_index().index.tolist()
x=[str(int(i)) for i in x1] #pyehchart需要字符类型
q = (Line(init_opts=opts.InitOpts(width="1000px",height="400px"))
.add_xaxis(x)
.add_yaxis('一周用户消费数',off_copy2['receiver_week'].value_counts().sort_index().tolist(),
color = '#F7BA0B',
is_smooth=True,
areastyle_opts=opts.AreaStyleOpts(opacity=0.5)
)
.set_global_opts(xaxis_opts=opts.AxisOpts(name='周几',name_location = "center",name_gap= 40))
)
q.render_notebook()
off_copy3 = off_train.copy()
off_copy3['Date'] = pd.to_datetime(off_copy3['Date'],format='%Y%m%d')
off_copy3 = off_copy3.dropna(axis = 0,subset=['Date'])
off_copy3['Date_mon'] = off_copy3['Date'].apply(lambda x:x.month)
last_ = off_copy3.groupby('User_id').Date_mon.max().tolist()
fist_ = off_copy3.groupby('User_id').Date_mon.min().tolist()
num_consum = off_copy3.groupby('User_id').User_id.value_counts().values.tolist()
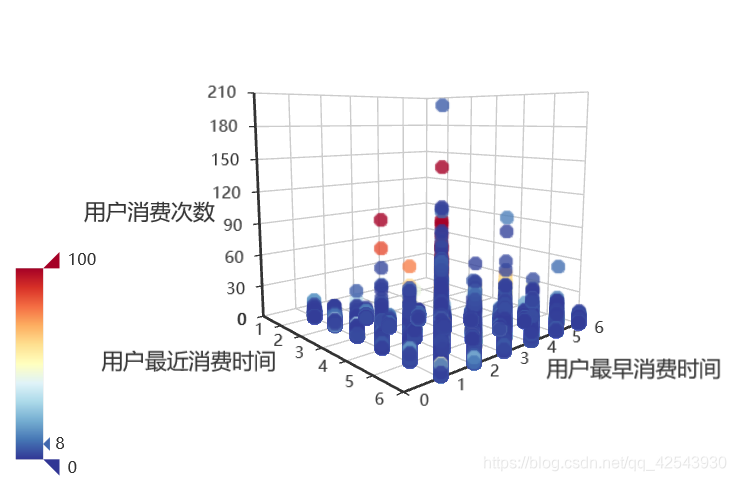
data_tulpe = list(zip(last_, fist_,num_consum))
name=["用户最近消费时间","用户最早消费时间","用户消费次数"]
scatter3D=Scatter3D(init_opts = opts.InitOpts(width='600px',height='400px')) #初始化
scatter3D.add(name,data_tulpe,xaxis3d_opts=opts.Axis3DOpts(
name='用户最近消费时间',
type_="value",
# textstyle_opts=opts.TextStyleOpts(color="#fff"),
),yaxis3d_opts=opts.Axis3DOpts(
name='用户最早消费时间',
type_="value",
# textstyle_opts=opts.TextStyleOpts(color="#fff"),
),zaxis3d_opts=opts.Axis3DOpts(
name='用户消费次数',
type_="value",
# textstyle_opts=opts.TextStyleOpts(color="#fff"),
),
grid3d_opts=opts.Grid3DOpts(
width=100, depth=100
))
scatter3D.set_global_opts(title_opts=opts.TitleOpts(title="散点图"),
visualmap_opts=opts.VisualMapOpts(
range_color=Faker.visual_color #颜色映射
))
scatter3D.render_notebook()
3.特征构建部分
# In[] null,na 特殊处理
def null_process_offline(dataset, predict=False):
    dataset.Distance.fillna(11, inplace=True)
    dataset.Distance = dataset.Distance.astype(int)
    dataset.Coupon_id.fillna(0, inplace=True)
    dataset.Coupon_id = dataset.Coupon_id.astype(int)
    dataset.Date_received.fillna(date_null, inplace=True)

    dataset[['discount_rate_x', 'discount_rate_y']] = dataset[dataset.Discount_rate.str.contains(':') == True][
        'Discount_rate'].str.split(':', expand=True).astype(int)
    dataset['discount_rate'] = 1 - dataset.discount_rate_y / dataset.discount_rate_x
    dataset.discount_rate = dataset.discount_rate.fillna(dataset.Discount_rate).astype(float)
    if predict:
        return dataset
    else:
        dataset.Date.fillna(date_null, inplace=True)
        return dataset


def null_process_online(dataset):
    dataset.Coupon_id.fillna(0, inplace=True)
    # online.Coupon_id = online.Coupon_id.astype(int)
    dataset.Date_received.fillna(date_null, inplace=True)
    dataset.Date.fillna(date_null, inplace=True)
    return dataset


# In[] 生成交叉训练集
def data_process(off_train, on_train, off_test):
    # train feature split
    # 交叉训练集一:收到券的日期大于4月14日和小于5月14日
    time_range = ['2016-04-16', '2016-05-15']
    dataset1 = off_train[(off_train.Date_received >= time_range[0]) & (off_train.Date_received <= time_range[1])].copy()
    dataset1['label'] = 0
    dataset1.loc[
        (dataset1.Date != date_null) & (
最低0.47元/天 解锁文章


 被折叠的 条评论
为什么被折叠?
被折叠的 条评论
为什么被折叠?
 到【灌水乐园】发言


