


一、部署 Filebeat
10.0.0.37 安装 filebeat
apt install -y openjdk-8-jdk

# 将 filebeat-7.12.1-amd64.deb 软件包传到 /usr/local/src 目录下,并进行安装
dpkg -i /usr/local/src/filebeat-7.12.1-amd64.deb
二、Filebeat -> Redis -> Logstash -> ES
2.1 Filebeat 配置:Nginx 日志文件输出到 Redis
root@web1:/usr/local/src# grep -v "#" /etc/filebeat/filebeat.yml | grep -v "^$"
filebeat.inputs:
- type: log
  enabled: true
  paths:
    - /var/log/syslog
  fields:
    type: syslog
- type: log
  enabled: true
  paths:
    - /apps/nginx/logs/error.log
  fields:
    service: nginx-errorlog
filebeat.config.modules:
  path: ${path.config}/modules.d/*.yml
  reload.enabled: false
setup.template.settings:
  index.number_of_shards: 1
setup.kibana:
#output.elasticsearch:
#  hosts: ["10.0.0.31:9200"]

output.redis:
  host: ["10.0.0.35"]
  passwd: "123456"
  key: "lck-nginx"
  db: 0
  timeout: 5

processors:
  - add_host_metadata:
      when.not.contains.tags: forwarded
  - add_cloud_metadata: ~
  - add_docker_metadata: ~
  - add_kubernetes_metadata: ~

# 启动服务
systemctl restart filebeat
2.2 Logstash 配置:从 Redis 拉取到 elasticsearch
root@ubuntu1804:~# vim /etc/logstash/conf.d/redis-to-es.conf
input {
  redis {
    data_type => "list"
    key => "lck-nginx"
    host => "10.0.0.34"
    port => "6379"
    db => "1"
    password => "123456"
    threads => "4"
  }
}

output {
  if [fields][service] == "nginx-errorlog" {
    elasticsearch {
      hosts => ["10.0.0.31:9200"]
      index => "filebeat-nginx-errorlog-%{+YYYY.MM.dd}"
    }
  }
  if [fields][type] == "syslog" {
    elasticsearch {
      hosts => ["10.0.0.31:9200"]
      index => "filebeat-nginx-syslog-%{+YYYY.MM.dd}"
    }
  }
}

# 重启服务
systemctl restart logstash
三、Filebeat -> Kafka -> Logstash -> ES
3.1 Filebeat 配置:Nginx 日志文件输出到 Kafka
vim /etc/filebeat/filebeat.yml
- type: log
  enabled: true
  paths:
    - /var/log/syslog
  fields:
    type: syslog

- type: log
  enabled: true
  paths:
    - /apps/nginx/logs/error.log
  fields:
    service: nginx-errorlog

- type: log
  enabled: true
  paths:
    - /var/log/nginx/access.log
  fields:
    service: nginx-accesslog

output.kafka
  host: ["10.0.0.40:9092","10.0.0.41:9092","10.0.0.42:9092"]
  topic: '%{[fields.log_topic]}'
  partition.round_robin:
    reachable_only: false
    required_acks: 1
    compression: gzip
    max_message_bytes: 1000000

# 启动服务
systemctl restart filebeat
3.2 Logstash 配置:从 Kafka 拉取到 elasticsearch
root@ubuntu1804:~# vim /etc/logstash/conf.d/kafka-to-es.conf
input {
  kafka {
    bootstrap_servers => "10.0.0.40:9092,10.0.0.41:9092,10.0.0.42:9092"
    topics => ["lck-nginx-accesslog","lck-nginx-errorlog"]
    codec => "json"
  }
}

output {
  if [fields][service] == "nginx-errorlog" {
    elasticsearch {
      hosts => ["10.0.0.31:9200"]
      index => "filebeat-nginx-errorlog-%{+YYYY.MM.dd}"
    }
  }
  if [fields][type] == "syslog" {
    elasticsearch {
      hosts => ["10.0.0.31:9200"]
      index => "filebeat-nginx-syslog-%{+YYYY.MM.dd}"
    }
  }
}
四、Filebeat -> Logstash -> Redis -> Logstash -> ES
因为 filebeat 无法处理 JSON 格式的数据,我们利用 logstash 来处理带有 JSON 格式的数据

4.1 Filebeat 配置:Nginx 日志文件输出到 Logstash
vim /etc/filebeat/filebeat.yml
- type: log
  enabled: true
  paths:
    - /var/log/syslog
  fields:
    type: syslog

- type: log
  enabled: true
  paths:
    - /apps/nginx/logs/error.log
  fields:
    service: nginx-errorlog

- type: log
  enabled: true
  paths:
    - /var/log/nginx/access.log
  fields:
    service: nginx-accesslog

output.logstash
  host: ["10.0.0.36:5044"]

# 启动服务
systemctl restart filebeat
4.2 Logstash配置:将 filebeat 发送过来的数据传输到 Redis
vim /etc/logstash/conf.d/filebeat-to-redis.conf
input {
  beats {
    port => 5044
    codec => "json"
  }
}

output {
  if [fields][type] == "syslog" {
    redis {
      data_type => "list"
      key => "lck-syslog"
      host => "10.0.0.34"
      port => "6379"
      db => "1"
      password => "123456"
    }
  }
  if [fields][service] == "nginx-errorlog" {
    redis {
      data_type => "list"
      key => "lck-nginx-errorlog"
      host => "10.0.0.34"
      port => "6379"
      db => "1"
      password => "123456"
    }
  }
  if [fields][service] == "nginx-accesslog" {
    redis {
      data_type => "list"
      key => "lck-nginx-accesslog"
      host => "10.0.0.34"
      port => "6379"
      db => "1"
      password => "123456"
    }
  }
}

# 检查配置文件语法是否正确
/usr/share/logstash/bin/logstash -f /etc/logstash/conf.d/filebeat-to-redis.conf -t

# 启动服务
systemctl restart logstash

# 在 Redis 查看数据
redis-cli
select 1
4.3 Logstash配置:将 Redis 数据数据传输到 elasticsearch
root@ubuntu1804:~# vim /etc/logstash/conf.d/redis-to-es.conf
input {
  redis {
    data_type => "list"
    key => "lck-syslog"
    host => "10.0.0.34"
    port => "6379"
    db => "1"
    password => "123456"
    threads => "4"
  }
  redis {
    data_type => "list"
    key => "lck-nginx-accesslog"
    host => "10.0.0.34"
    port => "6379"
    db => "1"
    password => "123456"
    threads => "4"
  }
    redis {
    data_type => "list"
    key => "lck-nginx-errorlog"
    host => "10.0.0.34"
    port => "6379"
    db => "1"
    password => "123456"
    threads => "4"
  }
}

output {
    if [type] == "syslog" {
    elasticsearch {
      hosts => ["10.0.0.31:9200"]
      index => "logstash-nginx-syslog-%{+YYYY.MM.dd}"
    }
  }
  if [type] == "nginx-accesslog" {
    elasticsearch {
      hosts => ["10.0.0.31:9200"]
      index => "logstash-nginx-accesslog-%{+YYYY.MM.dd}"
    }
  }
  if [type] == "nginx-errorlog" {
    elasticsearch {
      hosts => ["10.0.0.31:9200"]
      index => "logstash-nginx-errorlog-%{+YYYY.MM.dd}"
    }
  }
}

# 注意事项:index的字段中,logstash开头表示可以显示客户端IP归属地,在es中地图可以查看

# 检查配置文件语法是否正确
/usr/share/logstash/bin/logstash -f /etc/logstash/conf.d/redis-to-es.conf -t

# 启动服务
systemctl restart logstash
五、Filebeat -> Logstash -> Kafka -> Logstash -> ES
5.1 Filebeat 配置:Nginx 日志文件输出到 Logstash
vim /etc/filebeat/filebeat.yml
- type: log
  enabled: true
  paths:
    - /var/log/syslog
  fields:
    type: syslog

- type: log
  enabled: true
  paths:
    - /apps/nginx/logs/error.log
  fields:
    service: nginx-errorlog

- type: log
  enabled: true
  paths:
    - /var/log/nginx/access.log
  fields:
    service: nginx-accesslog

output.logstash
  hosts: ["10.0.0.36:5044","10.0.0.36:5045"]
  enabled: true
  worker: 1
  compression_level: 3
  loadbalance: true

# 启动服务
systemctl restart filebeat

# 查看服务是否启动
systemctl status filebeat.service
5.2 Logstash配置:将 filebeat 发送过来的数据传输到 Kafka
vim /etc/logstash/conf.d/filebeat-to-kafka.conf
input {
  beats {
    port => 5044
    codec => "json"
  }
}

output {
  if [fields][type] == "syslog" {
    kafka {
      bootstrap_servers => "10.0.0.40:9092,10.0.0.41:9092,10.0.0.42:9092"
      topic_id => "lck-50-syslog"
      codec => "json"
    }
  }
  if [fields][service] == "nginx-errorlog" {
    kafka {
      bootstrap_servers => "10.0.0.40:9092,10.0.0.41:9092,10.0.0.42:9092"
      topic_id => "lck-50-nginx-aerrorlog"
      codec => "json"
    }
  }
  if [fields][service] == "nginx-accesslog" {
    kafka {
      bootstrap_servers => "10.0.0.40:9092,10.0.0.41:9092,10.0.0.42:9092"
      topic_id => "lck-50-nginx-accesslog"
      codec => "json"
    }
  }
}

# 检查配置文件语法是否正确
/usr/share/logstash/bin/logstash -f /etc/logstash/conf.d/filebeat-to-kafka.conf -t

# 启动服务
systemctl restart logstash
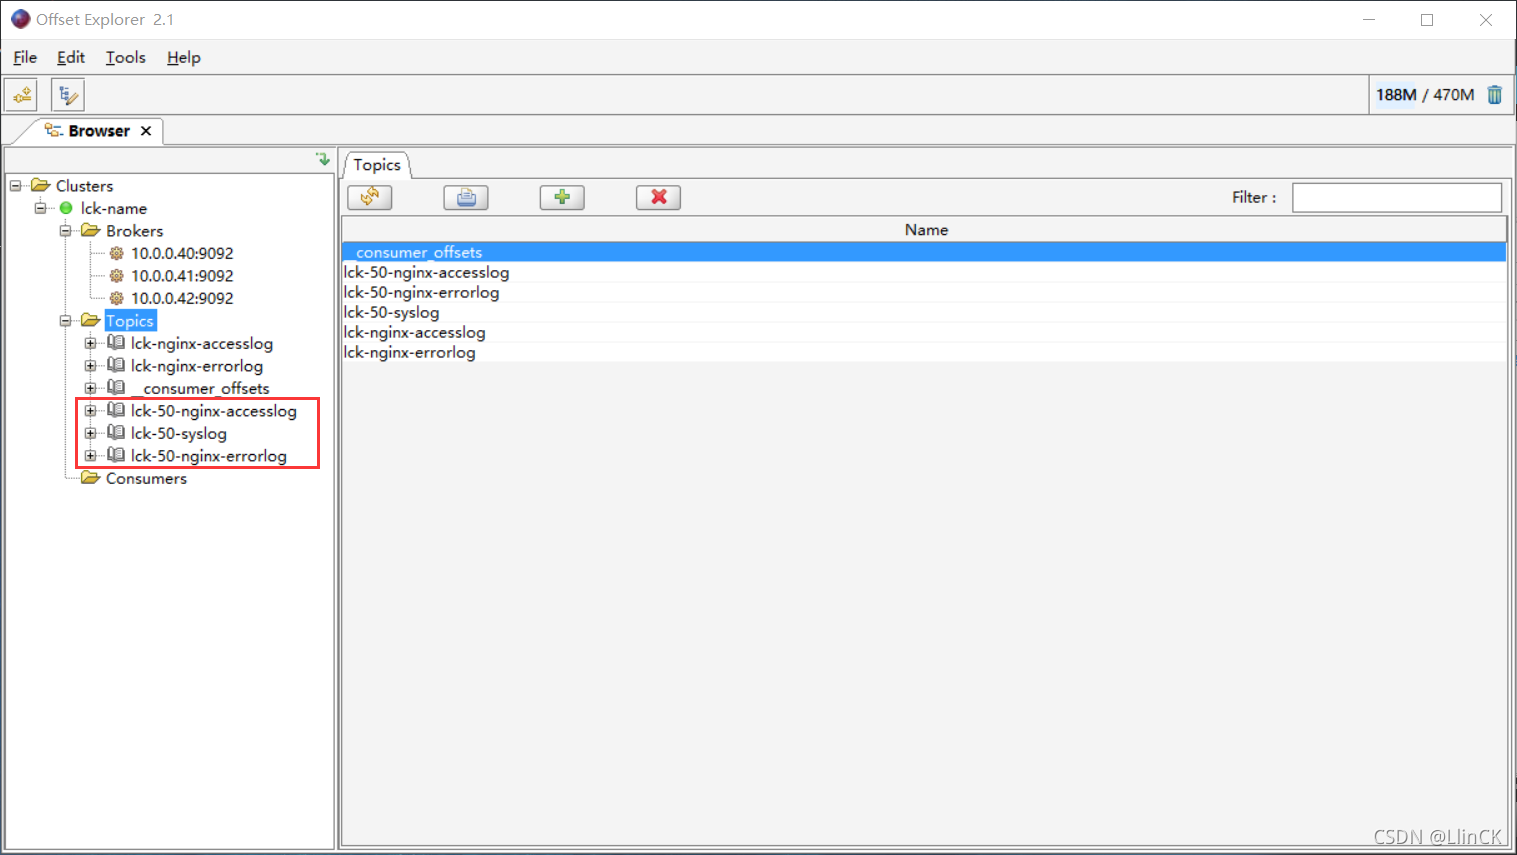
查看kafka是否有数据
5.3 Logstash配置:将 Kafka 数据数据传输到 elasticsearch
root@ubuntu1804:~# vim /etc/logstash/conf.d/kafka-to-es.conf
input {
  kafka {
    bootstrap_servers => "10.0.0.40:9092,10.0.0.41:9092,10.0.0.42:9092"
    topics => ["lck-50-syslog","lck-50-nginx-errorlog","lck-50-nginx-accesslog"]
    codec => "json"
  }
}

output {
    if [fields][type] == "syslog" {
    elasticsearch {
      hosts => ["10.0.0.31:9200"]
      index => "kafka-0901-syslog-%{+YYYY.MM.dd}"
    }
  }
  if [fields][service] == "nginx-accesslog" {
    elasticsearch {
      hosts => ["10.0.0.31:9200"]
      index => "kafka-0901-nginx-accesslog-%{+YYYY.MM.dd}"
    }
  }
  if [fields][service] == "nginx-errorlog" {
    elasticsearch {
      hosts => ["10.0.0.31:9200"]
      index => "lkafka-0901-nginx-errorlog-%{+YYYY.MM.dd}"
    }
  }
}

# 注意事项:index的字段中,logstash开头表示可以显示客户端IP归属地,在es中地图可以查看

# 检查配置文件语法是否正确
/usr/share/logstash/bin/logstash -f /etc/logstash/conf.d/kafka-to-es.conf -t

# 启动服务
systemctl restart logstash
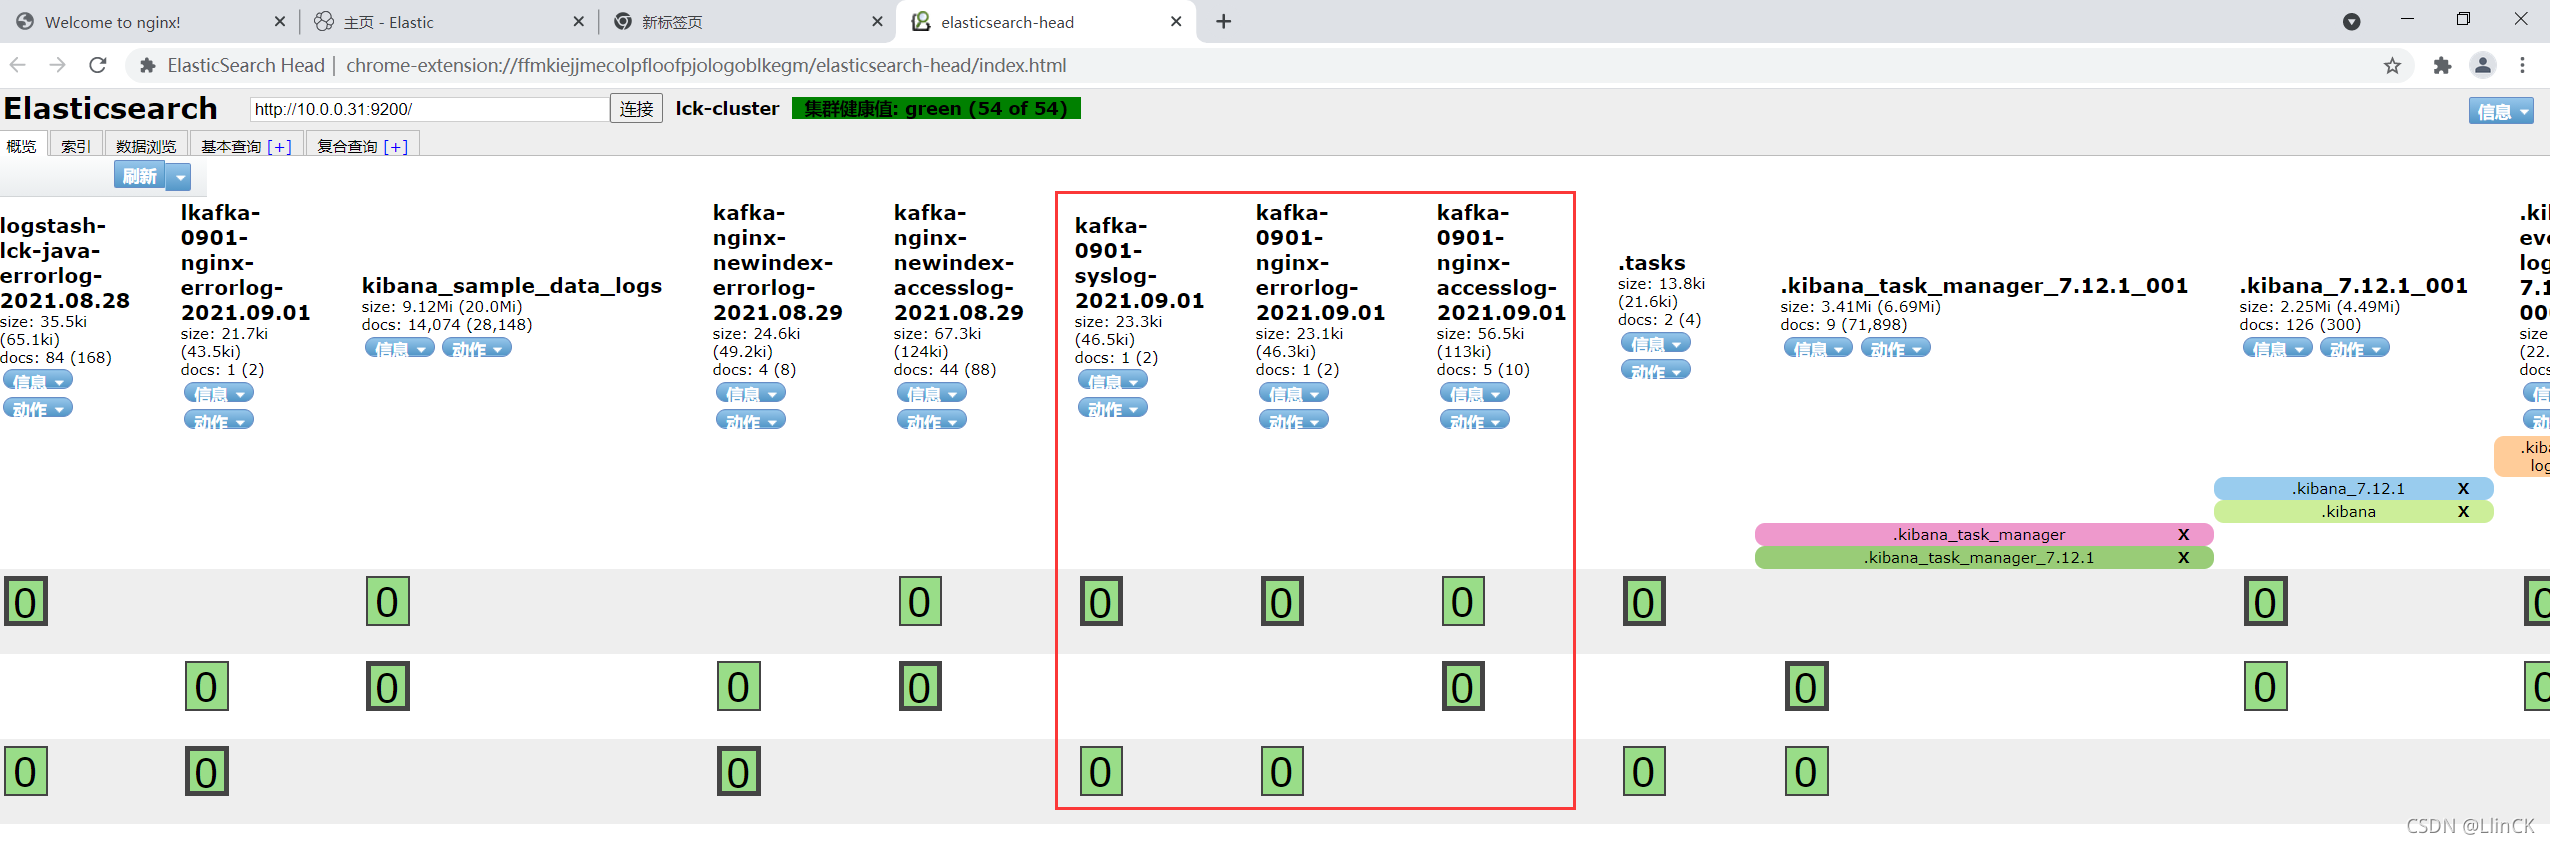
验证数据是否写入 elasticsearch


 1892
1892


 被折叠的 条评论
为什么被折叠?
被折叠的 条评论
为什么被折叠?
 到【灌水乐园】发言


