


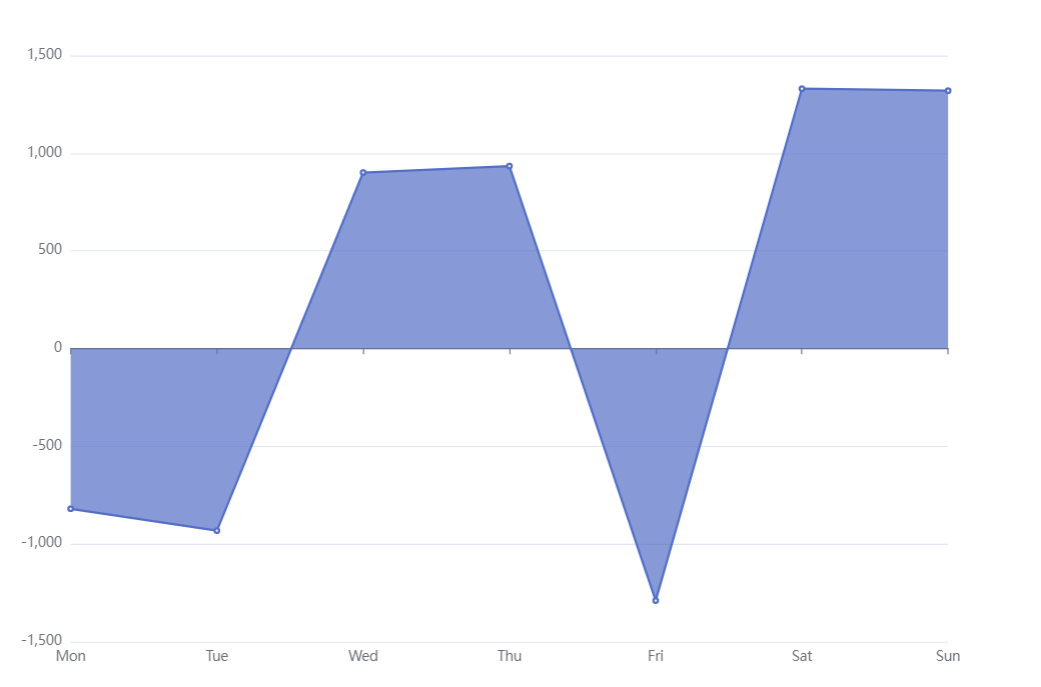
当数值为负数时,areaStyle会出现在上方,如下图:
option = {
  xAxis: {
    type: 'category',
    boundaryGap: false,
    data: ['Mon', 'Tue', 'Wed', 'Thu', 'Fri', 'Sat', 'Sun']
  },
  yAxis: {
    type: 'value'
  },
  series: [
    {
      data: [-820, -932, 901, 934, -1290, 1330, 1320],
      type: 'line',
      areaStyle: {
      }
    }
  ]
};
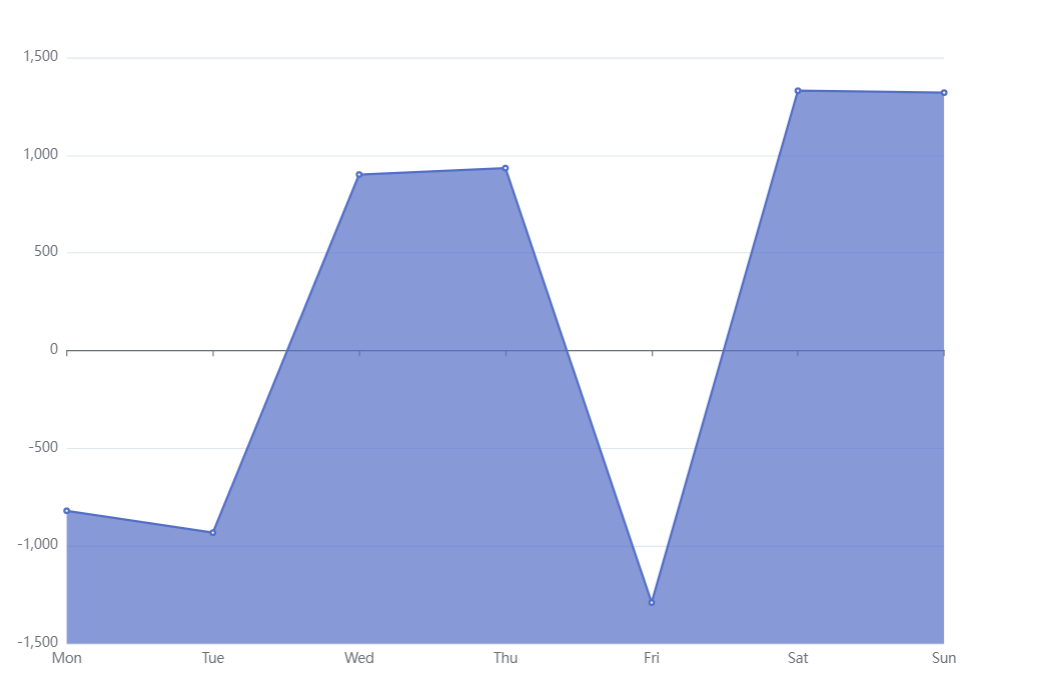
想areaStyle一直位于折线图下方,在 areaStyle 属性中增加属性: origin: ‘start’
option = {
  xAxis: {
    type: 'category',
    boundaryGap: false,
    data: ['Mon', 'Tue', 'Wed', 'Thu', 'Fri', 'Sat', 'Sun']
  },
  yAxis: {
    type: 'value'
  },
  series: [
    {
      data: [-820, -932, 901, 934, -1290, 1330, 1320],
      type: 'line',
      areaStyle: {
        origin: 'start'
      }
    }
  ]
};
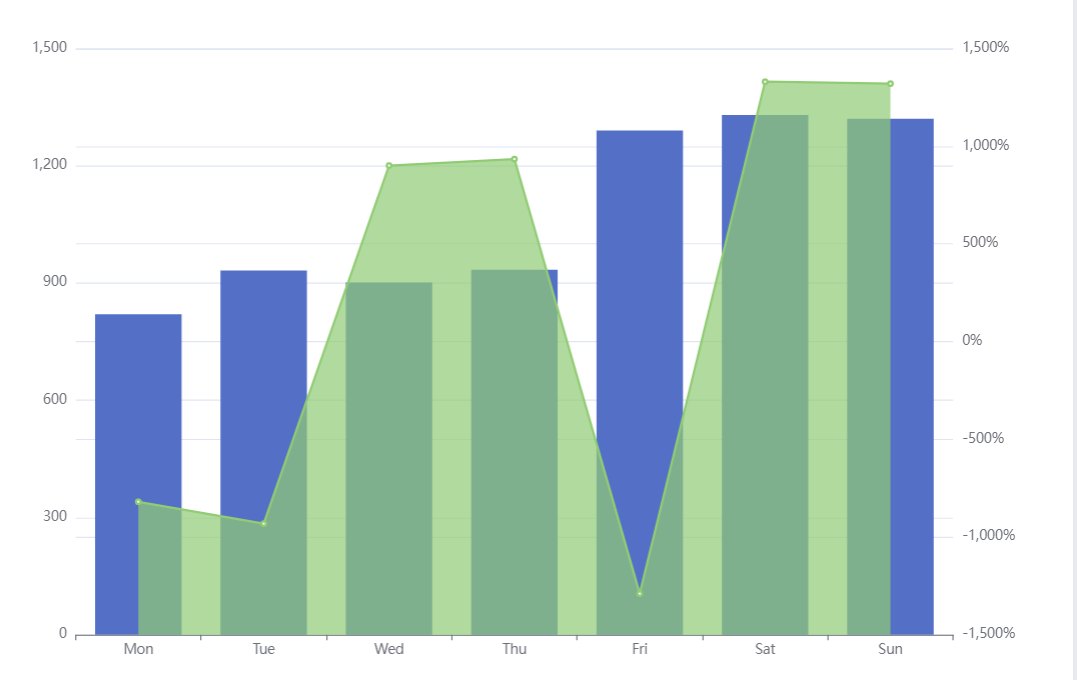
柱状图结合折线图的情况
option = {
  xAxis: {
    type: 'category',
    data: ['Mon', 'Tue', 'Wed', 'Thu', 'Fri', 'Sat', 'Sun']
  },
  yAxis: [
    {
      type: 'value'
    },
    {
      type: 'value',
      axisLabel: {
        formatter: '{value}%'
      }
    }
  ],
  series: [
    {
      data: [820, 932, 901, 934, 1290, 1330, 1320],
      type: 'bar'
    },
    {
      yAxisIndex: 1,
      data: [-820, -932, 901, 934, -1290, 1330, 1320],
      type: 'line',
      areaStyle: {
        origin: 'start'
      }
    }
  ]
};


 1万+
1万+


 被折叠的 条评论
为什么被折叠?
被折叠的 条评论
为什么被折叠?
 到【灌水乐园】发言


