


水球图不是echarts内置组件,需要安装
搭配vue-echarts组件,该组件可以省略很多开发echarts图表的重复操作,如果init,setOptions等
npm install echarts
npm install echarts-liquidfill
npm install vue-echarts
官方文档地址
https://github.com/ecomfe/echarts-liquidfill
vue项目main.js中导入
import "echarts";
import "echarts-liquidfill";
import Echarts from "vue-echarts";
...
import { createApp } from "vue";
import App from "./App.vue";
const app = createApp(App);
app.component("VChart", Echarts);
...
app.mount("#app");
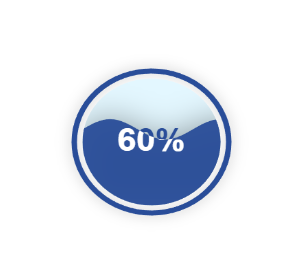
vue页面中使用基础水球
<template>
  <article class="chart">
    <v-chart class="chartDom" :option="option" ref="vchart" />
  </article>
</template>
<script setup lang="ts">
const option = ref({
    series: [{
        type: 'liquidFill',
        data: [0.6],
    }]
});
</script>
<style lang="scss" scoped>
.chart{
  width: 500px;
  height: 300px;
}
.chartDom {
  width: 100%;
  height: 100%;
}
</style>
多波纹
option = {
    series: [{
        type: 'liquidFill',
        data: [0.6, 0.5, 0.4, 0.3]
    }]
};
所有示例可以看官方文档
https://github.com/ecomfe/echarts-liquidfill


 341
341


 被折叠的 条评论
为什么被折叠?
被折叠的 条评论
为什么被折叠?
 到【灌水乐园】发言


