


0.关于代码内容和前置知识学习
1.背景
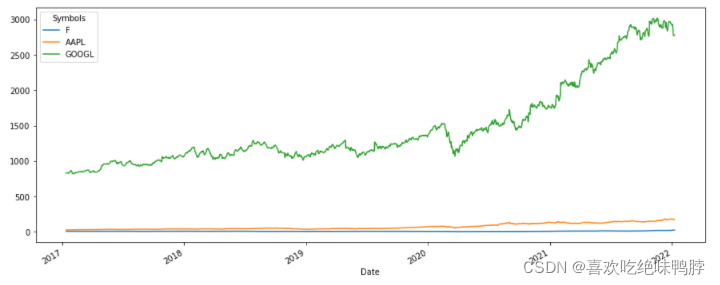
将使用 Google、Facebook 和 Alphabet 的股票进行任务。
2.获取数据
%matplotlib inline

import numpy as np
import pandas as pd
import matplotlib.pylab as plt

from tsfresh import extract_features, select_features
from tsfresh.utilities.dataframe_functions import roll_time_series, make_forecasting_frame
from tsfresh.utilities.dataframe_functions import impute

try:
    import pandas_datareader.data as web
except ImportError:
    print("You need to install the pandas_datareader. Run pip install pandas_datareader.")

from sklearn.ensemble import AdaBoostRegressor
读取数据
df = web.DataReader(['F', "AAPL", "GOOGL"], 'stooq')["High"]
df.head()


plt.figure(figsize=(15, 6))
df.plot(ax=plt.gca())
plt.show()
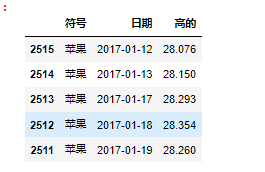
需要确保在重新排序时保留股票代码信息:
df_melted = df.copy()
df_melted["date"] = df_melted.index
df_melted = df_melted.melt(id_vars="date", value_name="high").sort_values(["Symbols", "date"])
df_melted = df_melted[["Symbols", "date", "high"]]

df_melted.head()
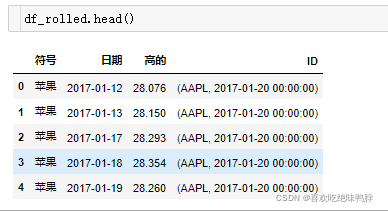
3.创建训练样本
df_rolled = roll_time_series(df_melted, column_id="Symbols", column_sort="date",
                             max_timeshift=20, min_timeshift=5)
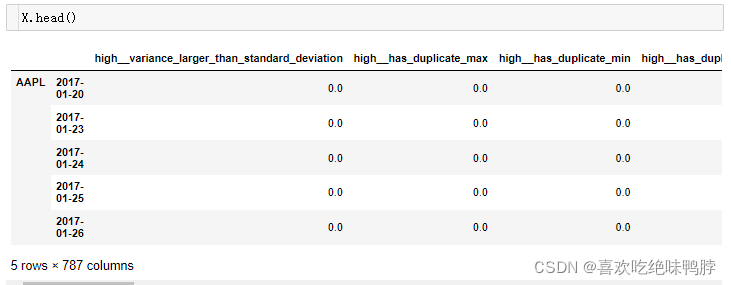
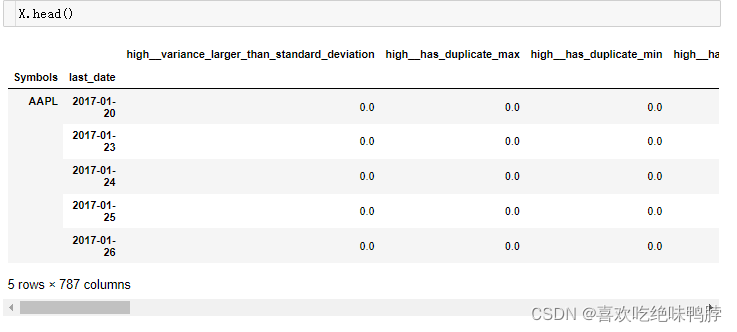
4.提取特征
X = extract_features(df_rolled.drop("Symbols", axis=1),
                     column_id="id", column_sort="date", column_value="high",
                     impute_function=impute, show_warnings=False)
通过给数据一个多索引而不是元组索引,让数据更容易处理:
# split up the two parts of the index and give them proper names
X = X.set_index([X.index.map(lambda x: x[0]), X.index.map(lambda x: x[1])], drop=True)
X.index.names = ["Symbols", "last_date"]
5. 特征选择 与建模预测
如果你不习惯pandas 转换,下一行可能看起来像魔术,但它做的是:
或将每只股票分别编号:
- 按date排列
- 以higt为index
- 向未来移动1个时间步
- 引入与上面X相同的多索引格式
(1)数据准备
y = df_melted.groupby("Symbols").apply(lambda x: x.set_index("date")["high"].shift(-1)).T.unstack()
一致性测试,查看是否一致:
y["AAPL", pd.to_datetime("2020-07-13")], df.loc[pd.to_datetime("2020-07-14"), "AAPL"]
y = y[y.index.isin(X.index)]
X = X[X.index.isin(y.index)]
(2)拆分数据
分解为train和test样本的工作原理与单个标识符相同,但这一次我们有一个多索引符号-日期,因此loc调用看起来更复杂一些。
X_train = X.loc[(slice(None), slice(None, "2018")), :]
X_test = X.loc[(slice(None), slice("2019", "2020")), :]

y_train = y.loc[(slice(None), slice(None, "2018"))]
y_test = y.loc[(slice(None), slice("2019", "2020"))]
(3)特征选择
X_train_selected = select_features(X_train, y_train)
(4)建模:为每个股票分别训练一个回归器
adas = {stock: AdaBoostRegressor() for stock in ["AAPL", "F", "GOOGL"]}

for stock, ada in adas.items():
    ada.fit(X_train_selected.loc[stock], y_train.loc[stock])
(5)预测【测试集评估】
#特征选择
X_test_selected = X_test[X_train_selected.columns]

y_pred = pd.concat({
    stock: pd.Series(adas[stock].predict(X_test_selected.loc[stock]), index=X_test_selected.loc[stock].index)
    for stock in adas.keys()
})
y_pred.index.names = ["Symbols", "last_date"]
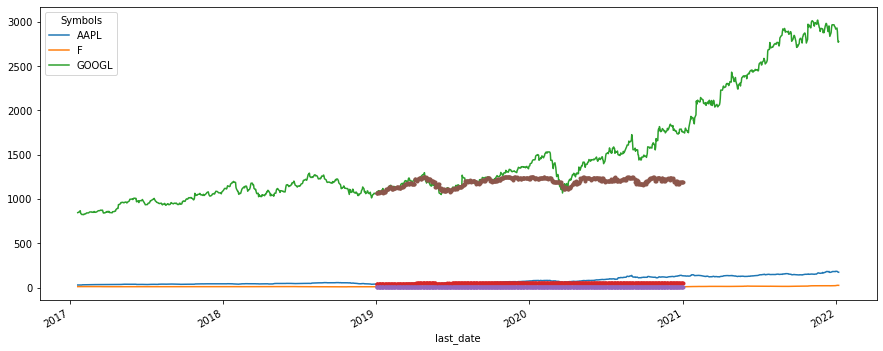
绘制图形:
plt.figure(figsize=(15, 6))

y.unstack("Symbols").plot(ax=plt.gca())
y_pred.unstack("Symbols").plot(ax=plt.gca(), legend=None, marker=".")


 被折叠的 条评论
为什么被折叠?
被折叠的 条评论
为什么被折叠?
 到【灌水乐园】发言


