


1. 目的:预测红酒的品质(0-10)
- 0:代表最差
- 10:代表最好
2. Exporing the data
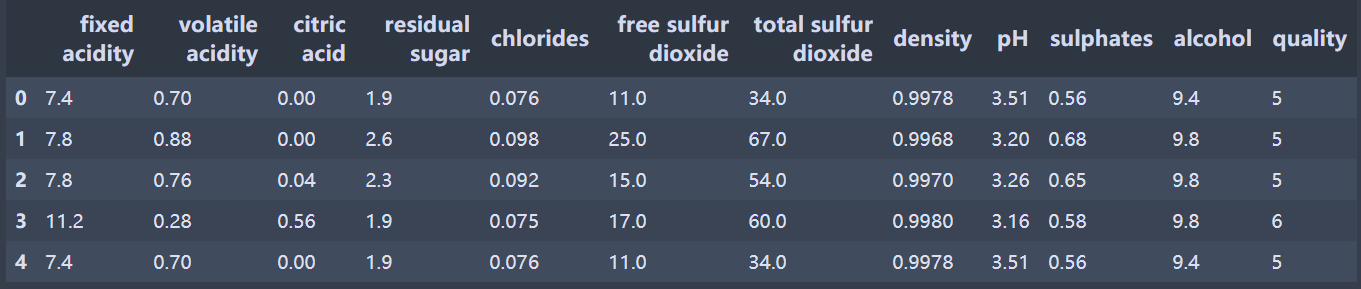
导入数据:
#wine-red线性回归
import pandas as pd
df = pd.read_csv('G:/机器学习/Linear regression/data/winequality-red.csv', sep=';')
df.head()
描述统计(部分):
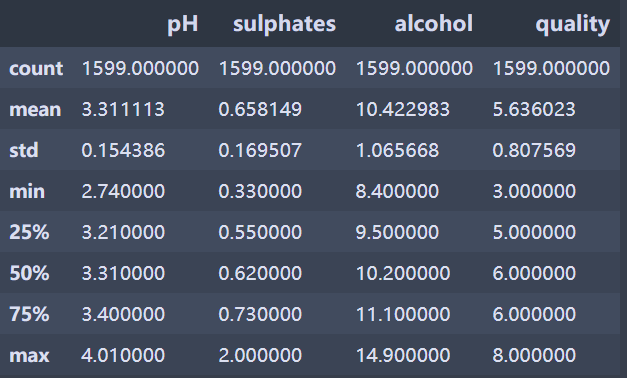
Note the summary for the quality variable; most of the wines scored five or six.
可视化:
Visualizaing the data can help indicate if relationships exist between the response variable and the explanatory variables.
#可视化
import matplotlib.pyplot as plt
%matplotlib

plt.scatter(df['alcohol'], df['quality'])
plt.xlabel('Alcohol')
plt.ylabel('Quality')
plt.title('Alcohol Against Quality')
plt.show()

从上图可以看出:酒精含量和红酒品质之间存在微弱的正相关关系,酒精含量较高的红酒往往品质也不错。
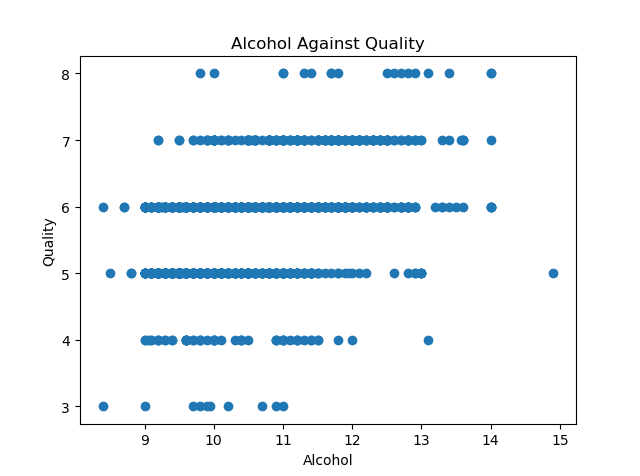
而挥发性酸度和红酒品质之间存在负相关关系。
The response variable depends on multiple explanatory variables, so we can model the relationship with multiple linear regression.
But, how can we decide which explanatory variables to include in the model?:Dtaframe.corr()
例如,我们可以看出,红酒品质与酒精含量呈正比,与挥发性酸度呈反比。可以假设,好的红酒往往酒精含量较高,并且尝起来和醋的味道差很多。
3.Fitting and evaluating the model
#模型拟合和评价
from sklearn.linear_model import LinearRegression
import pandas as pd
import matplotlib.pyplot as plt
from sklearn.model_selection import train_test_split
%matplotlib

X = df[list(df.columns)[:-1]] #除了最后一列
y = df['quality']
X_train, X_test, y_train, y_test = train_test_split(X, y) #拆分数据

#拟合模型
regressor = LinearRegression() #封装
regressor.fit(X_train, y_train) #训练模型
y_predictions = regressor.predict(X_test) #模型预测
print('R-squared:', regressor.score(X_test, y_test))

输出结果:
R-squared: 0.32316893200467756
The r-squared socre of 0.35 indicates that 35 percent of the variance in the test set is explained by the mode. The performance might change if a diffefrent 75 percent of the data is partitioned to the training set.We can use cross-validation(交叉验证) to produce a better estimate of the estimator’s performance.
#交叉验证
from sklearn.model_selection import cross_val_score
scores = cross_val_score(regressor, X, y, cv=5) #5折
print(scores.mean(),scores)

输出结果:
0.2900416288421962 [0.13200871 0.31858135 0.34955348 0.369145   0.2809196 ]
corss_val_score:交叉验证函数cv=5:随机分为5个子集,每个子集都会用来训练和检验模型
The r-squared scores range from 0.13 to 0.36. The mean of the socres, 0.29, is a better estimator of the estimator’s predictive power than the r-squared score produced from a single train/test split.
plt.scatter(y_test, y_predictions)
plt.xlabel('True Quality')
plt.ylabel('Predicted Quality')
plt.title('Predicted Quality Against True Quality')
plt.show()
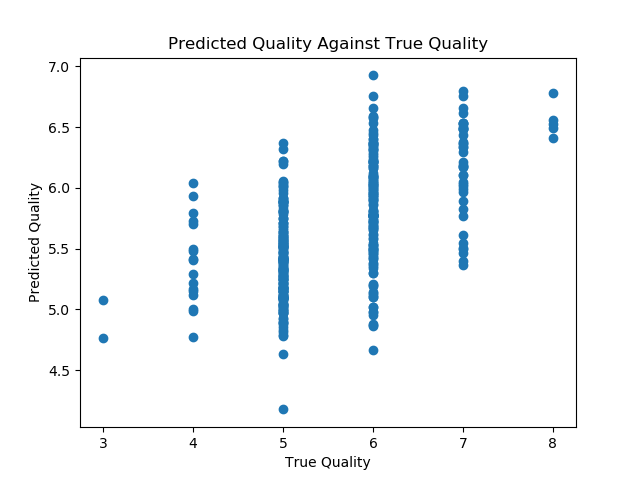
As expected, few predictions exactly match the true values of the response variable. The model is also better at predicting the qualities of average wines, since most of the training data is for average wines.
4.Fitting models with gradient descent
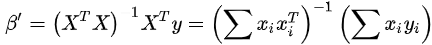
The equation can minimize the cost function
但是当数据集比较大的时候,计算量复杂,而且 X T X X^{T}X XTX在行列式不为0的情况下不可逆,这时候我们需要采用另一种更有效的估计方法:Gradient Descent(an optimization algorithm that can be used to estimate the local minimum of a function)。
Gradient descent is sometimes described by the analogy of a blindfolded man who is trying to find his way from somewhere on a mountainside to the lowest point of the valley. He cannot see the topography, so he takes a step in the direction with the steepest decline. He then takes another step, again in the direction with the steepest decline.
The sizes of his steps are proportional to the steepness of the terrain at his current position.
- he takes big steps when the terrain is steep, as he is confident that he is still near the peak and that he will not overshoot the valley’s lowest point.
- he takes smaller steps as the terrain becomes less steep. If he were to continue taking large steps, he may accidentally step over the valley’s lowest point.
By taking decreasingly large steps, he can avoid stepping back and forth over the valley’s lowest point. The blindfolded man continues to walk until he cannot take a step that will decrease his altitude; at that point, he has found the bottom of the valley.
Gradient descent iteratively updates the values of the model’s parameters by calculating the partial derivative (偏导数)of the cost function at each seop.
For the number of training instances that are used to update the model parameters in each training iteration:
- Batch gradient descent:使用训练集所有个例调参
- Stochastic Gradient Descent(SGD):每次迭代只使用一个训练个例,通常是随机抽样的
在训练集数据量比较大的情况下,SGD更快;BGD是确定性算法,SGD每次可能会产生不同的参数;而且SGD也可能不会使损失函数最小。
补充概念:
- Learing rate:controls the size of the steps
- convex cost function:凸成本函数,只有一个局部最低点
- non-convex cost funciton:非凸成本函数,多个局部最低点,一个全局最低点
- the partial derivative of the cost function:偏导数
- the local minimum:局部最小
- determinant:行列式
波士顿房价(13个解释变量):
#SGD
#导入相关库
import numpy as np
from sklearn.datasets import load_boston
from sklearn.linear_model import SGDRegressor
from sklearn.model_selection import cross_val_score
from sklearn.model_selection import train_test_split
from sklearn.preprocessing import StandardScaler

#拆分数据
data = load_boston()
X_train, X_test, y_train, y_test = train_test_split(data.data, data.target)

#数据标准化
X_scaler = StandardScaler()
y_scaler = StandardScaler()
X_train = X_scaler.fit_transform(X_train)
y_train = y_scaler.fit_transform(y_train.reshape(-1,1))
X_test = X_scaler.transform(X_test)
y_test = y_scaler.transform(y_test.reshape(-1,1))

#训练数据集
regressor = SGDRegressor(loss='squared_loss')
scores = cross_val_score(regressor, X_train, y_train.ravel(), cv=5) #交叉验证
print('Cross validation r-squared scores: ',scores)
print('Average cross validation r-squared score: ',np.mean(scores))
regressor.fit(X_train, y_train.ravel())
print('Test set r-squared score: ',regressor.score(X_test, y_test.ravel()))

输出结果:
Cross validation r-squared scores:  [0.67692394 0.67511692 0.80789127 0.75636243 0.6417743 ]
Average cross validation r-squared score:  0.7116137721513184
Test set r-squared score:  0.6698759114606401
注:SGD每次运行会得到不同的结果


 274
274


 被折叠的 条评论
为什么被折叠?
被折叠的 条评论
为什么被折叠?
 到【灌水乐园】发言


