


import numpy as np
import matplotlib as mpl
import matplotlib.pyplot as plt
mpl.rcParams['font.family'] = 'serif'
# Option Strike
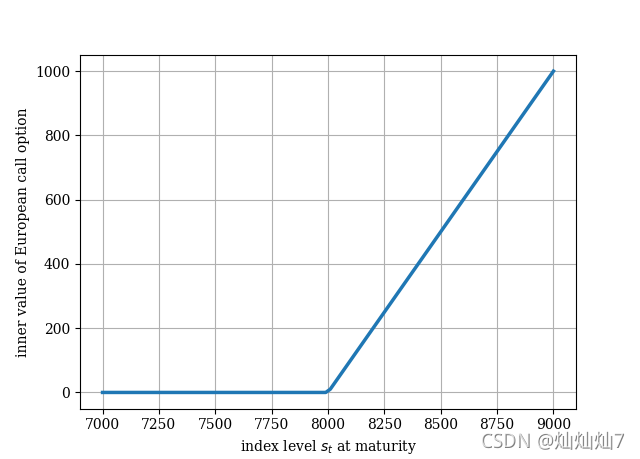
K = 8000
#Graphical Output
S = np.linspace(7000,9000,100)
h = np.maximum(S-K, 0)
plt.figure()
plt.plot(S,h,lw=2.5)
plt.xlabel('index level $s_t$ at maturity')
plt.ylabel('inner value of European call option')
plt.grid(True)
plt.show()结果:图显示如下
这些是我学习金融衍生品数分过程中学到的内容,mark一下。


 被折叠的 条评论
为什么被折叠?
被折叠的 条评论
为什么被折叠?
 到【灌水乐园】发言


