问题:
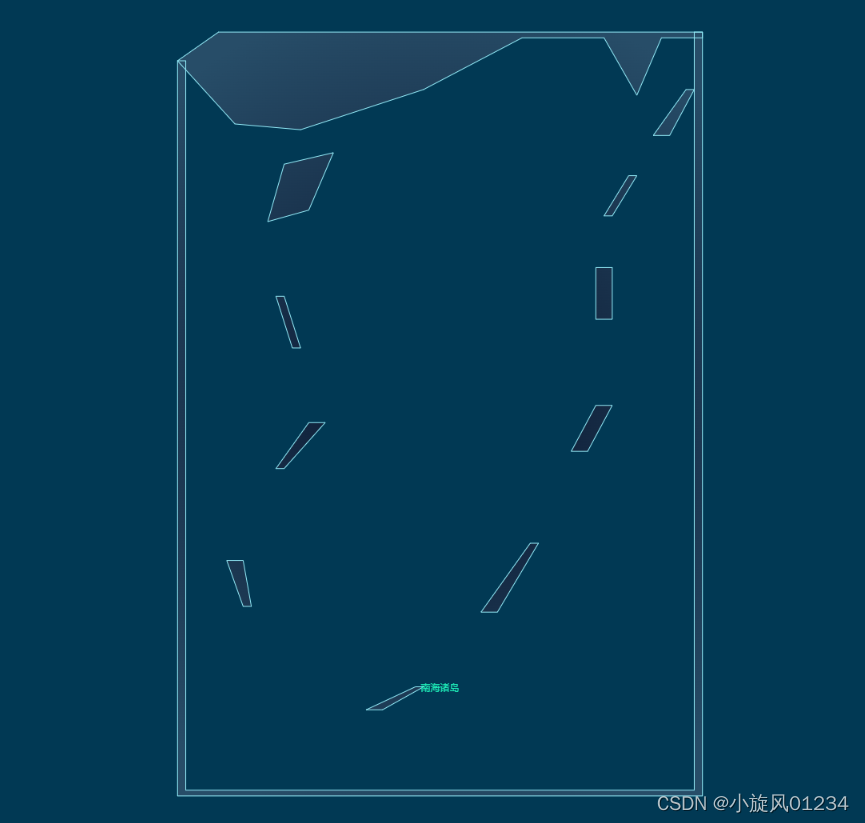
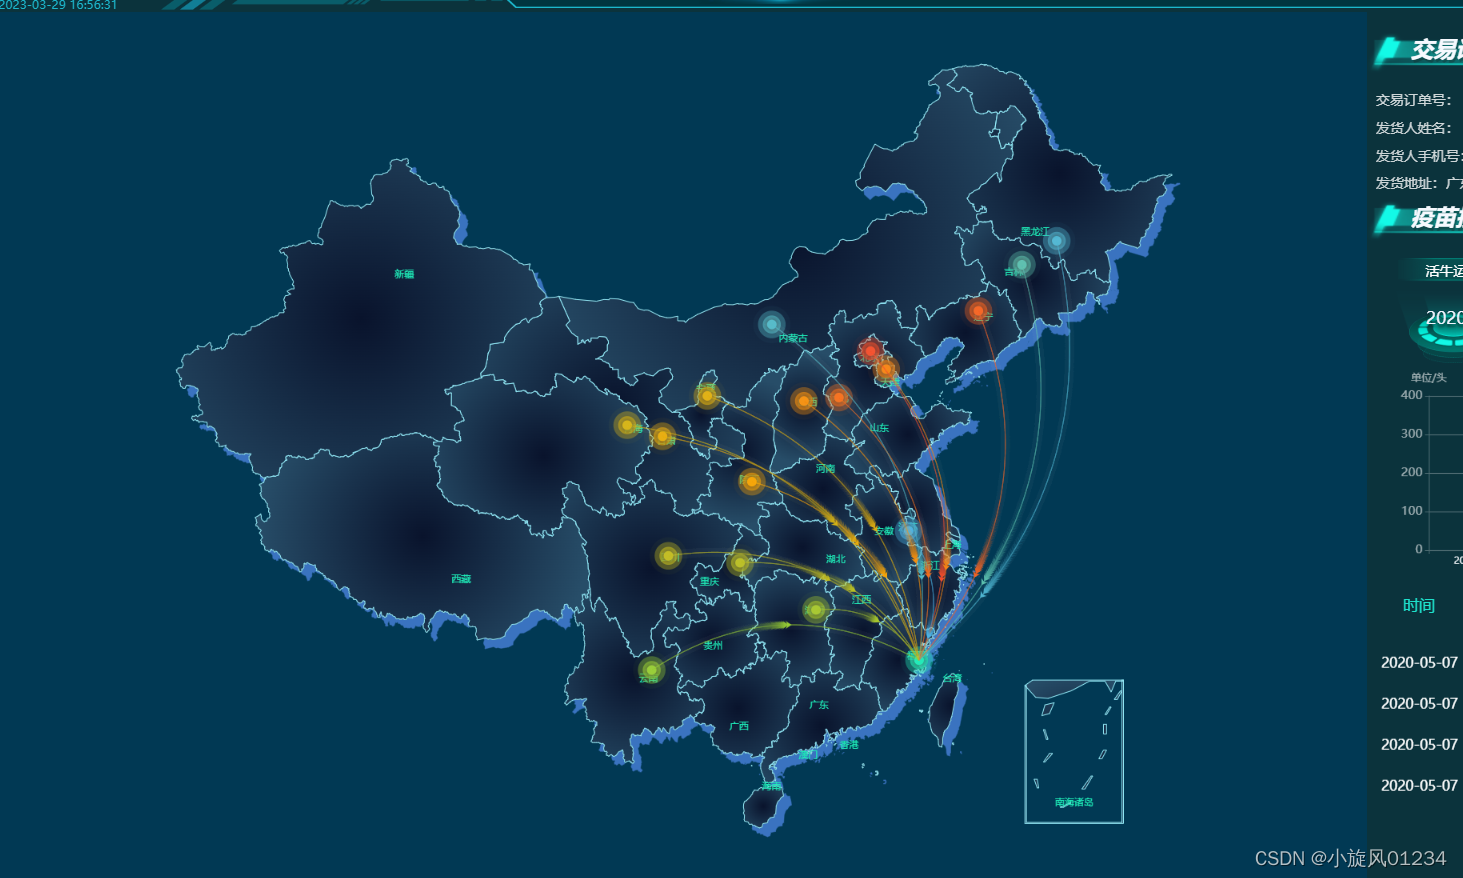
echarts5中国地图,只显示南海

说明:
echarts3版本后,因为版权问题,echarts不再内置中国地图,也没有中国地图数据,网上找的又很多有问题,或者语焉不详。。。
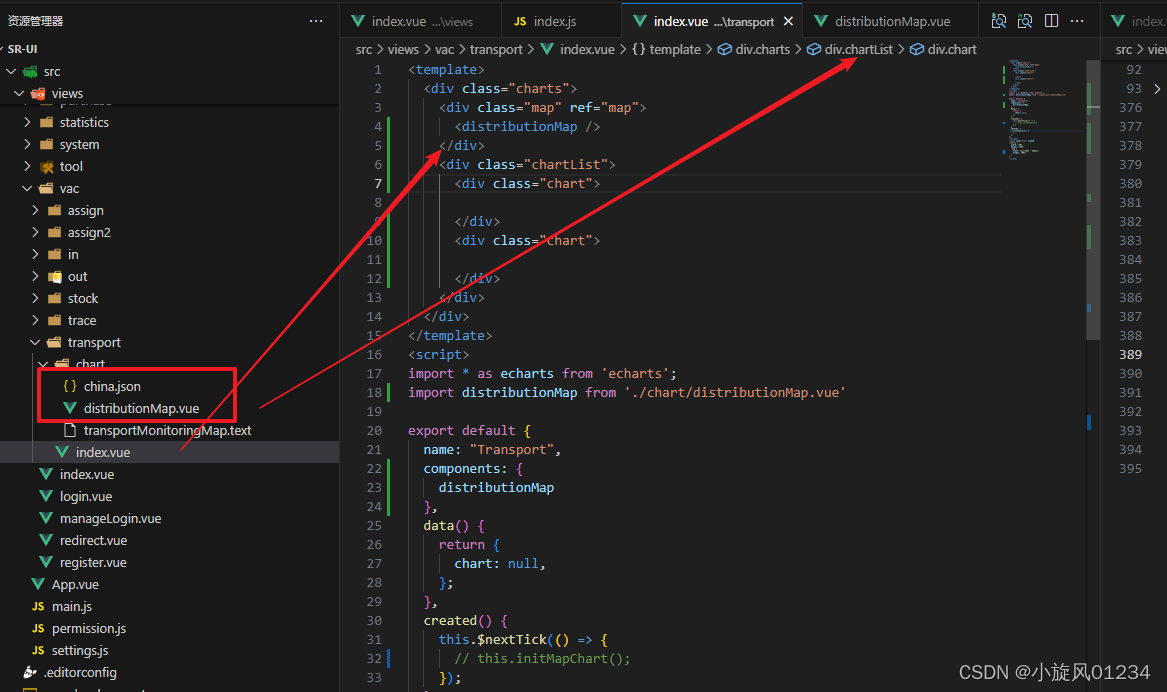
1:需要手动引入china.json文件,在public文件下,不能放src那。:
2:很多开源项目或者老项目用的jQuery的$.getJSON,vue就不要引入这玩意了,用axios的axios.get(uploadedDataURL).then((geoJson: any) => {})就行了。
3:echarts.registerMap("china", res.data)引入中国地图数据,切记看清楚要不要加.data,我因为没看清数据,活生生在这卡了几个小时
4:echarts的china.js或者china.json,下载地址如下:https://github.com/471314748/xiaotexiao,在下面一点点哦(很多人说我这个地址的文件加密了,那我把高德地图的那个地址放这里吧,进去=>2.选择需要的数据格式=>JSON API=>复制粘贴就行了,范围选择器地址:http://datav.aliyun.com/portal/school/atlas/area_selector)
5:直接的文件,另存为就行了。china.json链接:https://geo.datav.aliyun.com/areas_v3/bound/100000_full.json,直接下载(过期用上面的)
示例:

地图组件全部代码:
<template>
<div class="transportMonitoringMap" ref="echartsRef">
</div>
</template>
<script setup lang="ts">
import { ref, Ref, onMounted } from "vue"
import * as echarts from 'echarts'
import axios from 'axios'
const echartsRef: Ref = ref(null)
let myChart: any = null
// var uploadedDataURL = "./data-1528971808162-BkOXf61WX.json";
var uploadedDataURL = "./china.json";
var points = [
{ value: [118.8062, 31.9208], itemStyle: { color: "#4ab2e5" } },
{ value: [127.9688, 45.368], itemStyle: { color: "#4fb6d2" } },
{ value: [110.3467, 41.4899], itemStyle: { color: "#52b9c7" } },
{ value: [125.8154, 44.2584], itemStyle: { color: "#5abead" } },
{ value: [116.4551, 40.2539], itemStyle: { color: "#f34e2b" } },
{ value: [123.1238, 42.1216], itemStyle: { color: "#f56321" } },
{ value: [114.4995, 38.1006], itemStyle: { color: "#f56f1c" } },
{ value: [117.4219, 39.4189], itemStyle: { color: "#f58414" } },
{ value: [112.3352, 37.9413], itemStyle: { color: "#f58f0e" } },
{ value: [109.1162, 34.2004], itemStyle: { color: "#f5a305" } },
{ value: [103.5901, 36.3043], itemStyle: { color: "#e7ab0b" } },
{ value: [106.3586, 38.1775], itemStyle: { color: "#dfae10" } },
{ value: [101.4038, 36.8207], itemStyle: { color: "#d5b314" } },
{ value: [103.9526, 30.7617], itemStyle: { color: "#c1bb1f" } },
{ value: [108.384366, 30.439702], itemStyle: { color: "#b9be23" } },
{ value: [113.0823, 28.2568], itemStyle: { color: "#a6c62c" } },
{ value: [102.9199, 25.46639], itemStyle: { color: "#96cc34" } },
{ value: [119.4543, 25.9222] },
];
onMounted(() => {
initChart()
})
let initChart = () => {
if (!myChart) {
myChart = echarts.init(echartsRef.value);
}
// myChart.showLoading();
axios.get(uploadedDataURL).then((geoJson: any) => {
echarts.registerMap("china", geoJson.data)
myChart.hideLoading();
let option = {
backgroundColor: "#013954",
geo: {
map: "china",
aspectScale: 0.75, //长宽比
zoom: 1.1,
roam: false,
itemStyle: {
normal: {
areaColor: {
type: "radial",
x: 0.5,
y: 0.5,
r: 0.8,
colorStops: [
{
offset: 0,
color: "#09132c", // 0% 处的颜色
},
{
offset: 1,
color: "#274d68", // 100% 处的颜色
},
],
globalCoord: true, // 缺省为 false
},
shadowColor: "rgb(58,115,192)",
shadowOffsetX: 10,
shadowOffsetY: 11,
},
emphasis: {
areaColor: "#2AB8FF",
borderWidth: 0,
color: "green",
label: {
show: false,
},
},
},
regions: [
{
name: "南海诸岛",
itemStyle: {
areaColor: "rgba(0, 10, 52, 1)",
borderColor: "rgba(0, 10, 52, 1)",
normal: {
opacity: 0,
label: {
show: false,
color: "#009cc9",
},
},
},
},
],
},
series: [
{
type: "map",
roam: false,
mapType: 'china',
label: {
normal: {
show: true,
textStyle: {
color: "#1DE9B6",
},
},
emphasis: {
textStyle: {
color: "rgb(183,185,14)",
},
},
},
itemStyle: {
normal: {
borderColor: "rgb(147, 235, 248)",
borderWidth: 1,
areaColor: {
type: "radial",
x: 0.5,
y: 0.5,
r: 0.8,
colorStops: [
{
offset: 0,
color: "#09132c", // 0% 处的颜色
},
{
offset: 1,
color: "#274d68", // 100% 处的颜色
},
],
globalCoord: true, // 缺省为 false
},
},
emphasis: {
areaColor: "rgb(46,229,206)",
// shadowColor: 'rgb(12,25,50)',
borderWidth: 0.1,
},
},
zoom: 1.1,
// roam: false,
map: "china", //使用
// data: this.difficultData //热力图数据 不同区域 不同的底色
},
{
type: "effectScatter",
coordinateSystem: "geo",
showEffectOn: "render",
zlevel: 1,
rippleEffect: {
period: 15,
scale: 4,
brushType: "fill",
},
hoverAnimation: true,
label: {
normal: {
formatter: "{b}",
position: "right",
offset: [15, 0],
color: "#1DE9B6",
show: true,
},
},
itemStyle: {
normal: {
color: "#1DE9B6" /* function (value){ //随机颜色
return "#"+("00000"+((Math.random()*16777215+0.5)>>0).toString(16)).slice(-6);
}*/,
shadowBlur: 10,
shadowColor: "#333",
},
},
symbolSize: 12,
data: points,
}, //地图线的动画效果
{
type: "lines",
zlevel: 2,
effect: {
show: true,
period: 4, //箭头指向速度,值越小速度越快
trailLength: 0.4, //特效尾迹长度[0,1]值越大,尾迹越长重
symbol: "arrow", //箭头图标
symbolSize: 7, //图标大小
},
lineStyle: {
normal: {
color: "#1DE9B6",
width: 1, //线条宽度
opacity: 0.1, //尾迹线条透明度
curveness: 0.3, //尾迹线条曲直度
},
},
data: [
{
coords: [
[118.8062, 31.9208],
[119.4543, 25.9222],
],
lineStyle: { color: "#4ab2e5" },
},
{
coords: [
[127.9688, 45.368],
[119.4543, 25.9222],
],
lineStyle: { color: "#4fb6d2" },
},
{
coords: [
[110.3467, 41.4899],
[119.4543, 25.9222],
],
lineStyle: { color: "#52b9c7" },
},
{
coords: [
[125.8154, 44.2584],
[119.4543, 25.9222],
],
lineStyle: { color: "#5abead" },
},
{
coords: [
[116.4551, 40.2539],
[119.4543, 25.9222],
],
lineStyle: { color: "#f34e2b" },
},
{
coords: [
[123.1238, 42.1216],
[119.4543, 25.9222],
],
lineStyle: { color: "#f56321" },
},
{
coords: [
[114.4995, 38.1006],
[119.4543, 25.9222],
],
lineStyle: { color: "#f56f1c" },
},
{
coords: [
[117.4219, 39.4189],
[119.4543, 25.9222],
],
lineStyle: { color: "#f58414" },
},
{
coords: [
[112.3352, 37.9413],
[119.4543, 25.9222],
],
lineStyle: { color: "#f58f0e" },
},
{
coords: [
[109.1162, 34.2004],
[119.4543, 25.9222],
],
lineStyle: { color: "#f5a305" },
},
{
coords: [
[103.5901, 36.3043],
[119.4543, 25.9222],
],
lineStyle: { color: "#e7ab0b" },
},
{
coords: [
[106.3586, 38.1775],
[119.4543, 25.9222],
],
lineStyle: { color: "#dfae10" },
},
{
coords: [
[101.4038, 36.8207],
[119.4543, 25.9222],
],
lineStyle: { color: "#d5b314" },
},
{
coords: [
[103.9526, 30.7617],
[119.4543, 25.9222],
],
lineStyle: { color: "#c1bb1f" },
},
{
coords: [
[108.384366, 30.439702],
[119.4543, 25.9222],
],
lineStyle: { color: "#b9be23" },
},
{
coords: [
[113.0823, 28.2568],
[119.4543, 25.9222],
],
lineStyle: { color: "#a6c62c" },
},
{
coords: [
[102.9199, 25.46639],
[119.4543, 25.9222],
],
lineStyle: { color: "#96cc34" },
},
],
},
],
};
myChart.setOption(option, true);
myChart.resize();
});
}
</script>
<style lang="less" scoped>
.transportMonitoringMap {
width: 100%;
height: 100%;
// width: 855px;
// height: 746px;
}
</style>
更新(和上面的vue3版本的没关系):
vue2版本的组件:
<template>
  <div class="chartsDom">
    <div ref="echartsRef" />
  </div>
</template>

<script>
import * as echarts from "echarts";
require("echarts/theme/macarons"); // echarts theme
// import resize from "./mixins/resize";
import axios from "axios";
import uploadedDataURL from "./china.json";
// let uploadedDataURL = require("/china.json")

export default {
  //   mixins: [resize],
  props: {},
  data() {
    return {
      chart: null,
      timerChart: null,
      colors: [
        "#4ab2e5",
        "#a6c62c",
        "#4fb6d2",
        "#5abead",
        "#f34e2b",
        "#f56321",
        "#f56f1c",
        "#f58414",
        "#f58f0e",
        "#f5a305",
        "#e7ab0b",
        "#dfae10",
        "#d5b314",
        "#c1bb1f",
        "#b9be23",
        "#a6c62c",
        "#96cc34",
      ],
      lines: [],
      myChart: null,
      uploadedDataURL: uploadedDataURL,
      points: [
        { value: [118.8062, 31.9208], itemStyle: { color: "#4ab2e5" } },
        { value: [127.9688, 45.368], itemStyle: { color: "#4fb6d2" } },
        { value: [110.3467, 41.4899], itemStyle: { color: "#52b9c7" } },
        { value: [125.8154, 44.2584], itemStyle: { color: "#5abead" } },
        { value: [116.4551, 40.2539], itemStyle: { color: "#f34e2b" } },
        { value: [123.1238, 42.1216], itemStyle: { color: "#f56321" } },
        { value: [114.4995, 38.1006], itemStyle: { color: "#f56f1c" } },
        { value: [117.4219, 39.4189], itemStyle: { color: "#f58414" } },
        { value: [112.3352, 37.9413], itemStyle: { color: "#f58f0e" } },
        { value: [109.1162, 34.2004], itemStyle: { color: "#f5a305" } },
        { value: [103.5901, 36.3043], itemStyle: { color: "#e7ab0b" } },
        { value: [106.3586, 38.1775], itemStyle: { color: "#dfae10" } },
        { value: [101.4038, 36.8207], itemStyle: { color: "#d5b314" } },
        { value: [103.9526, 30.7617], itemStyle: { color: "#c1bb1f" } },
        { value: [108.384366, 30.439702], itemStyle: { color: "#b9be23" } },
        { value: [113.0823, 28.2568], itemStyle: { color: "#a6c62c" } },
        { value: [102.9199, 25.46639], itemStyle: { color: "#96cc34" } },
        { value: [119.4543, 25.9222] },
      ],
    };
  },
  watch: {},
  mounted() {
    this.$nextTick(() => {
      this.initChart();
    });
  },
  beforeDestroy() {
    if (!this.chart) {
      return;
    }
    // this.chart.dispose();
    // this.chart = null;
    // clearTimeout(this.timerChart);
  },
  methods: {
    initChart() {
      if (!this.myChart) {
        this.myChart = echarts.init(this.$refs.echartsRef);
      }
      //     this.myChart.showLoading();
      //   console.log(this.uploadedDataURL);
      //   axios.get(uploadedDataURL).then((geoJson) => {
      // console.log('geoJson', geoJson);
      // echarts.registerMap("china", geoJson.data);
      echarts.registerMap("china", uploadedDataURL);

      this.myChart.hideLoading();
      let option = {
        backgroundColor: "#013954",

        geo: {
          map: "china",
          aspectScale: 0.75, //长宽比
          zoom: 1.1,
          roam: false,
          itemStyle: {
            normal: {
              areaColor: {
                type: "radial",
                x: 0.5,
                y: 0.5,
                r: 0.8,
                colorStops: [
                  {
                    offset: 0,
                    color: "#09132c", // 0% 处的颜色
                  },
                  {
                    offset: 1,
                    color: "#274d68", // 100% 处的颜色
                  },
                ],
                globalCoord: true, // 缺省为 false
              },
              shadowColor: "rgb(58,115,192)",
              shadowOffsetX: 10,
              shadowOffsetY: 11,
            },
            emphasis: {
              areaColor: "#2AB8FF",
              borderWidth: 0,
              color: "green",
              label: {
                show: false,
              },
            },
          },
          regions: [
            {
              name: "南海诸岛",
              itemStyle: {
                areaColor: "rgba(0, 10, 52, 1)",

                borderColor: "rgba(0, 10, 52, 1)",
                normal: {
                  opacity: 0,
                  label: {
                    show: false,
                    color: "#009cc9",
                  },
                },
              },
            },
          ],
        },
        series: [
          {
            type: "map",
            roam: false,
            mapType: "china",
            label: {
              normal: {
                show: true,
                textStyle: {
                  color: "#1DE9B6",
                },
              },
              emphasis: {
                textStyle: {
                  color: "rgb(183,185,14)",
                },
              },
            },

            itemStyle: {
              normal: {
                borderColor: "rgb(147, 235, 248)",
                borderWidth: 1,
                areaColor: {
                  type: "radial",
                  x: 0.5,
                  y: 0.5,
                  r: 0.8,
                  colorStops: [
                    {
                      offset: 0,
                      color: "#09132c", // 0% 处的颜色
                    },
                    {
                      offset: 1,
                      color: "#274d68", // 100% 处的颜色
                    },
                  ],
                  globalCoord: true, // 缺省为 false
                },
              },
              emphasis: {
                areaColor: "rgb(46,229,206)",
                //    shadowColor: 'rgb(12,25,50)',
                borderWidth: 0.1,
              },
            },
            zoom: 1.1,
            //     roam: false,
            map: "china", //使用
            // data: this.difficultData //热力图数据   不同区域 不同的底色
          },
          {
            type: "effectScatter",
            coordinateSystem: "geo",
            showEffectOn: "render",
            zlevel: 1,
            rippleEffect: {
              period: 15,
              scale: 4,
              brushType: "fill",
            },
            hoverAnimation: true,
            label: {
              normal: {
                formatter: "{b}",
                position: "right",
                offset: [15, 0],
                color: "#1DE9B6",
                show: true,
              },
            },
            itemStyle: {
              normal: {
                color: "#1DE9B6" /* function (value){ //随机颜色
 return "#"+("00000"+((Math.random()*16777215+0.5)>>0).toString(16)).slice(-6);
 }*/,
                shadowBlur: 10,
                shadowColor: "#333",
              },
            },
            symbolSize: 12,
            data: this.points,
          }, //地图线的动画效果
          {
            type: "lines",
            zlevel: 2,
            effect: {
              show: true,
              period: 4, //箭头指向速度,值越小速度越快
              trailLength: 0.4, //特效尾迹长度[0,1]值越大,尾迹越长重
              symbol: "arrow", //箭头图标
              symbolSize: 7, //图标大小
            },
            lineStyle: {
              normal: {
                color: "#1DE9B6",
                width: 1, //线条宽度
                opacity: 0.1, //尾迹线条透明度
                curveness: 0.3, //尾迹线条曲直度
              },
            },
            data: [
              {
                coords: [
                  [118.8062, 31.9208],
                  [100.4564, 38.931387],
                ],
                lineStyle: { color: "#4ab2e5" },
              },
              {
                coords: [
                  [127.9688, 45.368],
                  [100.4564, 38.931387],
                ],
                lineStyle: { color: "#4fb6d2" },
              },
              {
                coords: [
                  [110.3467, 41.4899],
                  [100.4564, 38.931387],
                ],
                lineStyle: { color: "#52b9c7" },
              },
              {
                coords: [
                  [125.8154, 44.2584],
                  [100.4564, 38.931387],
                ],
                lineStyle: { color: "#5abead" },
              },
              {
                coords: [
                  [116.4551, 40.2539],
                  [100.4564, 38.931387],
                ],
                lineStyle: { color: "#f34e2b" },
              },
              {
                coords: [
                  [123.1238, 42.1216],
                  [100.4564, 38.931387],
                ],
                lineStyle: { color: "#f56321" },
              },
              {
                coords: [
                  [114.4995, 38.1006],
                  [100.4564, 38.931387],
                ],
                lineStyle: { color: "#f56f1c" },
              },
              {
                coords: [
                  [117.4219, 39.4189],
                  [100.4564, 38.931387],
                ],
                lineStyle: { color: "#f58414" },
              },
              {
                coords: [
                  [112.3352, 37.9413],
                  [100.4564, 38.931387],
                ],
                lineStyle: { color: "#f58f0e" },
              },
              {
                coords: [
                  [109.1162, 34.2004],
                  [100.4564, 38.931387],
                ],
                lineStyle: { color: "#f5a305" },
              },
              {
                coords: [
                  [103.5901, 36.3043],
                  [100.4564, 38.931387],
                ],
                lineStyle: { color: "#e7ab0b" },
              },
              {
                coords: [
                  [106.3586, 38.1775],
                  [100.4564, 38.931387],
                ],
                lineStyle: { color: "#dfae10" },
              },
              {
                coords: [
                  [101.4038, 36.8207],
                  [100.4564, 38.931387],
                ],
                lineStyle: { color: "#d5b314" },
              },
              {
                coords: [
                  [103.9526, 30.7617],
                  [100.4564, 38.931387],
                ],
                lineStyle: { color: "#c1bb1f" },
              },
              {
                coords: [
                  [108.384366, 30.439702],
                  [100.4564, 38.931387],
                ],
                lineStyle: { color: "#b9be23" },
              },
              {
                coords: [
                  [113.0823, 28.2568],
                  [100.4564, 38.931387],
                ],
                lineStyle: { color: "#a6c62c" },
              },
              {
                coords: [
                  [102.9199, 25.46639],
                  [100.4564, 38.931387],
                ],
                lineStyle: { color: "#96cc34" },
              },
            ],
          },
        ],
      };
      this.myChart.setOption(option, true);
      this.myChart.resize();
      //   });
    },
  },
};
</script>

<style lang="scss" scoped>
.chartsDom {
  width: 100%;
  height: 100%;
  > div {
    width: 100%;
    height: 100%;
  }
}
</style>
使用方法:


 625
625


 被折叠的 条评论
为什么被折叠?


